
fig11
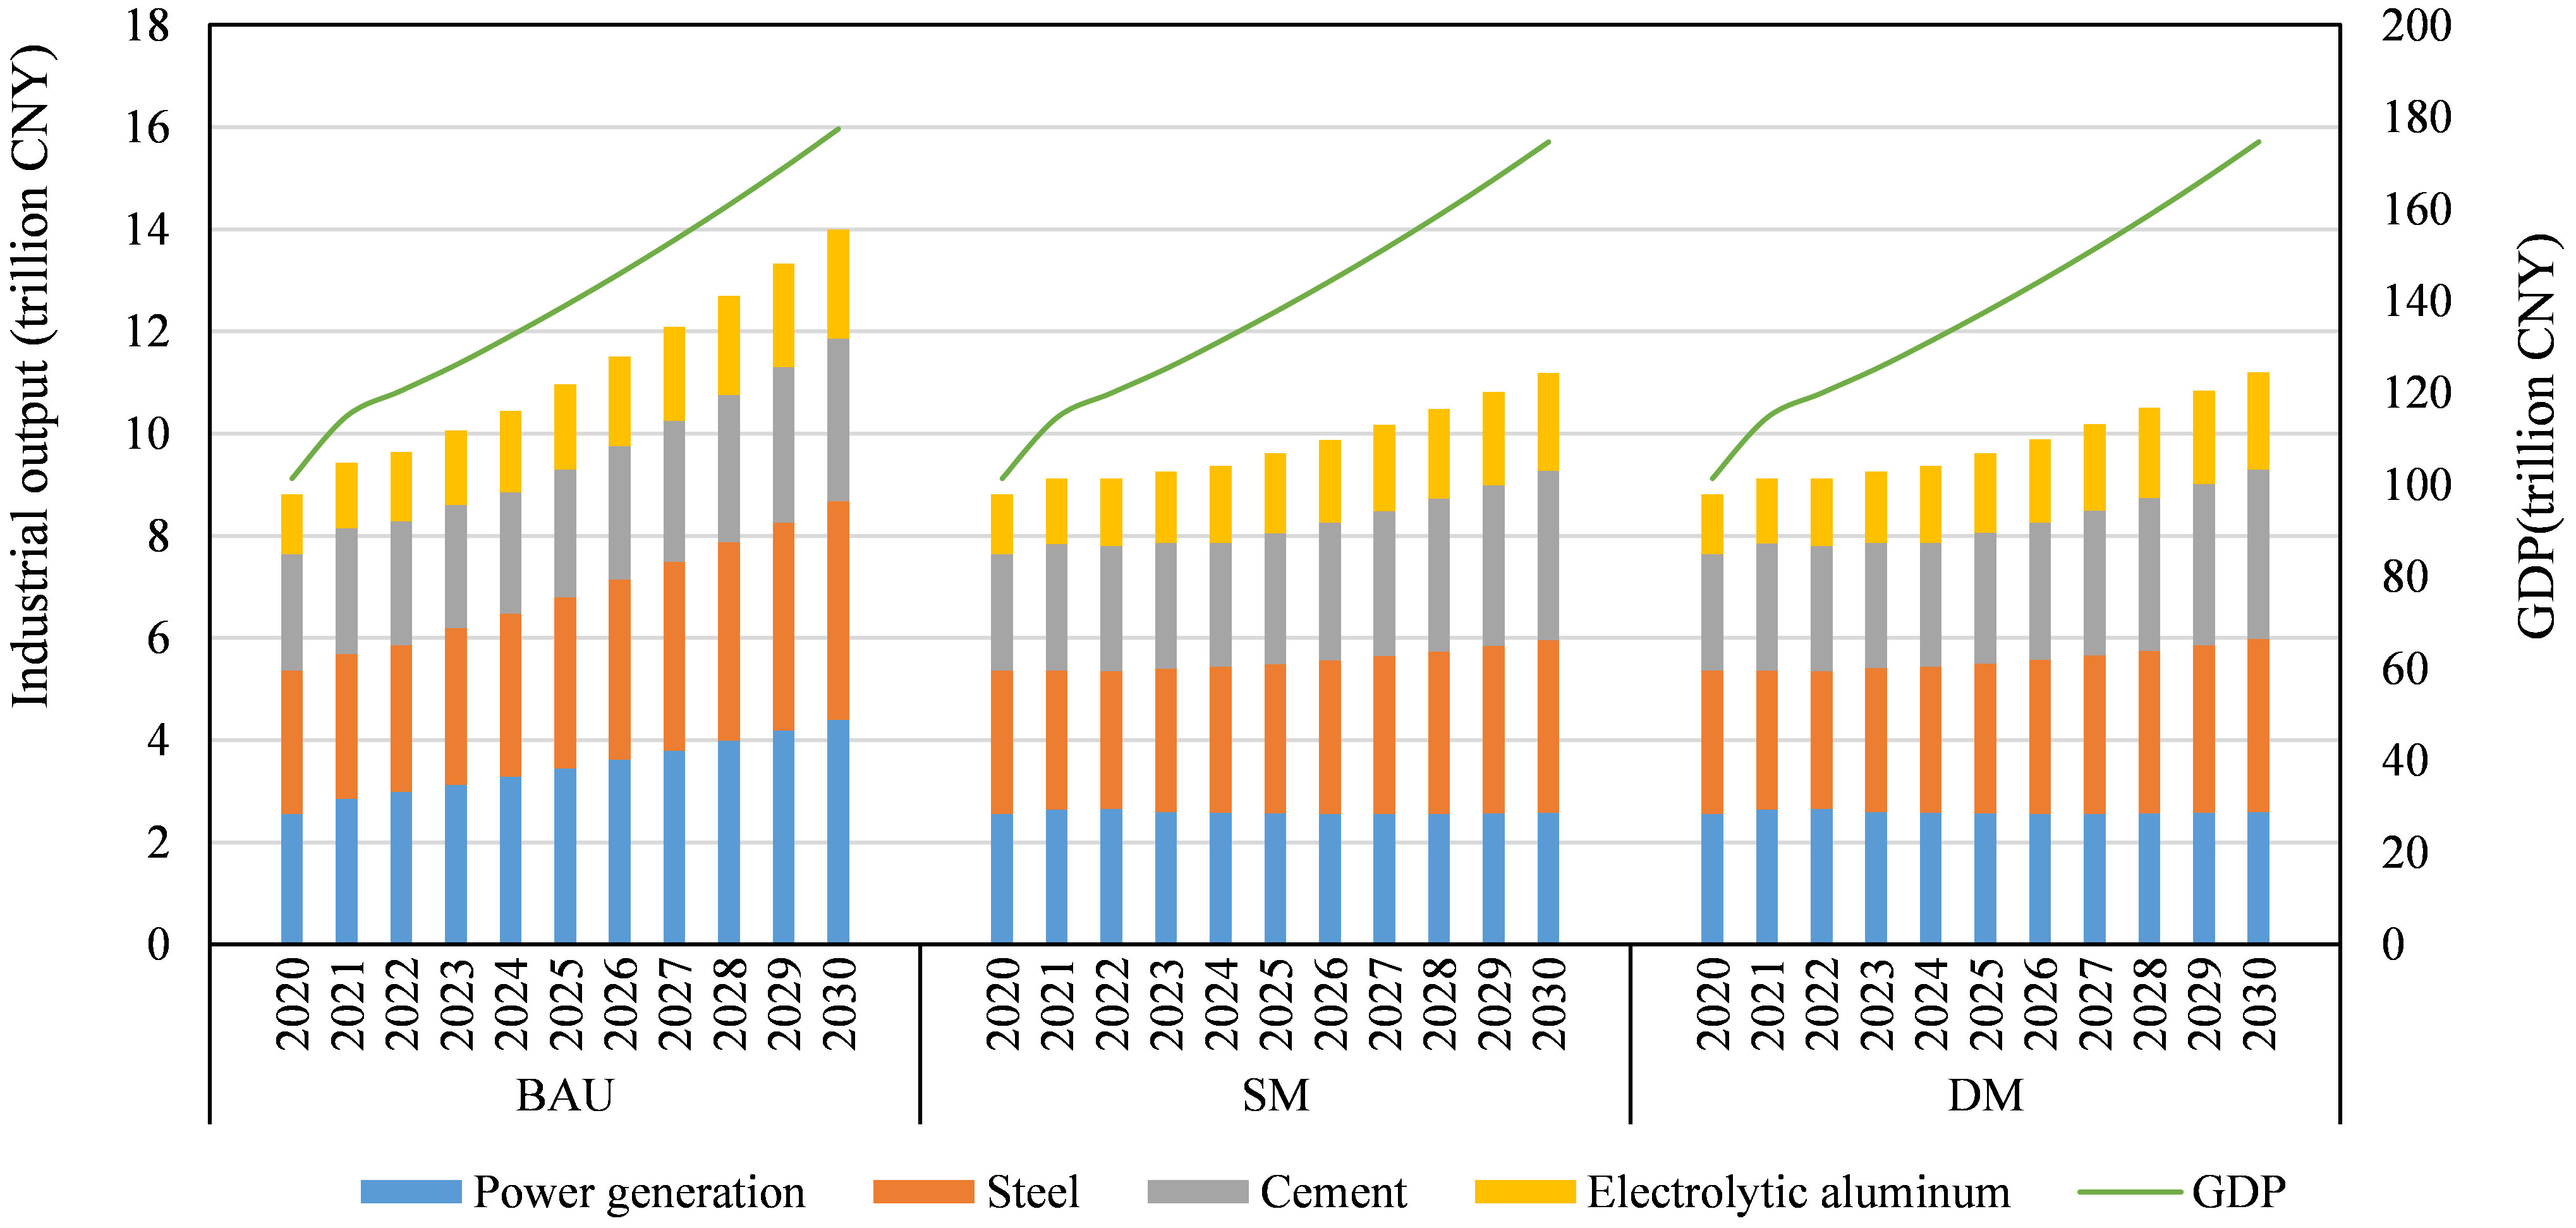
Figure 11. Trends in GDP and sectoral output under the three scenarios. The outputs of power generation, steel, cement, and electrolytic aluminum are presented as stacked bars, while the outputs of other industries are included in the aggregate GDP calculation. BAU is the baseline scenario with no carbon trading market. SM is the single market scenario with ETS. DM is the dual market scenario integrating ETS and CCER. GDP: Gross domestic product; CCER: China Certified Emission Reduction; ETS: China’s Emissions Trading System.