


fig2
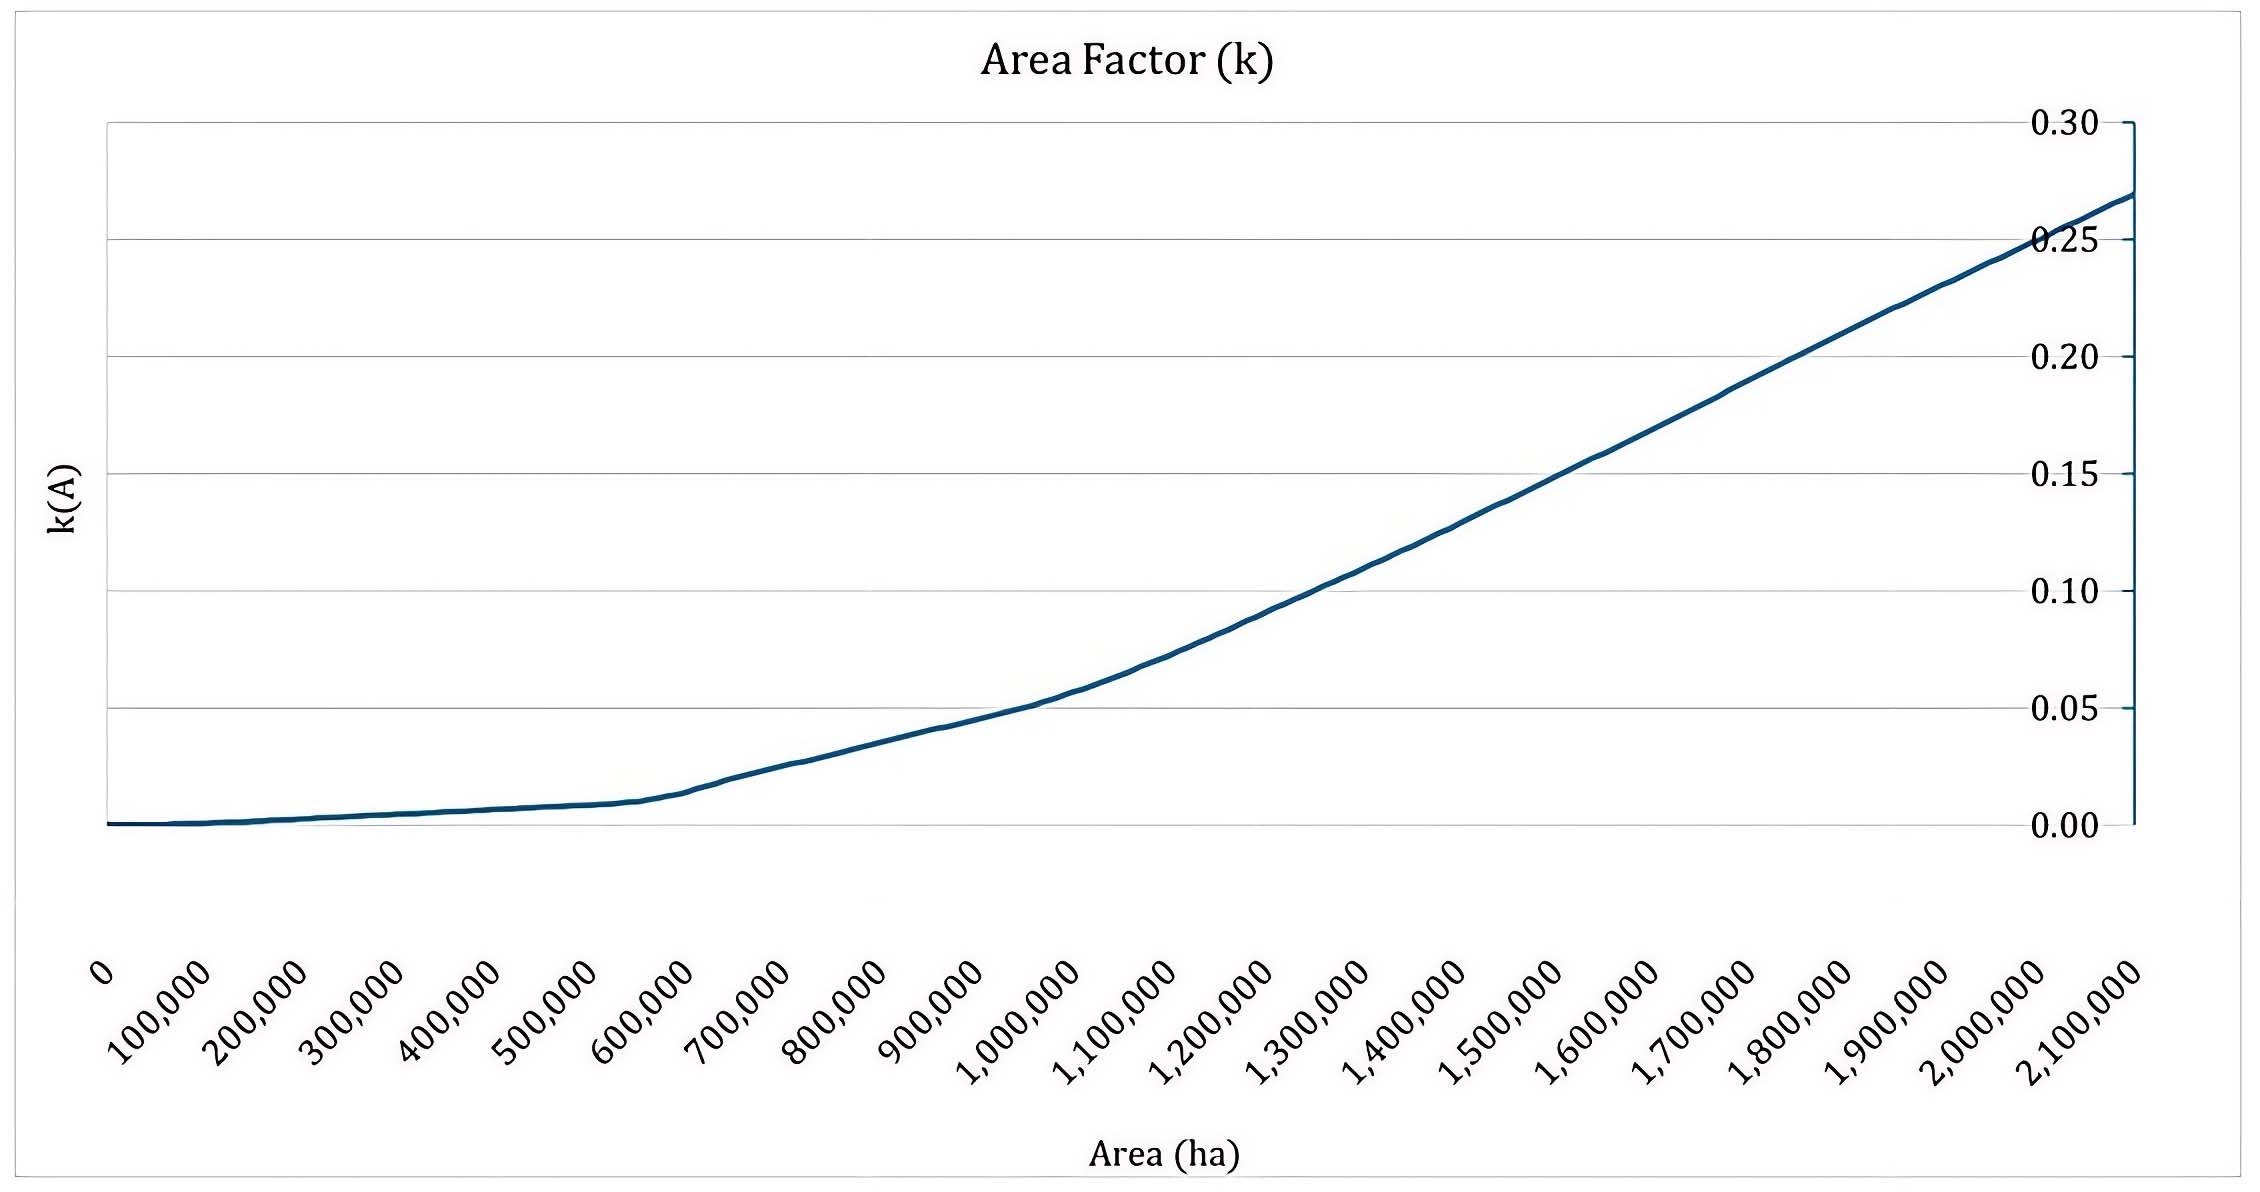
Figure 2. Continuous relationship between project area (A) and area factor (k). The curve of the equation and the graphic were generated in R, from ggplot package.
Figure 2. Continuous relationship between project area (A) and area factor (k). The curve of the equation and the graphic were generated in R, from ggplot package.


All published articles are preserved here permanently
https://www.portico.org/publishers/oae/


