


fig1
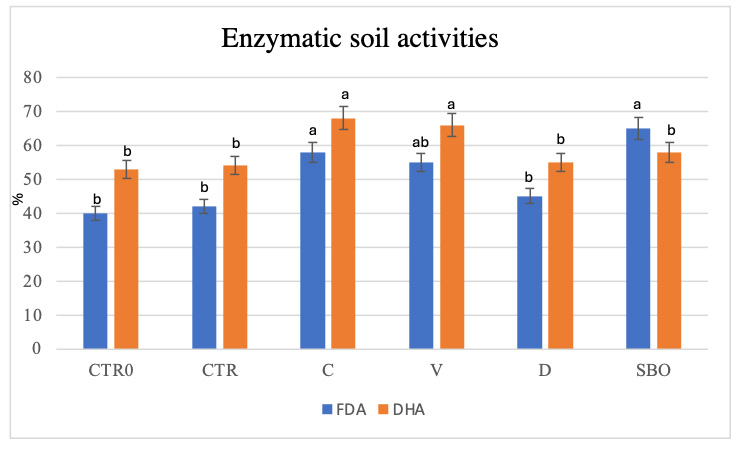
Figure 1. Fluorescein diacetate (FDA, μg fluorescein g-1 d.s.) and dehydrogenase activity (DHA, μg TTF g-1 h-1 d.s.) in soil at the initial state (CTR0), untreated soil (CTR), soil treated with compost (C), vermicompost (V), digestate (D) and sulfur bentonite with olive pomace (SBO). Data are the mean of three replications ± standard deviation. Different letters indicate statistically significant differences among treatments according to Tukey’s test (P < 0.05).


