


fig4
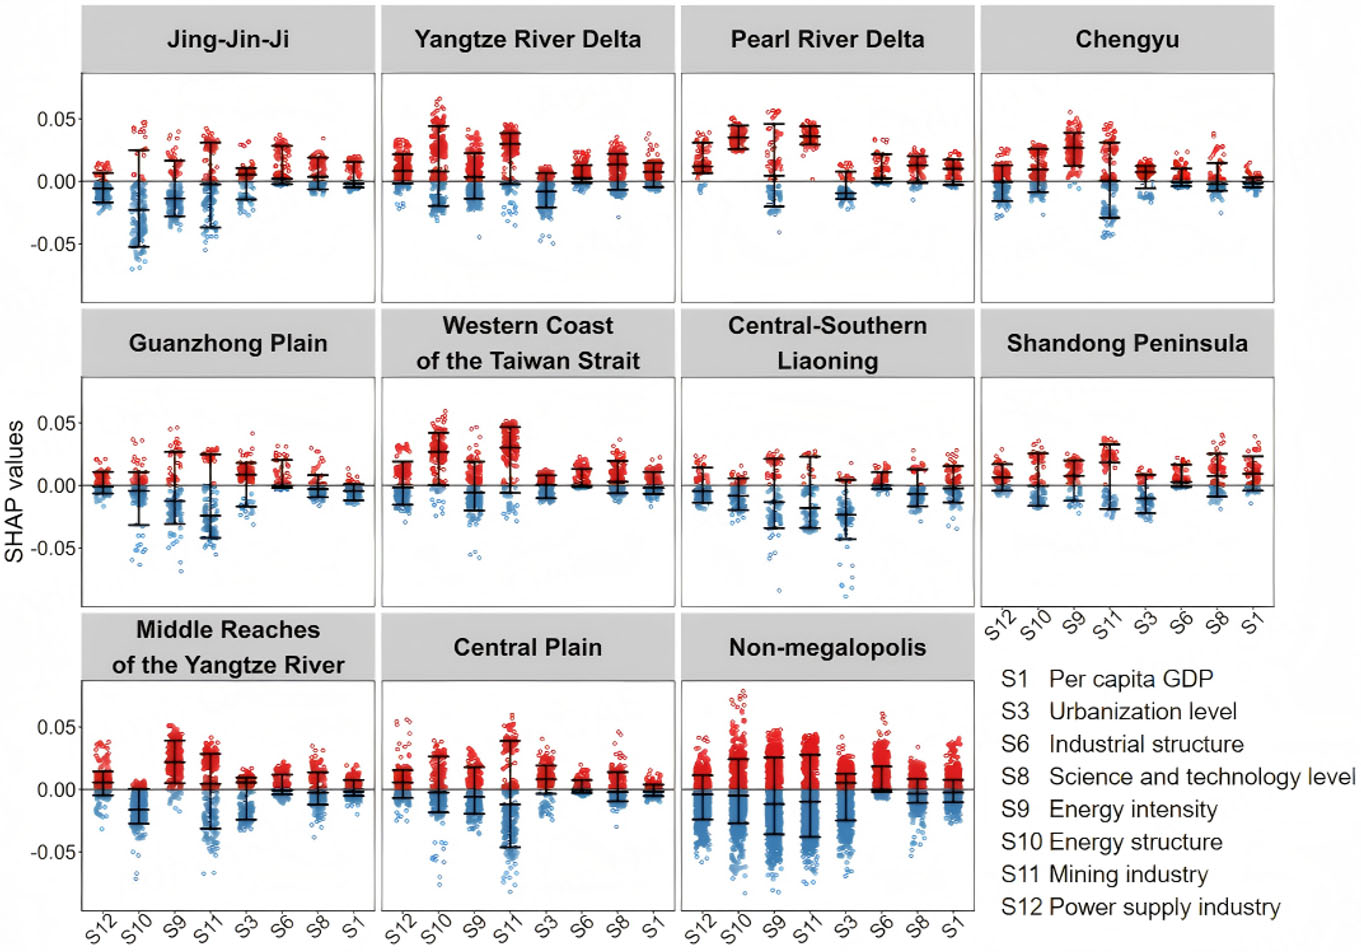
Figure 4. Analysis of synergistic governance advantages and constraints in urban agglomerations. The top and bottom lines represent the 10th and 90th percentiles, respectively, with the middle line indicating the median. Red dots denote positive SHAP values, reflecting a positive impact of the variable on urban synergistic governance, while blue dots indicate negative SHAP values and thus a negative impact.


