


fig3
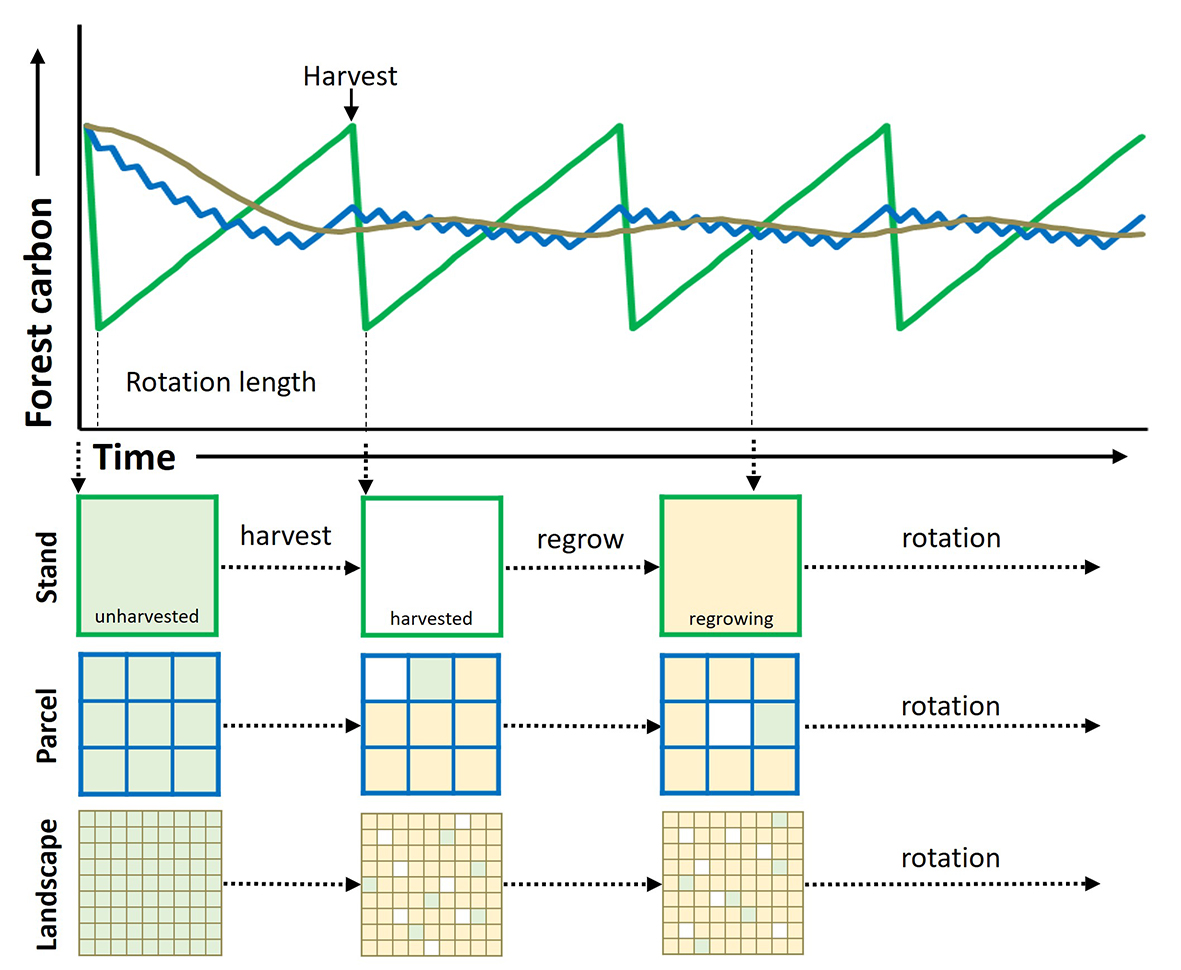
Figure 3. Illustration of forest carbon dynamics under different spatial and temporal scales (The concept of the figure is referenced from Janowiak et al.[42]). Fluctuations of forest carbon per unit area in the line graph depict carbon debt and its payback time at different forest scales. The gridded plots illustrate the harvest rotation of forest stand, parcel and landscape that leads to different behaviors of the dynamics of area-averaged carbon storage.


