


fig8
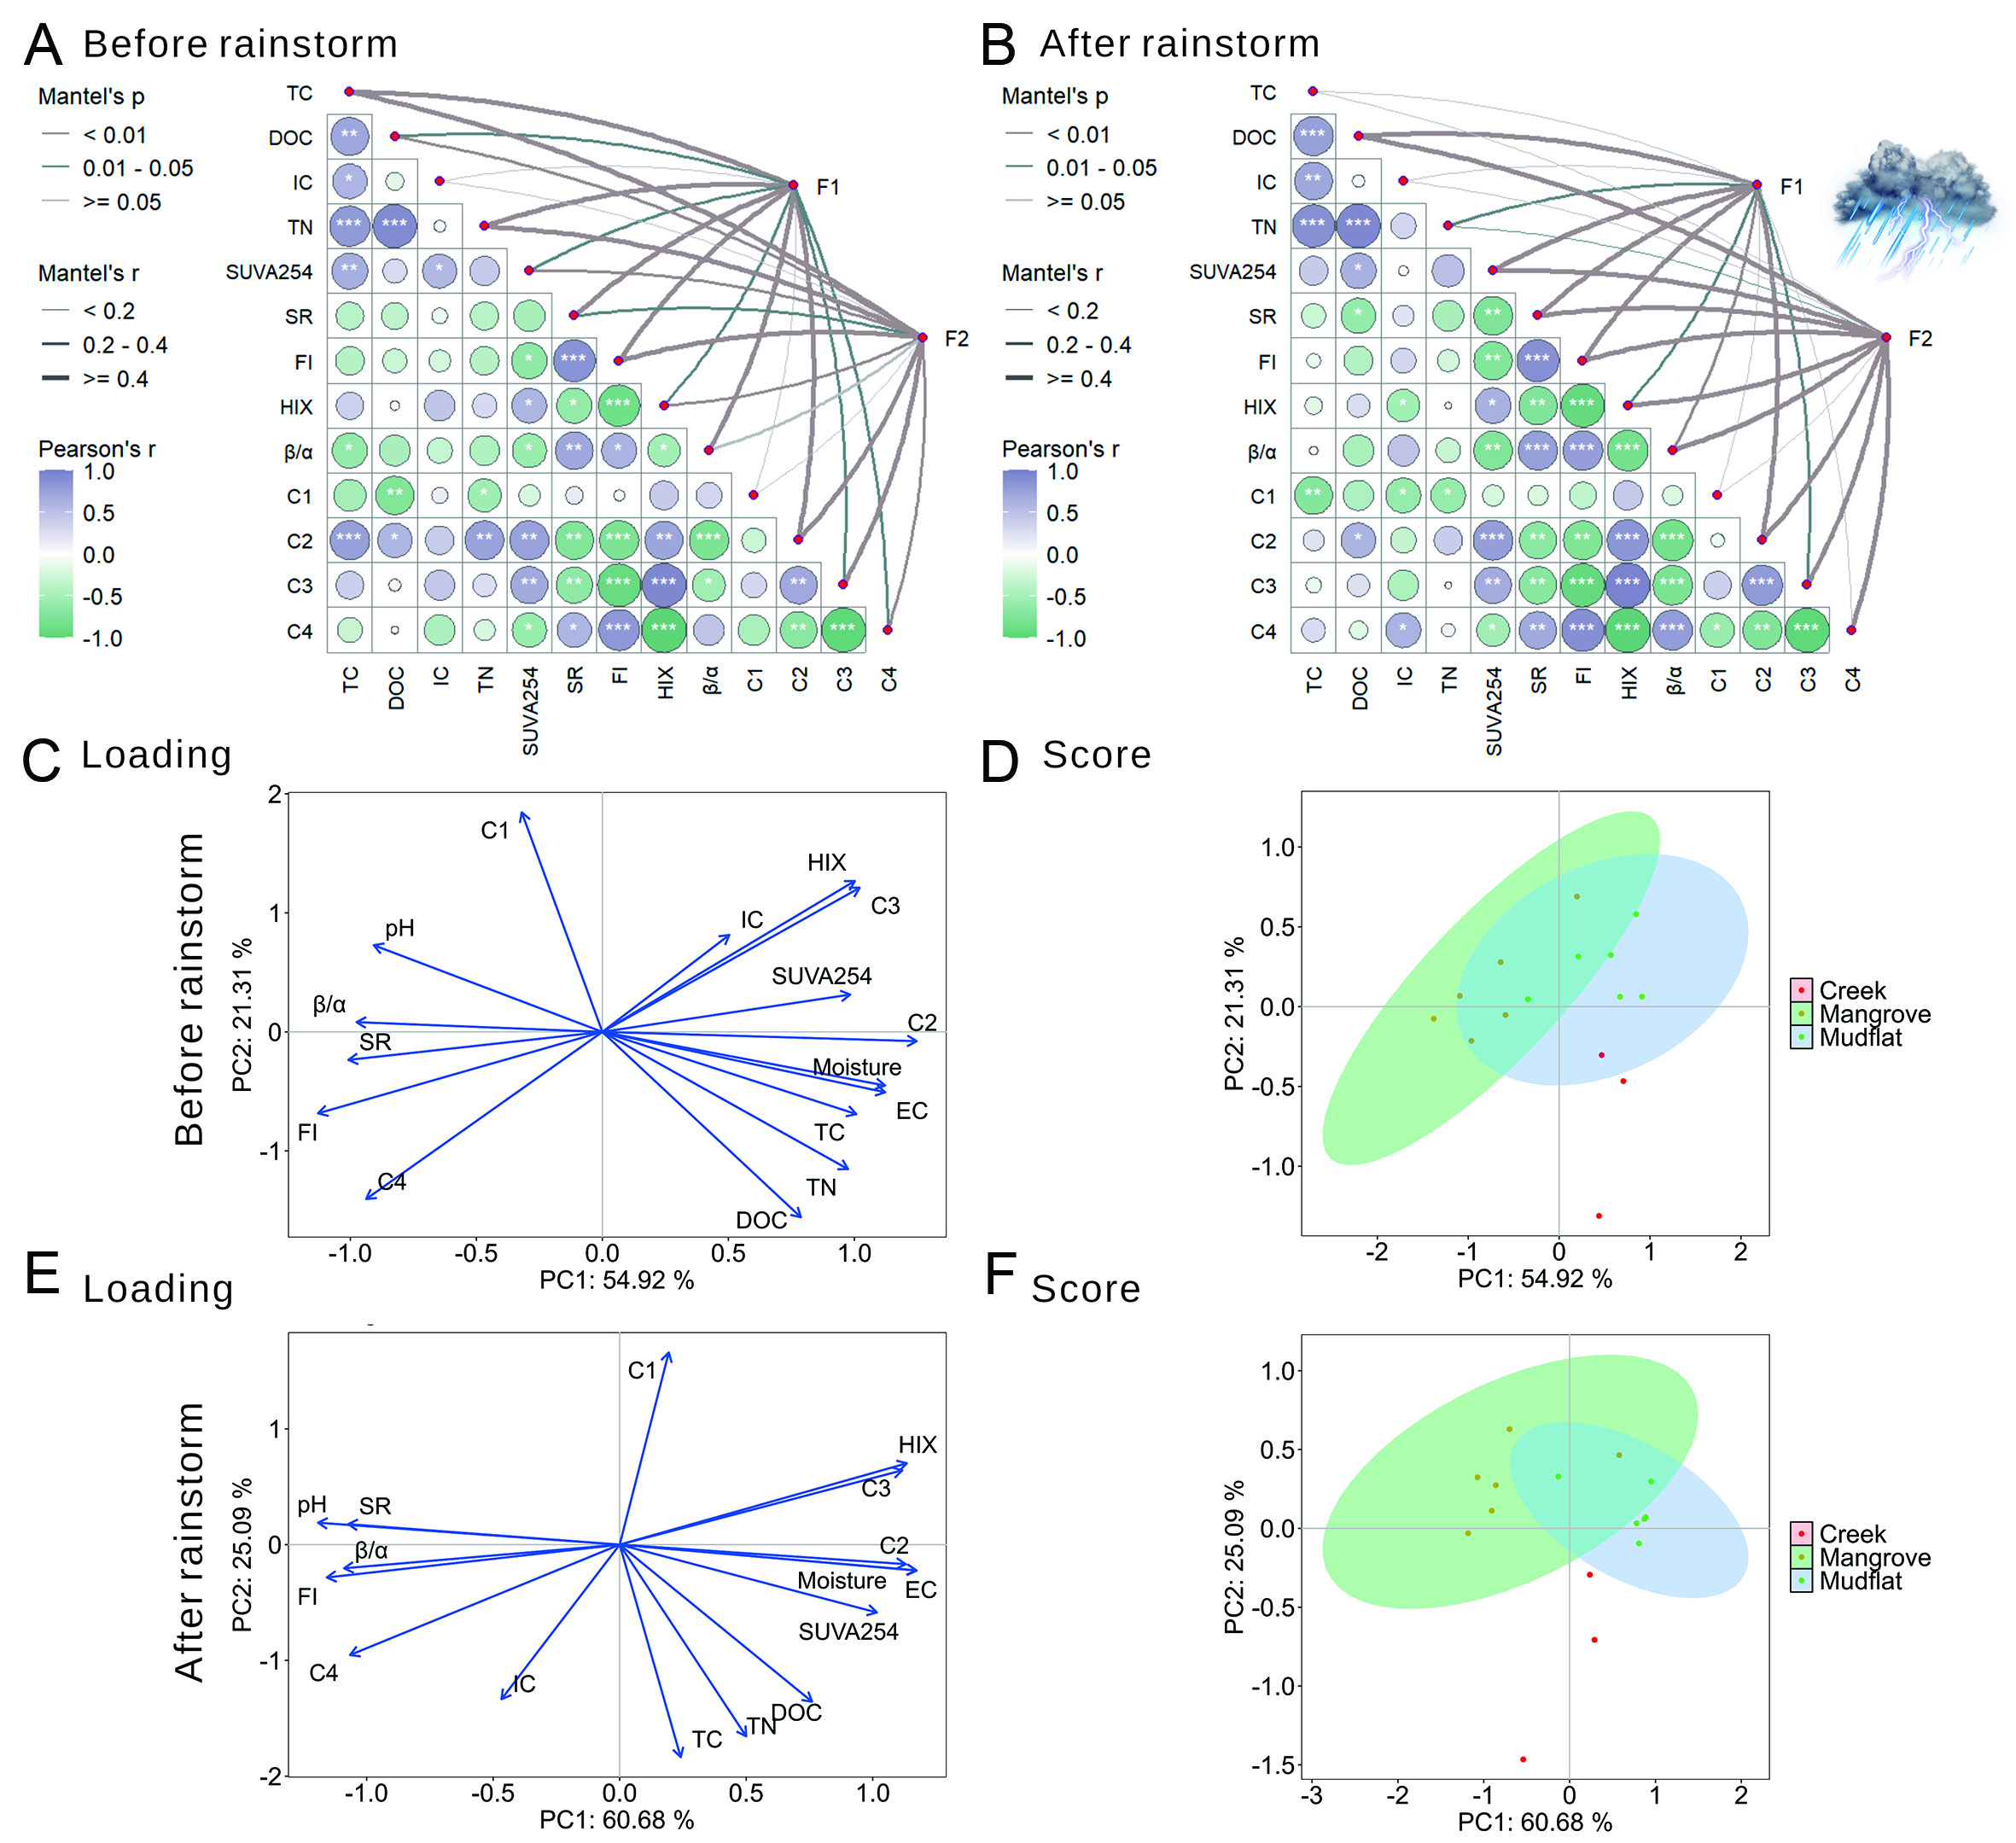
Figure 8. Mantel correlation maps showing relationships between DOC variables and environmental factors before (A) and after (B) rainstorms. Environmental parameters were grouped into geochemical (F1: pH, EC, moisture) and particle size (F2: gravel, sand, silt, clay) categories. Edge width indicates Mantel's Pearson values, edge colors show significance levels, and node properties represent partial Pearson statistics with permutation-based significance. Pairwise environmental correlations are displayed using Pearson coefficient color gradients (Asterisks denote the level of statistical significance: *P ≤ 0.05, **P ≤ 0.01, ***P ≤ 0.001). Principal component analysis (C-F) demonstrates environmental controls on DOC and spectral properties across storm conditions. Blue arrows show environmental variable loadings (15 degrees of freedom), while colored circles represent sample scores for mudflat (blue), mangrove (green), and tidal creek (red) habitats.


