


fig6
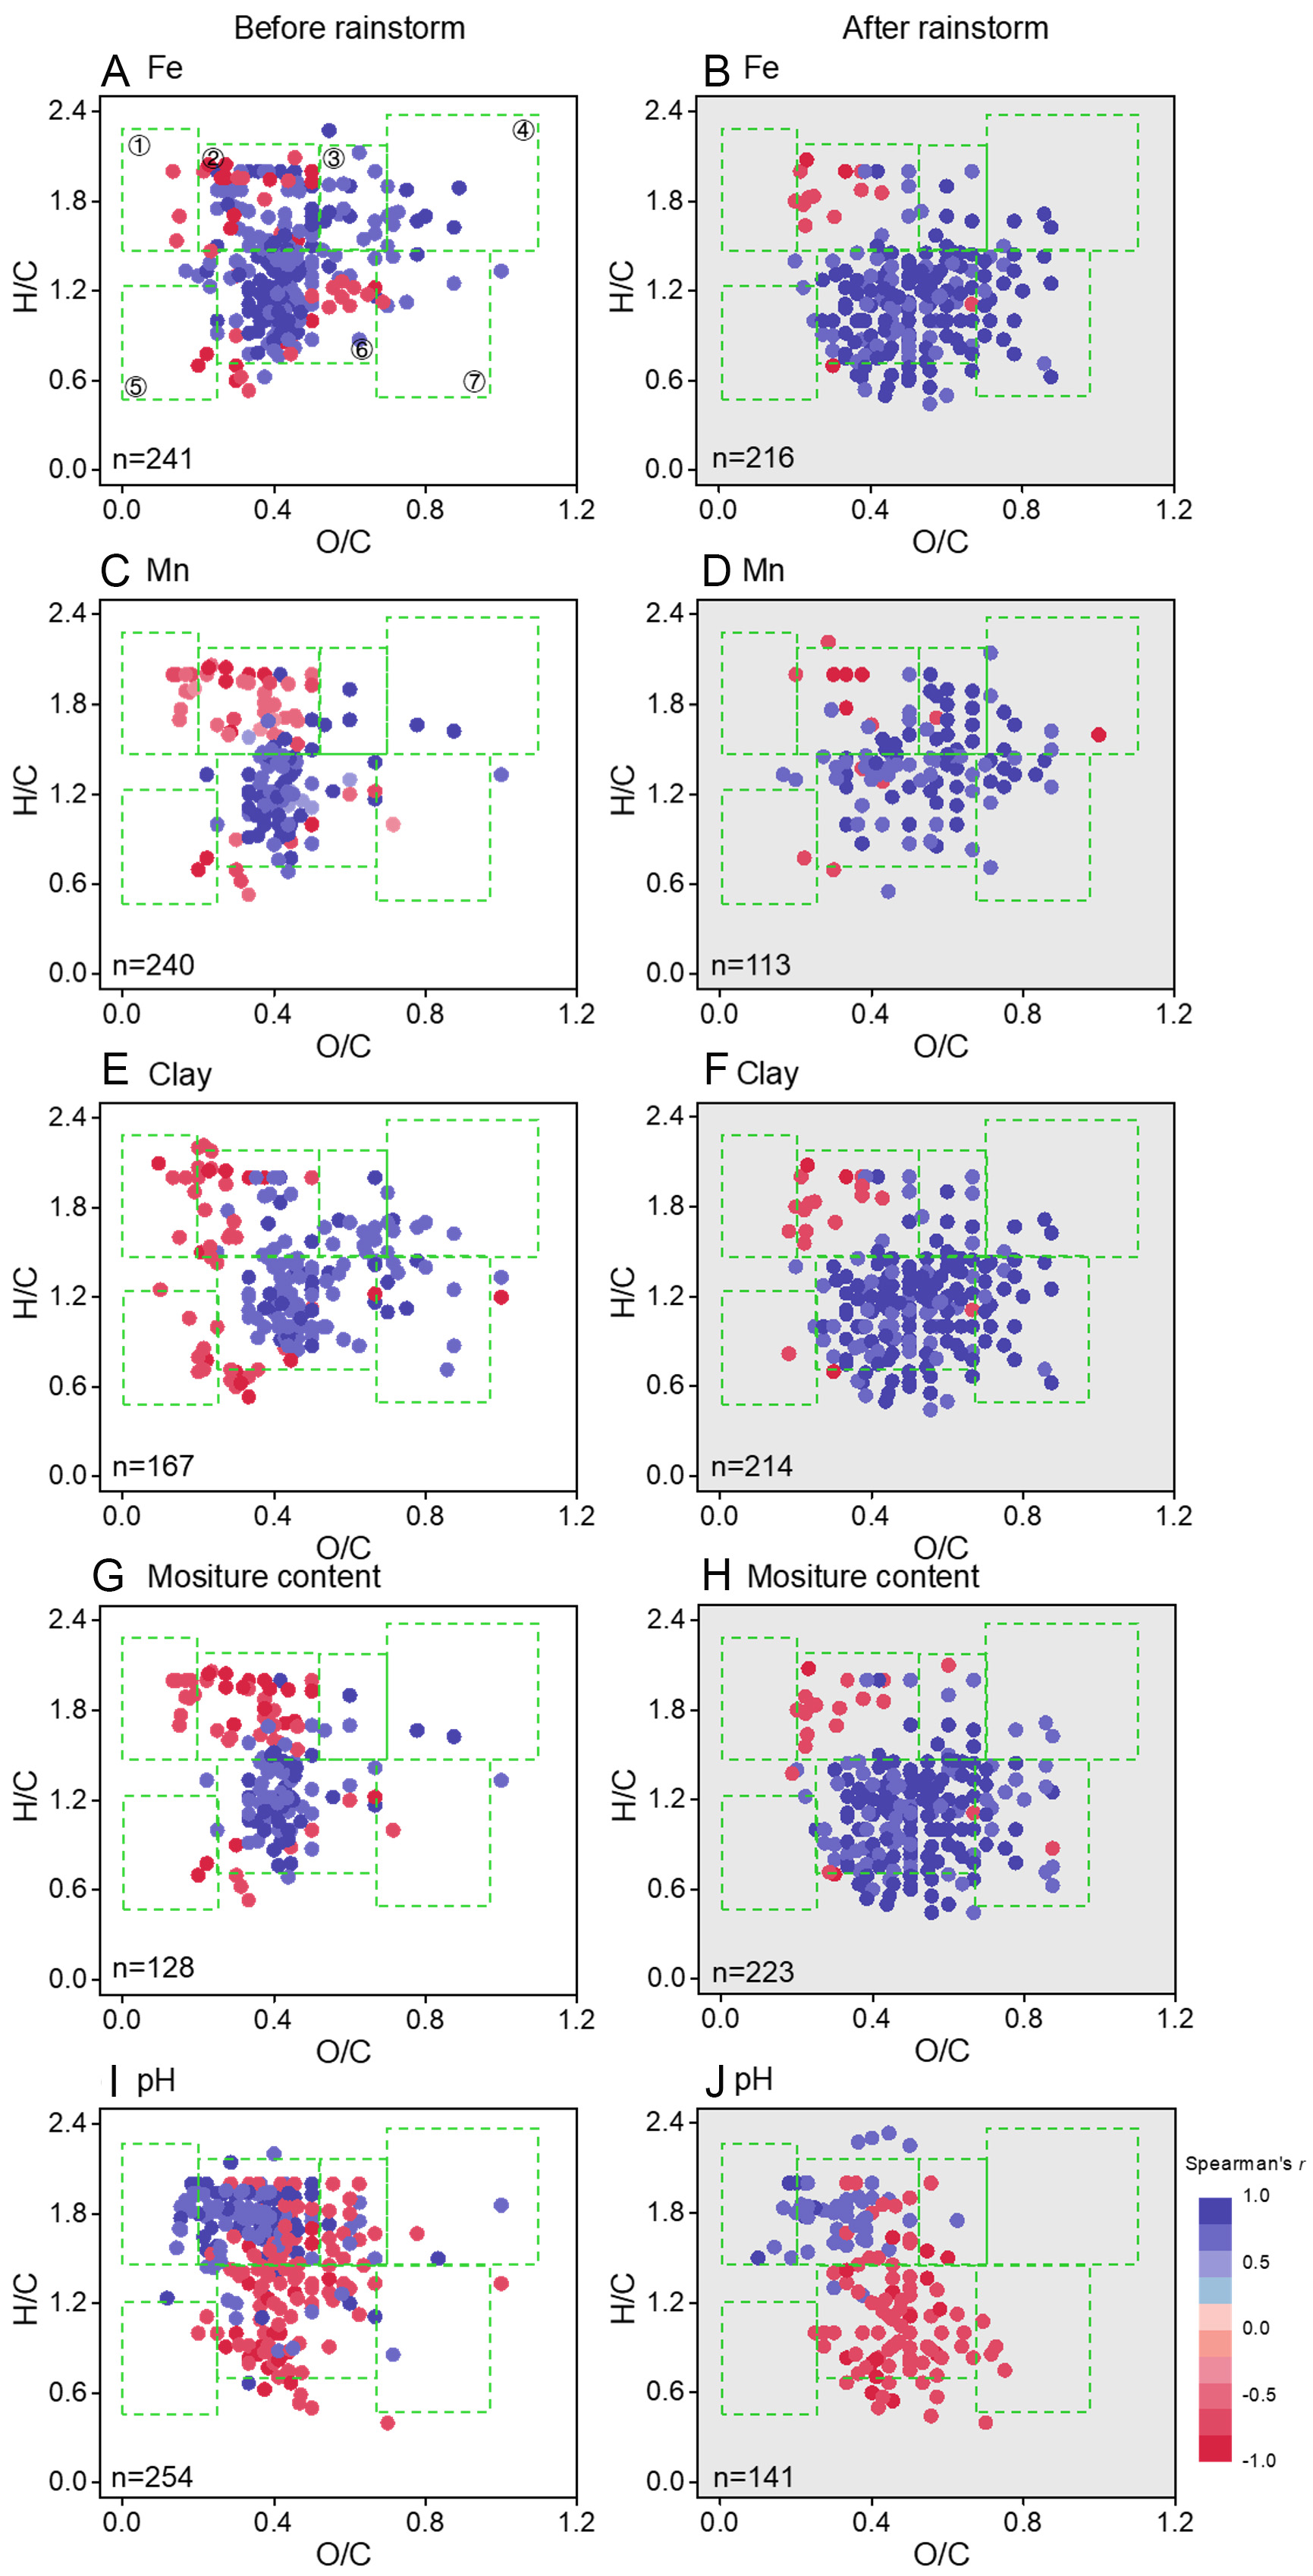
Figure 6. Correlation analysis demonstrating significant relationships (Spearman, P < 0.05) between molecular intensities and sediment properties (Fe, Mn, clay, moisture, pH) before (A, C, E, G, I) and after (B, D, F, H, J) extreme rainstorm events. Color gradients represent correlation strength and direction (red: positive; blue: negative). Rectangular overlays categorize biomolecular compounds: lipid-, protein-, amino sugar-, carbohydrate-, condensed aromatic-, lignin-, and tannin-like classes.


