fig2

Response of dissolved organic carbon molecular footprints in mangrove tidal flats to extreme rainstorm events

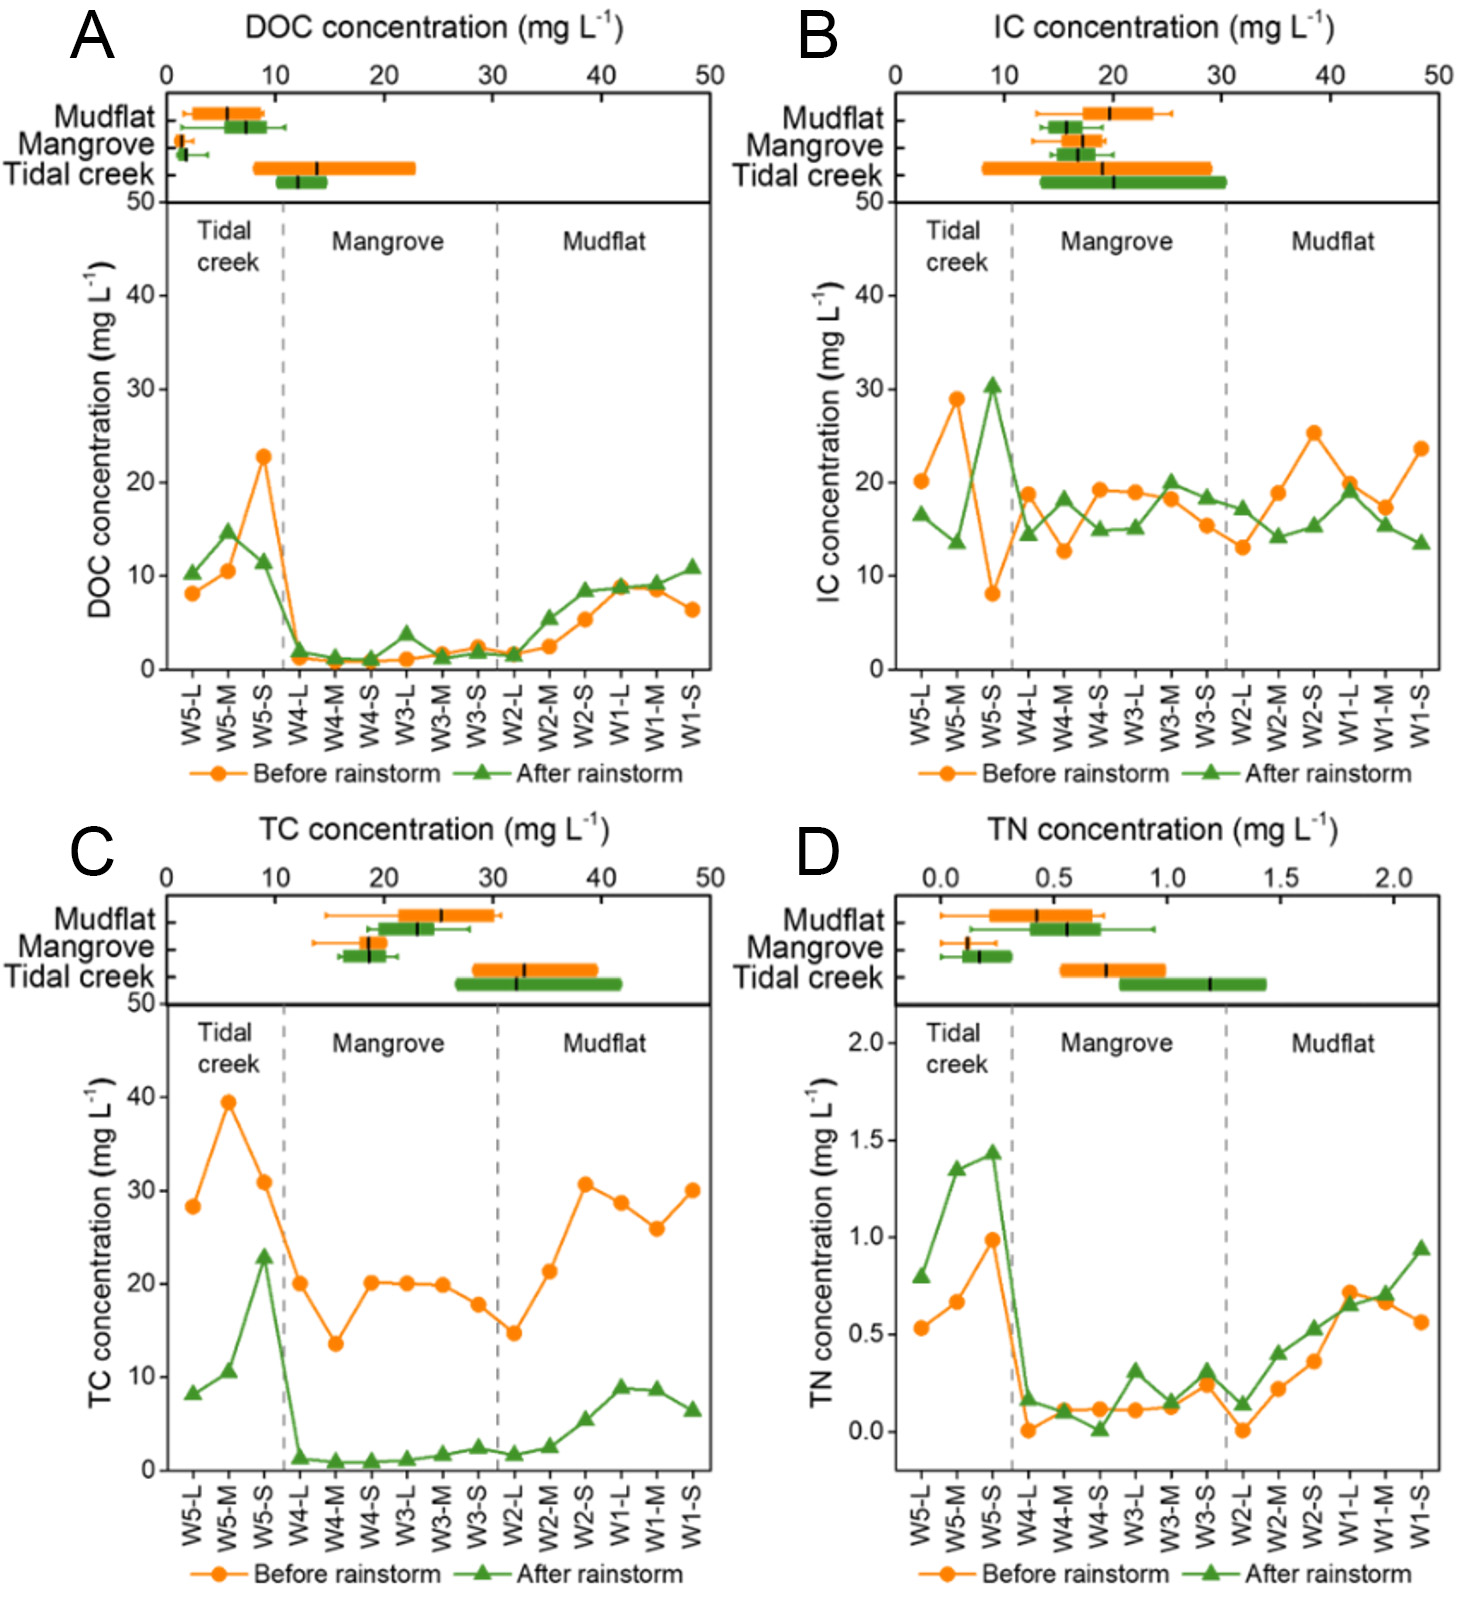
Figure 2. Spatial distribution of C and N concentrations, including (A) DOC, (B) DIC, (C) TC, and (D) TN. Each panel displays individual sample data (lower section) and habitat-grouped statistical analysis (upper section) for three habitats: mudflat, mangrove, and tidal creek.

Carbon Footprints
ISSN 2831-932X (Online)
Follow Us

Portico

All published articles are preserved here permanently

https://www.portico.org/publishers/oae/

Portico

All published articles are preserved here permanently

https://www.portico.org/publishers/oae/