


fig1
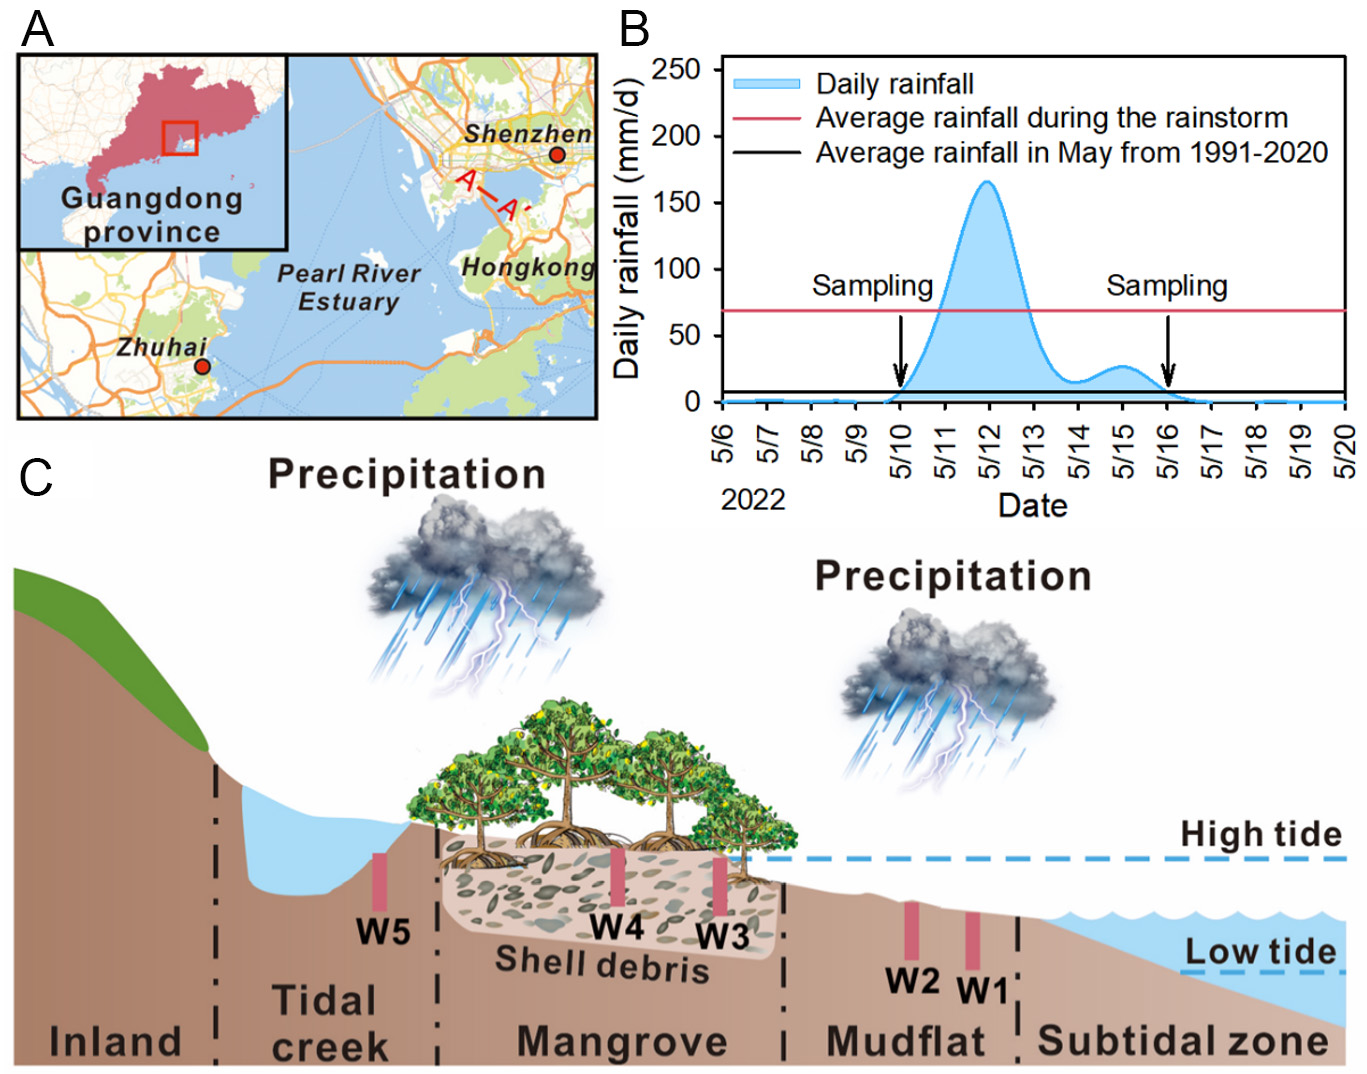
Figure 1. Map of the study area showing the relative position of the sampling site in (A) mainland China and Shenzhen Bay (SZB); (B) daily rainfall recorded during the rainstorm event; and (C) field sampling layout illustrating the spatial arrangement of five sampling locations by red bars (W1-W5: W1-W2 in mudflat, W3-W4 in mangrove, and W5 in tidal creek) along the mangrove intertidal zone.


