

College students’ willingness to pay for carbon-labelled drinks
 0
0 Abstract
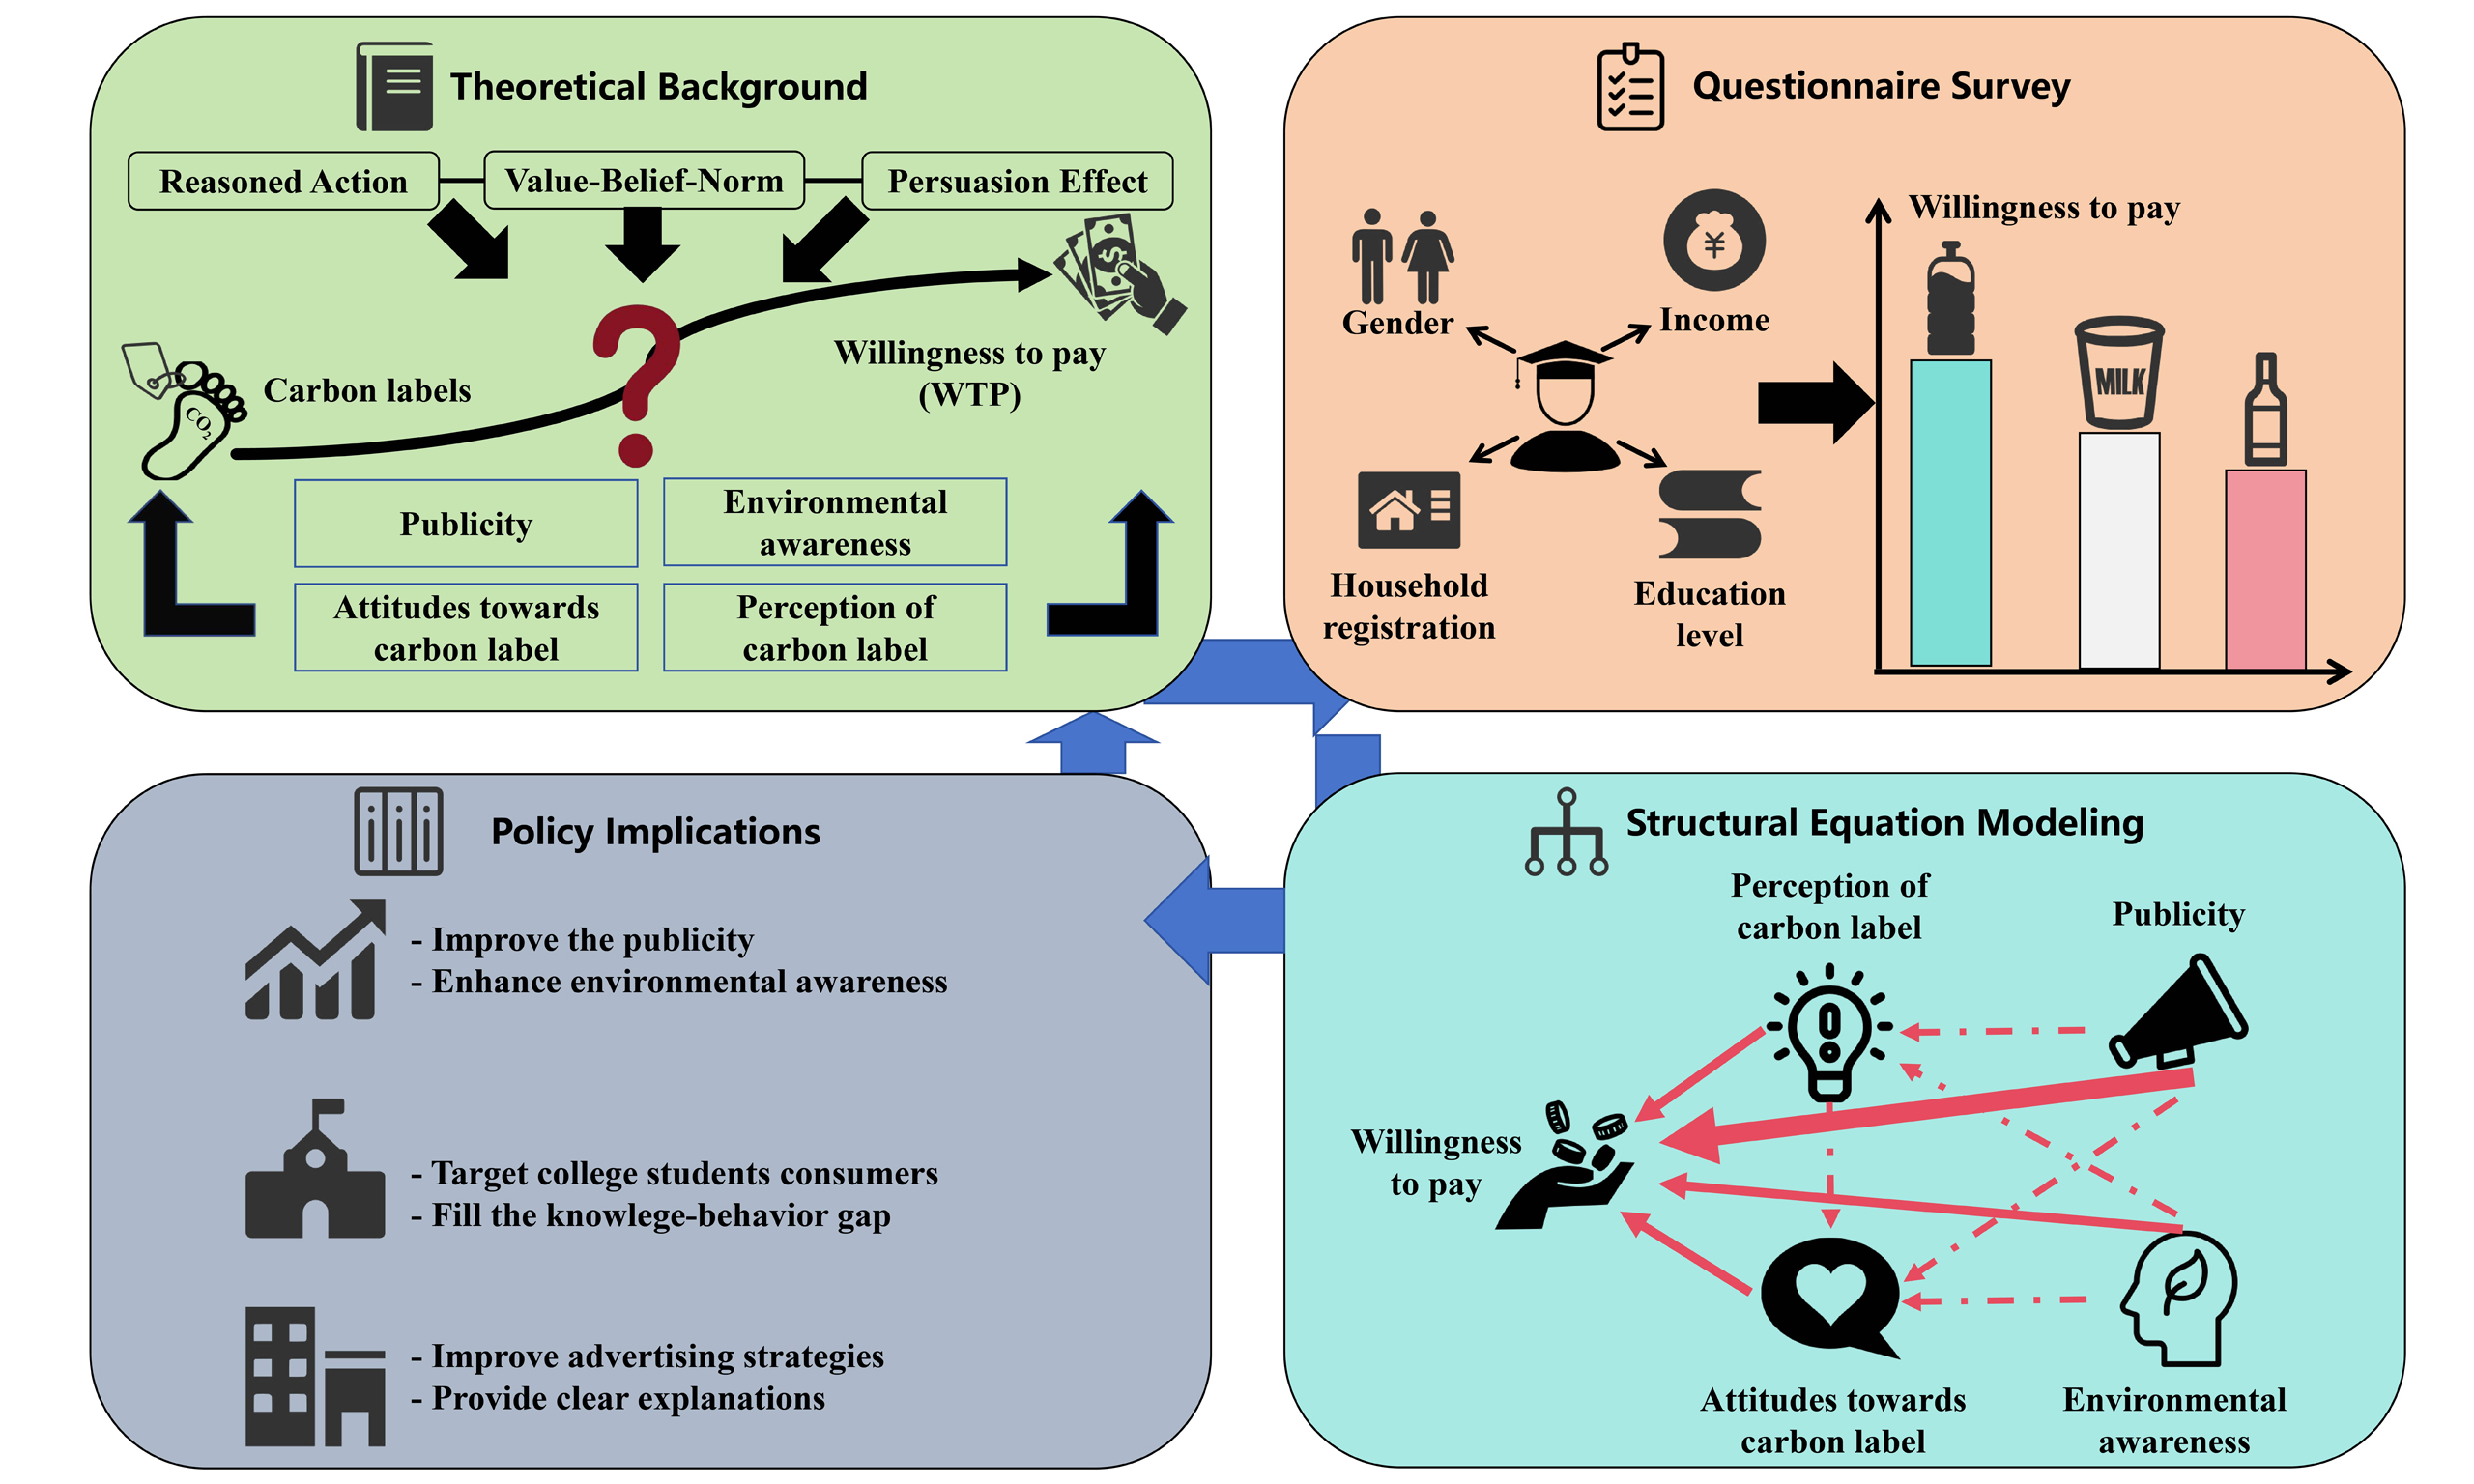
Carbon labels play an important role in guiding responsible consumption and production, yet consumers’ willingness to pay (WTP) for carbon-labelled products remains poorly understood in China. This study proposes a conceptual framework to measure the WTP for carbon-labelled drinks among Chinese college students. Using the contingent valuation method, we collect 1,787 questionnaires and find that college students are willing to pay a price premium of 17.5%, 13.5%, and 12.9% for carbon-labelled mineral water, milk, and wine, respectively. We show that environmental awareness, perception of carbon labels, attitudes towards carbon labels, and publicity positively influence consumers’ WTP in different pathways. Attitudes mediate the effects of environmental awareness and publicity on WTP, while perception influences WTP only indirectly via attitudes. These findings are expected to not only deepen the understanding of the mechanism behind WTP for carbon-labelled products, but also to provide valuable insights into the promotion of carbon labels in China and other emerging economies worldwide.
Keywords
INTRODUCTION
Human-induced carbon emissions have been a primary contributor to global warming in the past decades[1]. Reducing these anthropogenic emissions requires collective action from policymakers, manufacturers and consumers[2]. However, a lack of transparent information on carbon emissions poses a barrier to multi-stakeholder engagement. Accurate quantification of emissions associated with human activities is fundamental to effective carbon reduction collaboration. Carbon footprint has become the most suitable assessment tool for carbon emissions based on its precise indicators[3]. Life-cycle assessment and input - output analysis are usually used to quantify the carbon footprint of specific products[4]. A growing number of international carbon footprint product standards have been released in the past few years[5]. Meanwhile, carbon labels serve as a measure of the candle-to-grave or candle-to-gate carbon footprints for a given product[6]. Specifically, carbon labels quantify products’ carbon footprint to inform consumers in various forms and quantitative resolutions[7]. Such labelling is expected to not only potentially contribute to emissions reduction by influencing consumers’ practices but also prompt enterprises to produce low-carbon products, while supporting targeted policy interventions by governments[7].
Since starting in the United Kingdom in 2007, at least 31 carbon labels have been implemented in 43 countries and regions[7,8]. Some studies have revealed consumers’ choice of carbon emissions reduction when carbon labels are implemented. For example, a large-scale field experiment demonstrated that carbon labels can lead to a 4.3% emissions reduction per meal[9], and as the middle-income population increased, consuming beef with carbon labels can reduce carbon emissions by 27.1%[10]. However, the various forms of labelling and consumer interpretation have introduced confusing and contradictory messages into the marketplace that have undermined their acceptance by industry and the public[11]. A better understanding of the underlying mechanism can assist policymakers in improving consumer guidance towards a low-carbon transition.
As the largest carbon emitter in the world[12], China has committed to reaching peak carbon emissions by 2030 and becoming carbon neutral by 2060 at the latest. As the current energy structure comprises the efforts to reduce production-side emissions[13-15], emissions reduction employing consumption-side measures such as carbon labels has a significant influence on advancing China’s climate action[16,17]. Despite growing evidence that consumers tend to purchase low-carbon products[18-20], carbon labelling practices in China are still evolving[21]. Initiated in the electrical and electronic industry in 2018, related pilots have gradually expanded to several sectors spanning high-emissions industries (e.g., cement and steel),
As the ultimate purchasers of carbon-labelled products[26], the willingness to pay (WTP) of retail consumers for carbon-labelled products will not only affect companies’ willingness to apply carbon labels to their products[27] but also fundamental approaches to carbon labelling systems[28]. The majority of studies have demonstrated that consumers are willing to pay a premium for carbon-labelled products; however, consumers with different demographic characteristics exhibit varying degrees of WTP for different types of products[29-31]. Previous research has increasingly focused on college students rather than other demographic groups[32,33]. A major reason is that college students are more likely to engage in low-carbon consumption than other consumers because of their high education levels that shape attitudes towards environmentalism[34]. College students are a rising demographic of carbon-labelled product consumers that can determine the long-term, consumption-based emissions trajectories of our society[32]. However, limited research has focused on quantifying college students’ WTP for carbon-labelled products, particularly in China. Although some studies have explored the influencing factors of college students’ low-carbon consumption practices[32,33,35], a conceptual framework for examining the influence mechanisms specifically focusing on consumers’ WTP for carbon-labelled products has not yet been developed. Therefore, further in-depth research on the influence mechanism of carbon labels is required.
To fill this gap, this study investigates Chinese college consumers’ WTP for carbon-labelled products using the contingent valuation method (CVM) and explores its influence mechanisms based on this conceptual framework. We choose carbon-labelled drinks for the survey, as drinks are closely related to household consumption and have enormous potential to reduce carbon emissions[36-38]. By doing so, this study makes four novel contributions to the literature. First, this study establishes a conceptual framework that reveals the influence mechanisms underlying WTP for carbon-labelled products. Second, we quantify Chinese college students’ WTP for different carbon-labelled drinks for the first time. Third, the results are presented to inform future studies that seek a deeper understanding of students’ WTP for carbon-labelled products and assist policymakers in developing and implementing carbon labelling systems in China and other nations worldwide. Finally, implementing carbon labelling systems enables a systematic and precise accounting of carbon footprints.
METHODS
Hypotheses development
We focus on WTP - a discourse in the field of consumer behaviour based on Value-Belief-Norm theory[39], Persuasion theory[40] and the theory of Reasoned Action[41]. By tracing the influencing factors of WTP through the lens of these theories, this study uses environmental awareness (EA), publicity (PC), perception of carbon labels (PCL), and attitudes towards carbon labels (ACL) as the hypothetical indicators.
EA
The term “EA” indicates individuals’ environmental literacy and was first proposed by Roth[42]. Ecological Attitudes and Knowledge[43], New Environmental Paradigm[44] and the Environmental Awareness[45] scales are currently the most influential indicator systems for measuring EA, where environmental attitudes, values and knowledge are the three major modules of EA measurement. Improving consumers’ EA can facilitate low-carbon consumption[46], and has been confirmed to exert a positive impact on consumers’ WTP for low-carbon products or on their overall purchasing behaviours in many countries[47,48]. Based on the above discussion, we propose the following hypothesis:
H1. College students’ WTP for low-carbon-labelled products is positively influenced by EA.
Publicity
Previous studies have demonstrated that PC increases consumers’ WTP for low-carbon products. Kumar and Raju[49] examined the impact of advertising on consumer purchasing behaviour, determining that publicity advertising is likely to increase the consumption of specific products. Foxall et al.[40] found that PC can provide more persuasive information to promote low-carbon purchasing practices, and Maichum et al.[50] produced similar research results. Wong et al.[51] conducted a survey of more than 1,000 consumers in Hong Kong, concluding that if large-scale green publicity is enacted, consumers will be more likely to exhibit WTP for low-carbon products. Edenbrandt et al.[52] revealed that regardless of whether consumers avoid carbon information about food, the information imposed upon them will affect their choice of
H2. College students’ WTP for low-carbon-labelled products is positively influenced by PC.
Perception of carbon labels
A number of studies have demonstrated that carbon labels’ features may have a positive impact on consumers’ purchasing decisions[30,54]; for example, Kasterine et al.[55] determined that PCL largely affects how consumers react to carbon labels. Consumer PCL includes two factors: carbon label knowledge and understanding of the information conveyed[56-58]. Based on this, if consumers do not possess a clear PCL, their WTP in regard to carbon-labelled products will also decline[28,29,31]. Thus, the following research hypothesis is proposed:
H3. College students’ WTP for low-carbon-labelled products is positively influenced by PCL.
Previous studies have also demonstrated that consumers with higher EA pay more attention to environmental information, improving their PCL and affecting their WTP[28]. Additionally, PC can effectively enhance consumer PCL[58]. Based on this, such consumers are more inclined towards low-carbon consumption practices[57]. Therefore, to further verify the mediating role of PCL, we propose the following hypotheses:
H4. PCL has a mediating role between EA and WTP.
H5. PCL has a mediating role between PC and WTP.
Attitudes towards carbon labels
Attitudes have been a significant aspect of research on consumer behaviour[59]. In the theory of reasoned action, Ajzen and Fishbein[41] indicated that attitude is the collection of individuals’ primary beliefs in terms of behavioural results and the perceived significance of these results. Miller et al.[60] argued that attitudes are the collection of individual beliefs regarding specific behaviours and the evaluation of these beliefs. In summary, this study assumes that ACL is based on the collection of consumers’ beliefs, emotions and behavioural intentions towards carbon-labelled products. In contrast to PCL, ACL places more emphasis on the subjective level. ACL has a strong influence on consumer practices[61,62]. Based on this, we propose the following research hypothesis:
H6. College students’ WTP for low-carbon-labelled products is positively influenced by ACL.
Regarding the concurrent process of increased WTP, research has demonstrated that one of the most significant factors influencing consumer low-carbon consumption behaviour is consumer attitudes, and changes in these attitudes stem from increased environmental protection knowledge[63]. The Value-Belief-Norm theory contends that consumer ecological values will affect individuals’ environmental beliefs and individual behaviours[39], which are also a manifestation of attitudes. In the process of PC increasing WTP, the more publicity consumers receive, the more interested they will be in carbon-labelled products. Consequently, this interest will eventually become an actual buying practice[64]. Persuasion theory also supports this point, referring to a phenomenon in which consumer attitudes affect their decision-making when introduced to persuasive information[40]. PC is considered to be a form of effective persuasive information; therefore, to further examine the mediating influence of ACL, we propose the following hypotheses:
H7. ACL has a mediating role between EA and WTP.
H8. ACL has a mediating role between PC and WTP.
Additionally, the relationship between the PCL and ACL has attracted scholars’ attention in recent years. Research has demonstrated that as consumers gain a better understanding of products, their ACL becomes more positive[65]. Therefore, this potentially supports the chain-mediating role between the PCL and ACL. Accordingly, this study proposes the following hypotheses:
H9. PCL and ACL have a chain mediation role in the process of EA increasing WTP.
H10. PCL and ACL have a chain mediation role in the process of PC increasing WTP.
We construct a conceptual framework based on all the hypotheses outlined above [Figure 1], where the solid line represents causality, and the dotted line represents indirect effects. This model can answer the following questions: (i) Which factors have a positive influence on college students’ WTP for low-carbon-labelled products? (ii) Do college students’ ACL and PCL on carbon labels have a mediating effect between EA and WTP? (iii) Do college students’ ACL and PCL regarding carbon labels have a mediating role between PC and WTP?
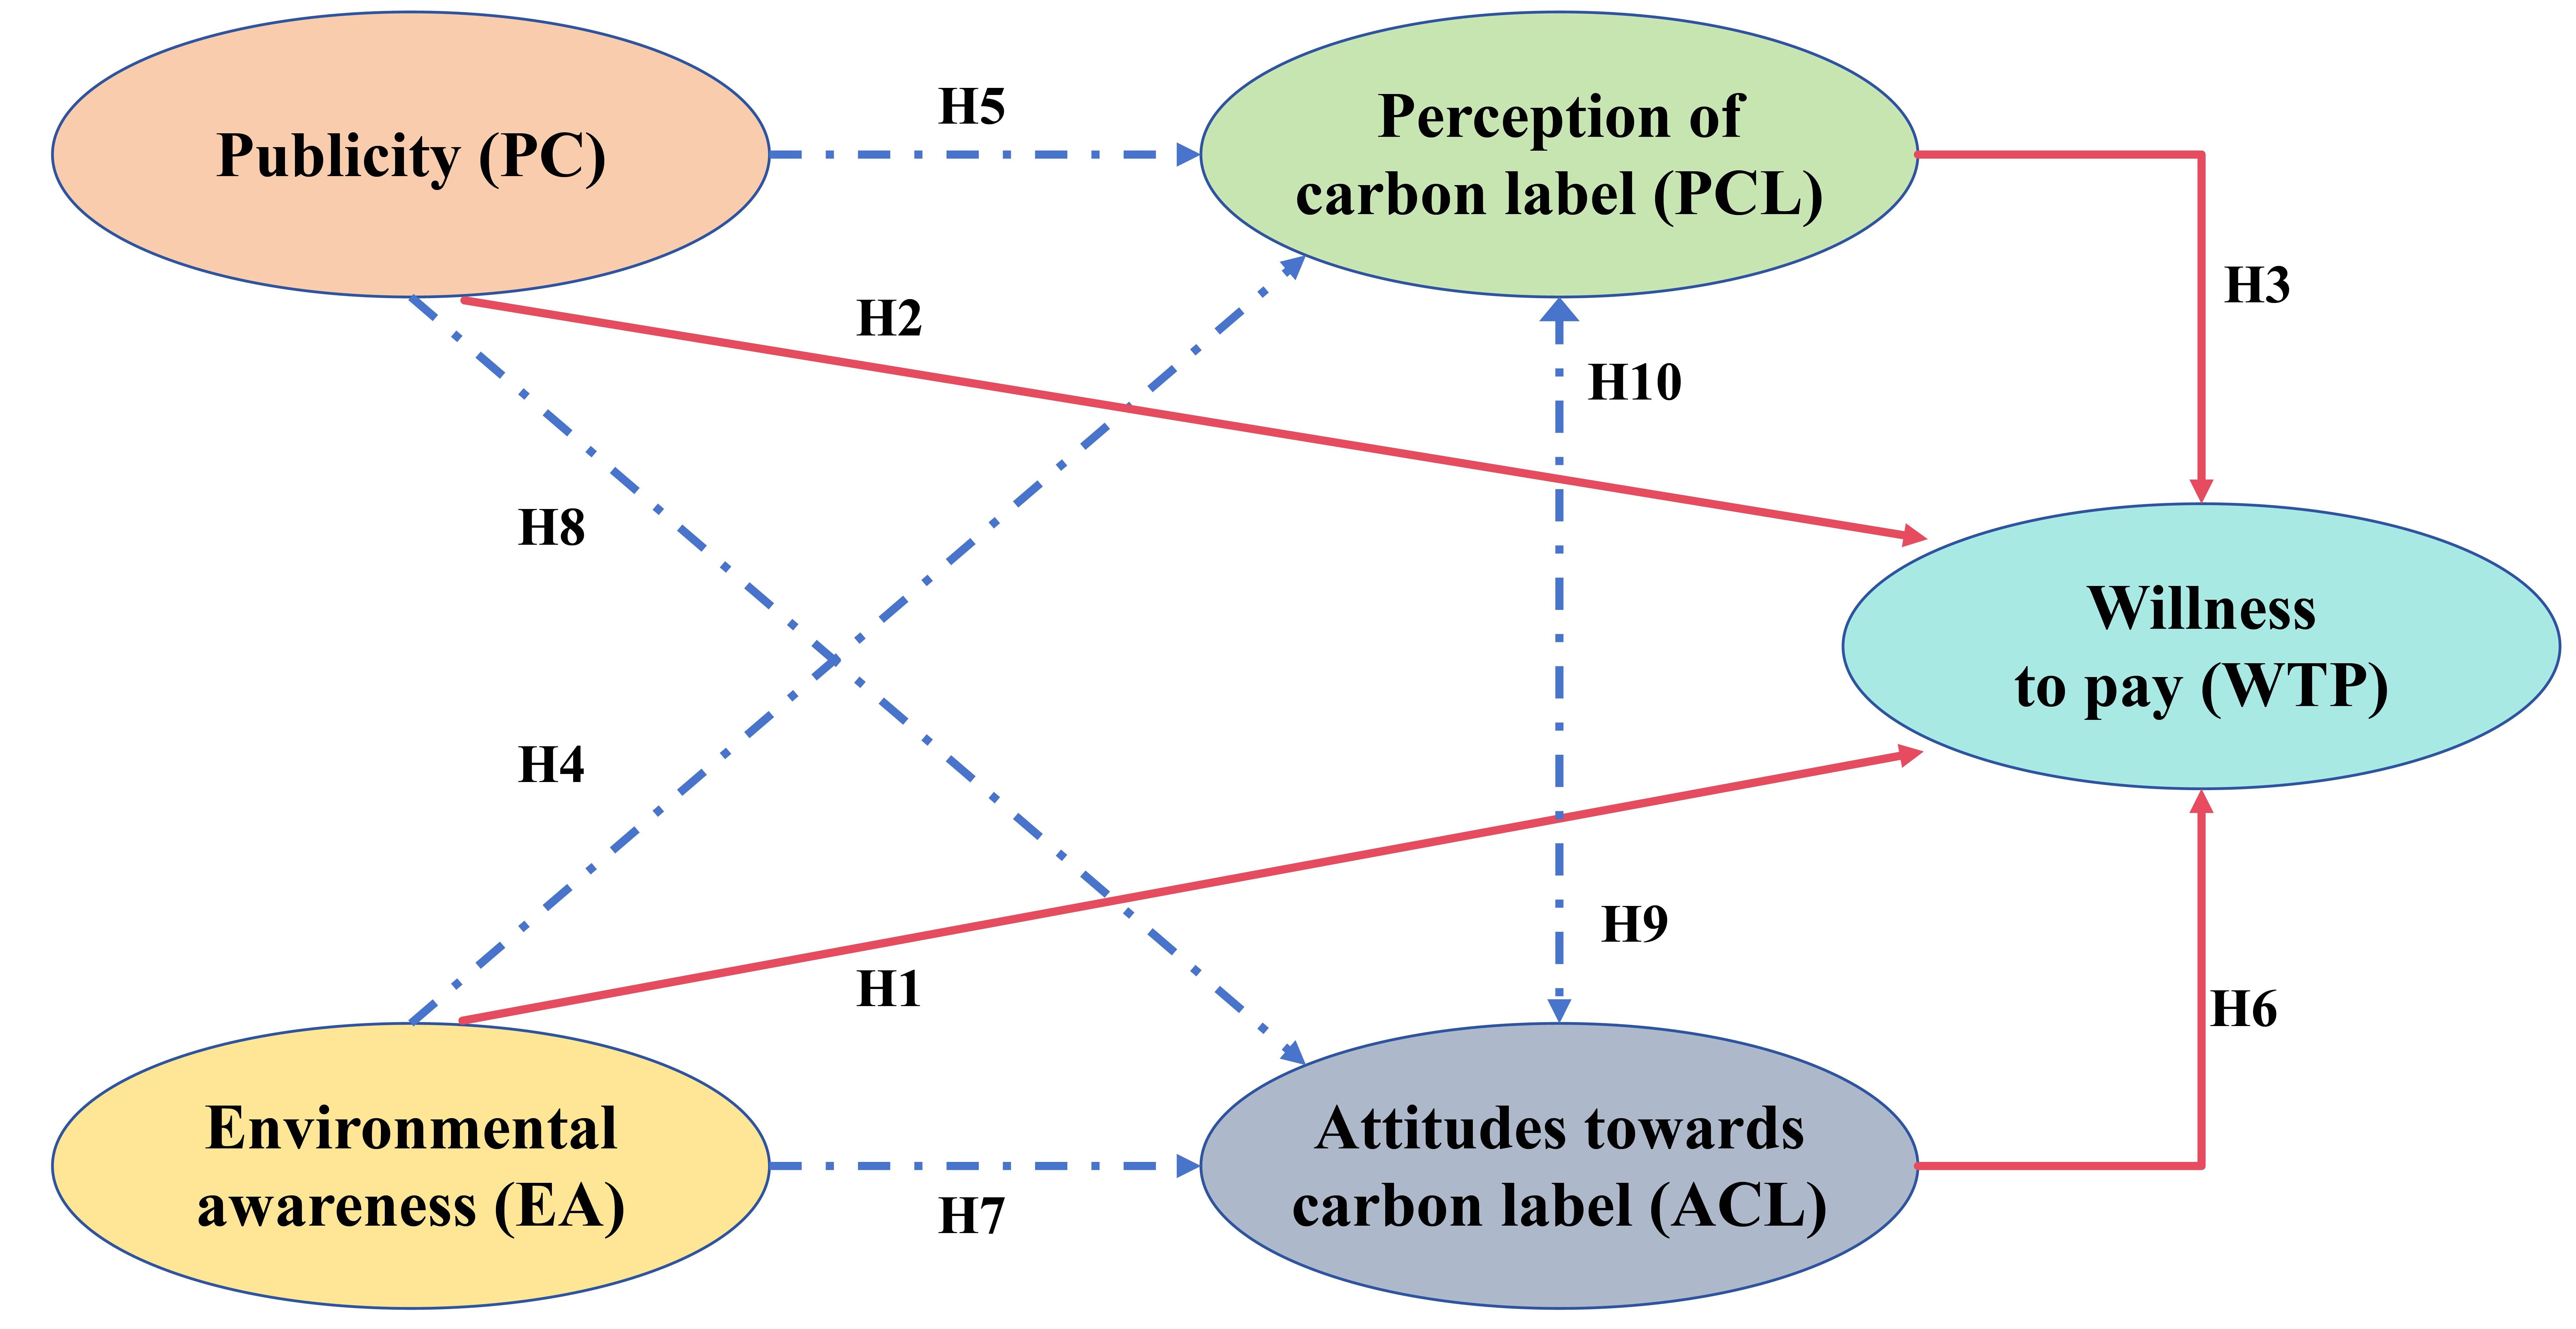
Figure 1. Conceptual framework of the influence mechanism underlying the WTP for carbon-labelled drinks. Created with Microsoft PowerPoint.
Survey design
CVM and deviation corrections
As a typical stated preference evaluation method, CVM can directly investigate individuals’ WTP for environmental or resource protection measures in a hypothetical market[66]. It is generally used to quantify WTP in various scenarios[67].
The key to the CVM method is to obtain respondents’ WTP using different types of queries[68,69]. This study adopts payment card guiding technology to establish the questions contained in the questionnaire that required respondents to choose the maximum WTP from a series of given value intervals. This approach can address the unfamiliar problems that respondents face and avoid over-or under-evaluation, and makes the calculations easier compared with calculations derived from single/double-bounded dichotomous guiding technology, improving the overall effective response rate.
Additionally, we employ several methods to reduce the deviation in CVM observed in the survey process. The possible CVM deviation types and corresponding reducing methods are presented in Table 1.
Deviation types and reducing methods
| Deviation types | Descriptions | Deviation-reducing methods |
| Hypothesis deviation | The deviation comes from the difference between the answers to the hypothetical market questions and the real market response | 1. The illustrated questionnaire is designed on the basis of the pre-survey 2. The questionnaire survey is anonymous 3. Each respondent is paid for participating in the questionnaire survey |
| Starting-point deviation | The deviation comes from the misinterpretation by respondents of the starting price as an appropriate range of the WTP | 1. The starting prices of the drinks are set through market research 2. The payment card method is adopted, and the numerical range of WTP options is adjusted through a pre-survey |
| Protest response deviation | The deviation comes from the protest of respondents against hypothetical market and payment method | The contents of the questionnaire include the question of the reason for refusal to pay to identify the reason for zero response |
| Part-whole deviation | The deviation arises from respondents’ inability to distinguish the overall environment from its individual components | In the design of the questionnaire, this survey reminds respondents to pay attention to the income and expenditure limits of such products to reduce such deviations |
| Length of stay deviation | The deviation comes from the uncomfortable feeling of the long or short survey period | During the questionnaire distribution process, this survey sets a time limit on the page stay, the shortest of which should not be shorter than 2 min, and the longest should not be longer than 10 min; otherwise, the questionnaire will be deemed invalid |
Questionnaire design and data statistics
The study employs a questionnaire survey to collect data and test all the hypotheses outlined above. Prior to the formal survey, a pre-survey was conducted with 50 college students to improve the questionnaire items and enhance measurement accuracy. After collecting the responses and assessing any doubts regarding the questionnaire items of the survey, the questionnaire was appropriately modified.
The final questionnaire primarily consists of three sections that include (i) a survey of demographic characteristics, covering gender, educational background, income and household registration and (ii) a survey of consumers’ WTP for carbon-labelled drinks. Respondents are asked if they are willing to pay a price premium for carbon-labelled drinks and the level of price premium they are willing to pay. Unlike different groups’ WTP in previous studies, college students are our main respondents. Therefore, based on previous field visits to supermarkets and a basic understanding of college students’ daily habits, we select mineral water and milk - two commonly consumed drinks - along with wine, which has a slightly higher price, to create a price gradient. Five options were established through the pre-survey and include 5%, 10%, 20%, 30% and 50% price premiums, all of which are based on the average market price. The questionnaire also includes a refusal to pay option and specifically asks about the reason for this option. Finally, the questionnaire includes (iii) a survey of influencing factors scales. The operationalisation of all scales is measured using a five-point Likert scale (from 1 = highly unlikely to 5 = highly likely or from 1 = strongly disagree to 5 = strongly agree). This is a tool appropriate for capturing respondents’ degree of subjective willingness[70].
The survey was conducted using an online questionnaire platform called Questionnaire Star[71], which is a reliable and professional platform in China. The questionnaire was sent to different populations via social media channels such as WeChat[72] to ensure respondents’ wide geographic and demographic representation. A small appreciation fee was provided to respondents as an incentive to increase participation and data quality. To further guarantee that our respondents were consumers and college students, we added the question “Are you a college student?” (including graduate students) to screen out irrelevant participants.
We employ a common rule to determine the sample size required for our structural equation model (SEM). It is recommended that the sample size should maintain an appropriate ratio relative to free parameters to ensure reliable estimates, model fit and statistical power. Ideally, the ratio should be 20:1, with a minimum of 10:1[73]. This study includes 76 free parameters to be estimated, indicating that a sample size of 1,520 would be ideal for optimal model estimation. Therefore, 1,878 questionnaires were collected, 1,787 of which were valid, indicating an effective response rate of 95.2%. Table 2 presents the descriptive statistics.
Sample description
| Demographic characteristic | Number of people | Proportion (%) | Mean | |
| Gender | Male = 1 | 810 | 45.3 | 1.55 |
| Female = 2 | 977 | 54.7 | ||
| Education level | College diploma student = 1 | 293 | 16.4 | 2.12 |
| Undergraduate student = 2 | 1,086 | 60.8 | ||
| Postgraduate student = 3 | 305 | 17.1 | ||
| Doctoral student = 4 | 103 | 5.6 | ||
| Household registration | Urban areas = 1 | 1,161 | 65.0 | 1.35 |
| Rural areas = 2 | 626 | 35.0 | ||
| Annual household income | < 50,000 CNY = 1 | 347 | 19.4 | 2.57 |
| 50,000-150,000 CNY = 2 | 622 | 34.8 | ||
| 150,000-300,000 CNY = 3 | 454 | 25.4 | ||
| 300,000-500,000 CNY = 4 | 229 | 12.8 | ||
| 500,000-1,000,000 CNY = 5 | 84 | 4.7 | ||
| > 1,000,000 CNY = 6 | 51 | 2.9 | ||
With 45.3% male and 54.7% female respondents, the sample’s gender composition is consistent with that of the general college student population[74]. The majority of the respondents were undergraduate students, making up 60.8%. As the proportion of urban and rural population in China is 64% and 36%, respectively[75], our sample also appropriately represents the actual urban-rural structure. Furthermore, the distribution of annual household income exhibits an olive-like shape[76]. Figure 2 indicates that the respondents cover almost all Chinese provinces. Most were located in eastern China, followed by southern and northern China. This ensures a wide geographic representation of the respondents.
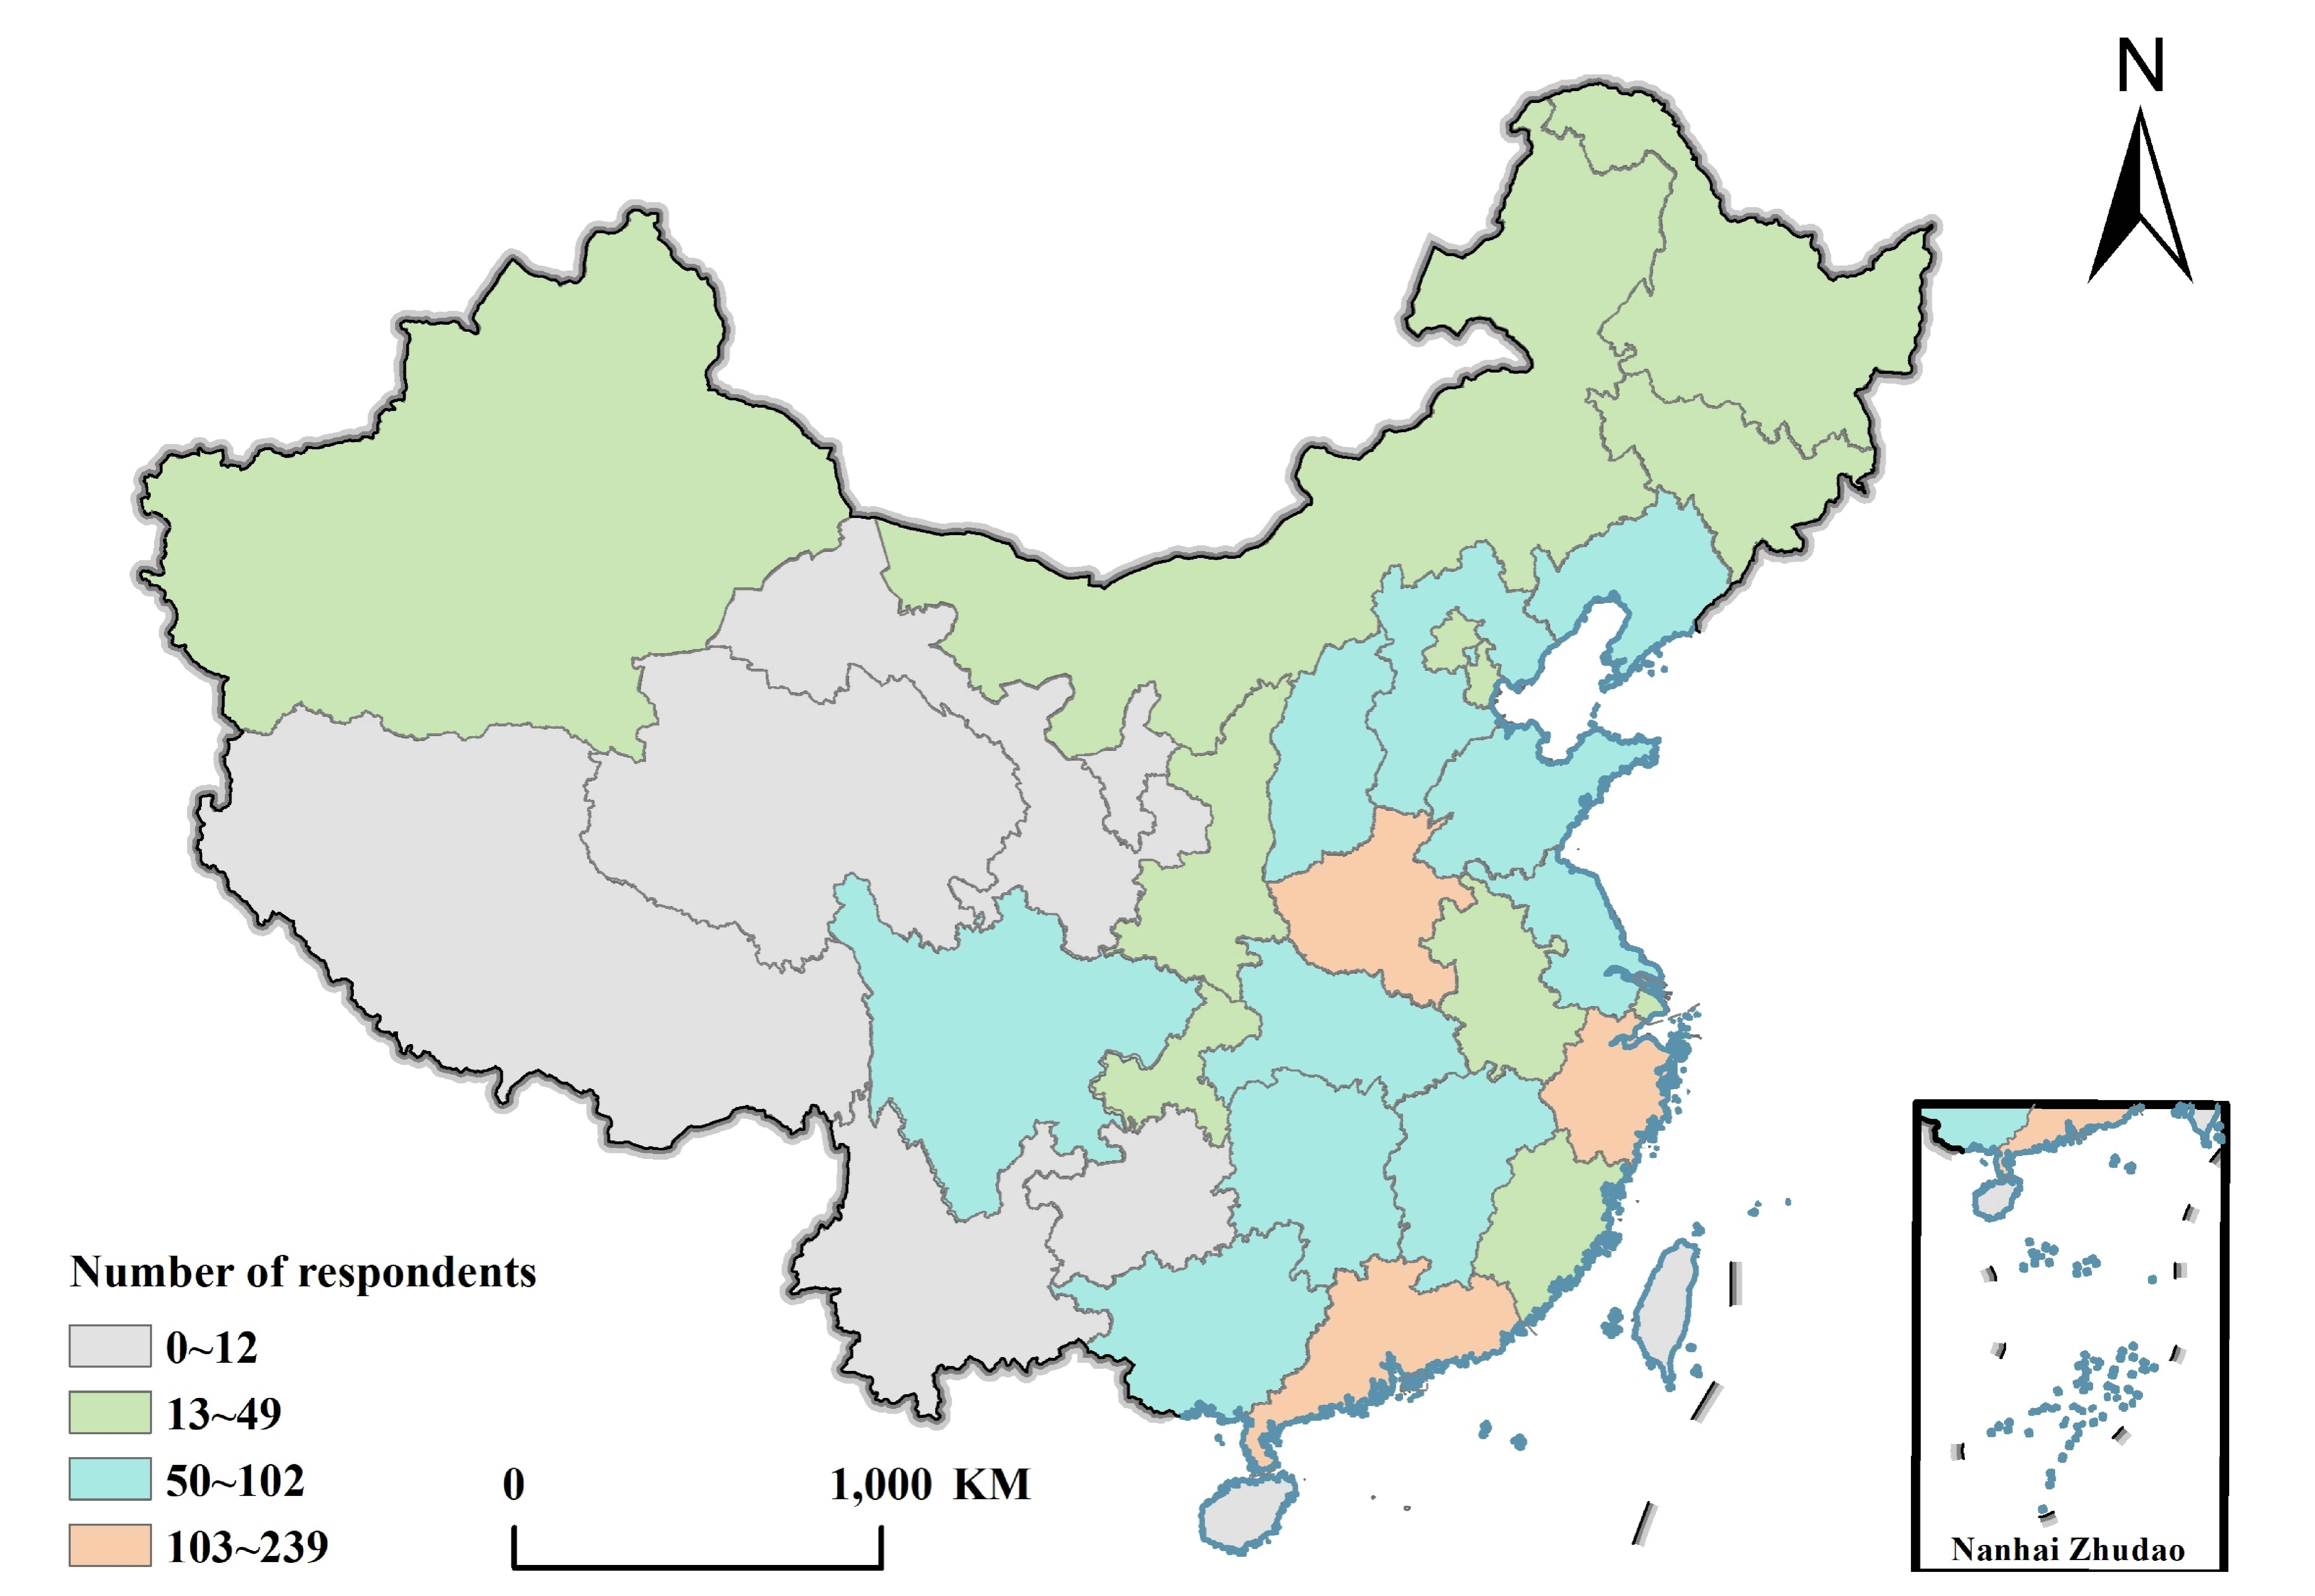
Figure 2. Geographical distribution of respondents. Created with ArcGIS. The basemap is from the China National Platform for Common GeoSpatial Information Services (https://www.tianditu.gov.cn/).
Data analysis
WTP estimation
The non-parametric Turnbull method has been widely used in previous studies to estimate mean WTP[77,78] due to its ability to make minimal assumptions regarding WTP distribution and to estimate the mean and median WTP as lower bound estimates[79]. Therefore, we adopt this method to estimate consumers’ WTP, and the mathematical average of payment intention can be obtained as the expected value of the discrete variable:
Multi-group analysis of variance
We use analysis of variance (ANOVA) to examine the significance of the mean difference between two or more samples. The basic principle of ANOVA is that the mean difference of different treatment groups is due to the experimental conditions and random error, where experimental conditions can generate differences between groups and random errors can lead to differences within groups[80]. ANOVA has been increasingly used to quantify the differences between groups with specific demographic characteristics[81,82]. Demographic characteristics encompassing gender, age, income, household registration, occupation, education, marital status and other objective factors can comprehensively reflect individuals’
Structural equation modelling
As a multivariate statistical method, SEM integrates factor analysis and path analysis and incorporates observational and latent variables into the same model for processing and analysis, which can address the traditional problems in processing latent variables[83]. Therefore, SEM has been widely used in previous studies to verify proposed theoretical frameworks[84,85]. It comprises measurement and structural models, which clarify the relationships between observed and latent variables and allow identification of causal relationships among latent variables.
Therefore, we employ SEM to conduct empirical tests on the proposed hypotheses using Mplus 8.7. We test the path relationships between EA, PC, ACL, PCL and WTP using the structural model. As the questionnaire data contain non-normal ordinal categorical variables, we use the weighted least squares with mean and variance to estimate the parameters[86].
RESULTS
College students’ mean WTP
College students’ extra mean WTP values for different types of carbon-labelled drinks are presented in Table 3, revealing that college students who are willing to pay for carbon-labelled mineral water, milk and wine accounted for 87.1%, 84.5% and 82.1%, respectively, with all values exceeding 80%. This proportion is even higher than that of the consumers in Chengdu, China, who were willing to buy carbon-labelled milk at a 70.9% rate[8]. This reflects the consumption characteristics of college students, indicating that young people are more inclined to engage in eco-friendly practices[87].
Descriptive statistical analysis of extra WTP variables
| Premium amount (CNY) | Mineral water | Milk | Wine | |||
| Number of people | Proportion (%) | Number of people | Proportion (%) | Number of people | Proportion (%) | |
| 5% | 381 | 21.3 | 426 | 23.8 | 458 | 25.6 |
| 10% | 412 | 23.1 | 439 | 24.6 | 430 | 24.1 |
| 20% | 330 | 18.5 | 347 | 19.4 | 328 | 18.4 |
| 30% | 148 | 8.3 | 164 | 9.2 | 130 | 7.3 |
| 50% | 285 | 15.9 | 134 | 7.5 | 120 | 6.7 |
| Sum | 1,556 | 87.1 | 1,510 | 84.5 | 1,466 | 82.1 |
The extra WTP of college students for carbon-labelled mineral water is 0.35 CNY (Chinese Yuan), indicating an extra 17.5%. The extra WTP for carbon-labelled milk and wine is 0.47 CNY and
Furthermore, the reasons for refusing to pay for carbon-labelled drinks indicate that price is a major concern when college consumers choose to pay for carbon-label products [Figure 3]. Therefore, if the cost of a given product rises due to low-carbon practices, it is questionable whether the price premium of these carbon-labelled products should be borne by consumers alone. In addition, 33% of respondents refused to pay due to doubts regarding the validity of carbon-labelled products. Similarly, 14% of consumers attributed their refusal to pay to a misunderstanding regarding the content of carbon labels. Therefore, it is apparent that the key to improving consumers’ WTP is to empower more consumers to understand the connotations of carbon labels and the information that these labels convey. Additionally, 9% and 7% of consumers indicated that the task of environmental protection is the responsibility of the government, and this is a typical manifestation of low EA. Nevertheless, the proportion of such groups was extremely small.
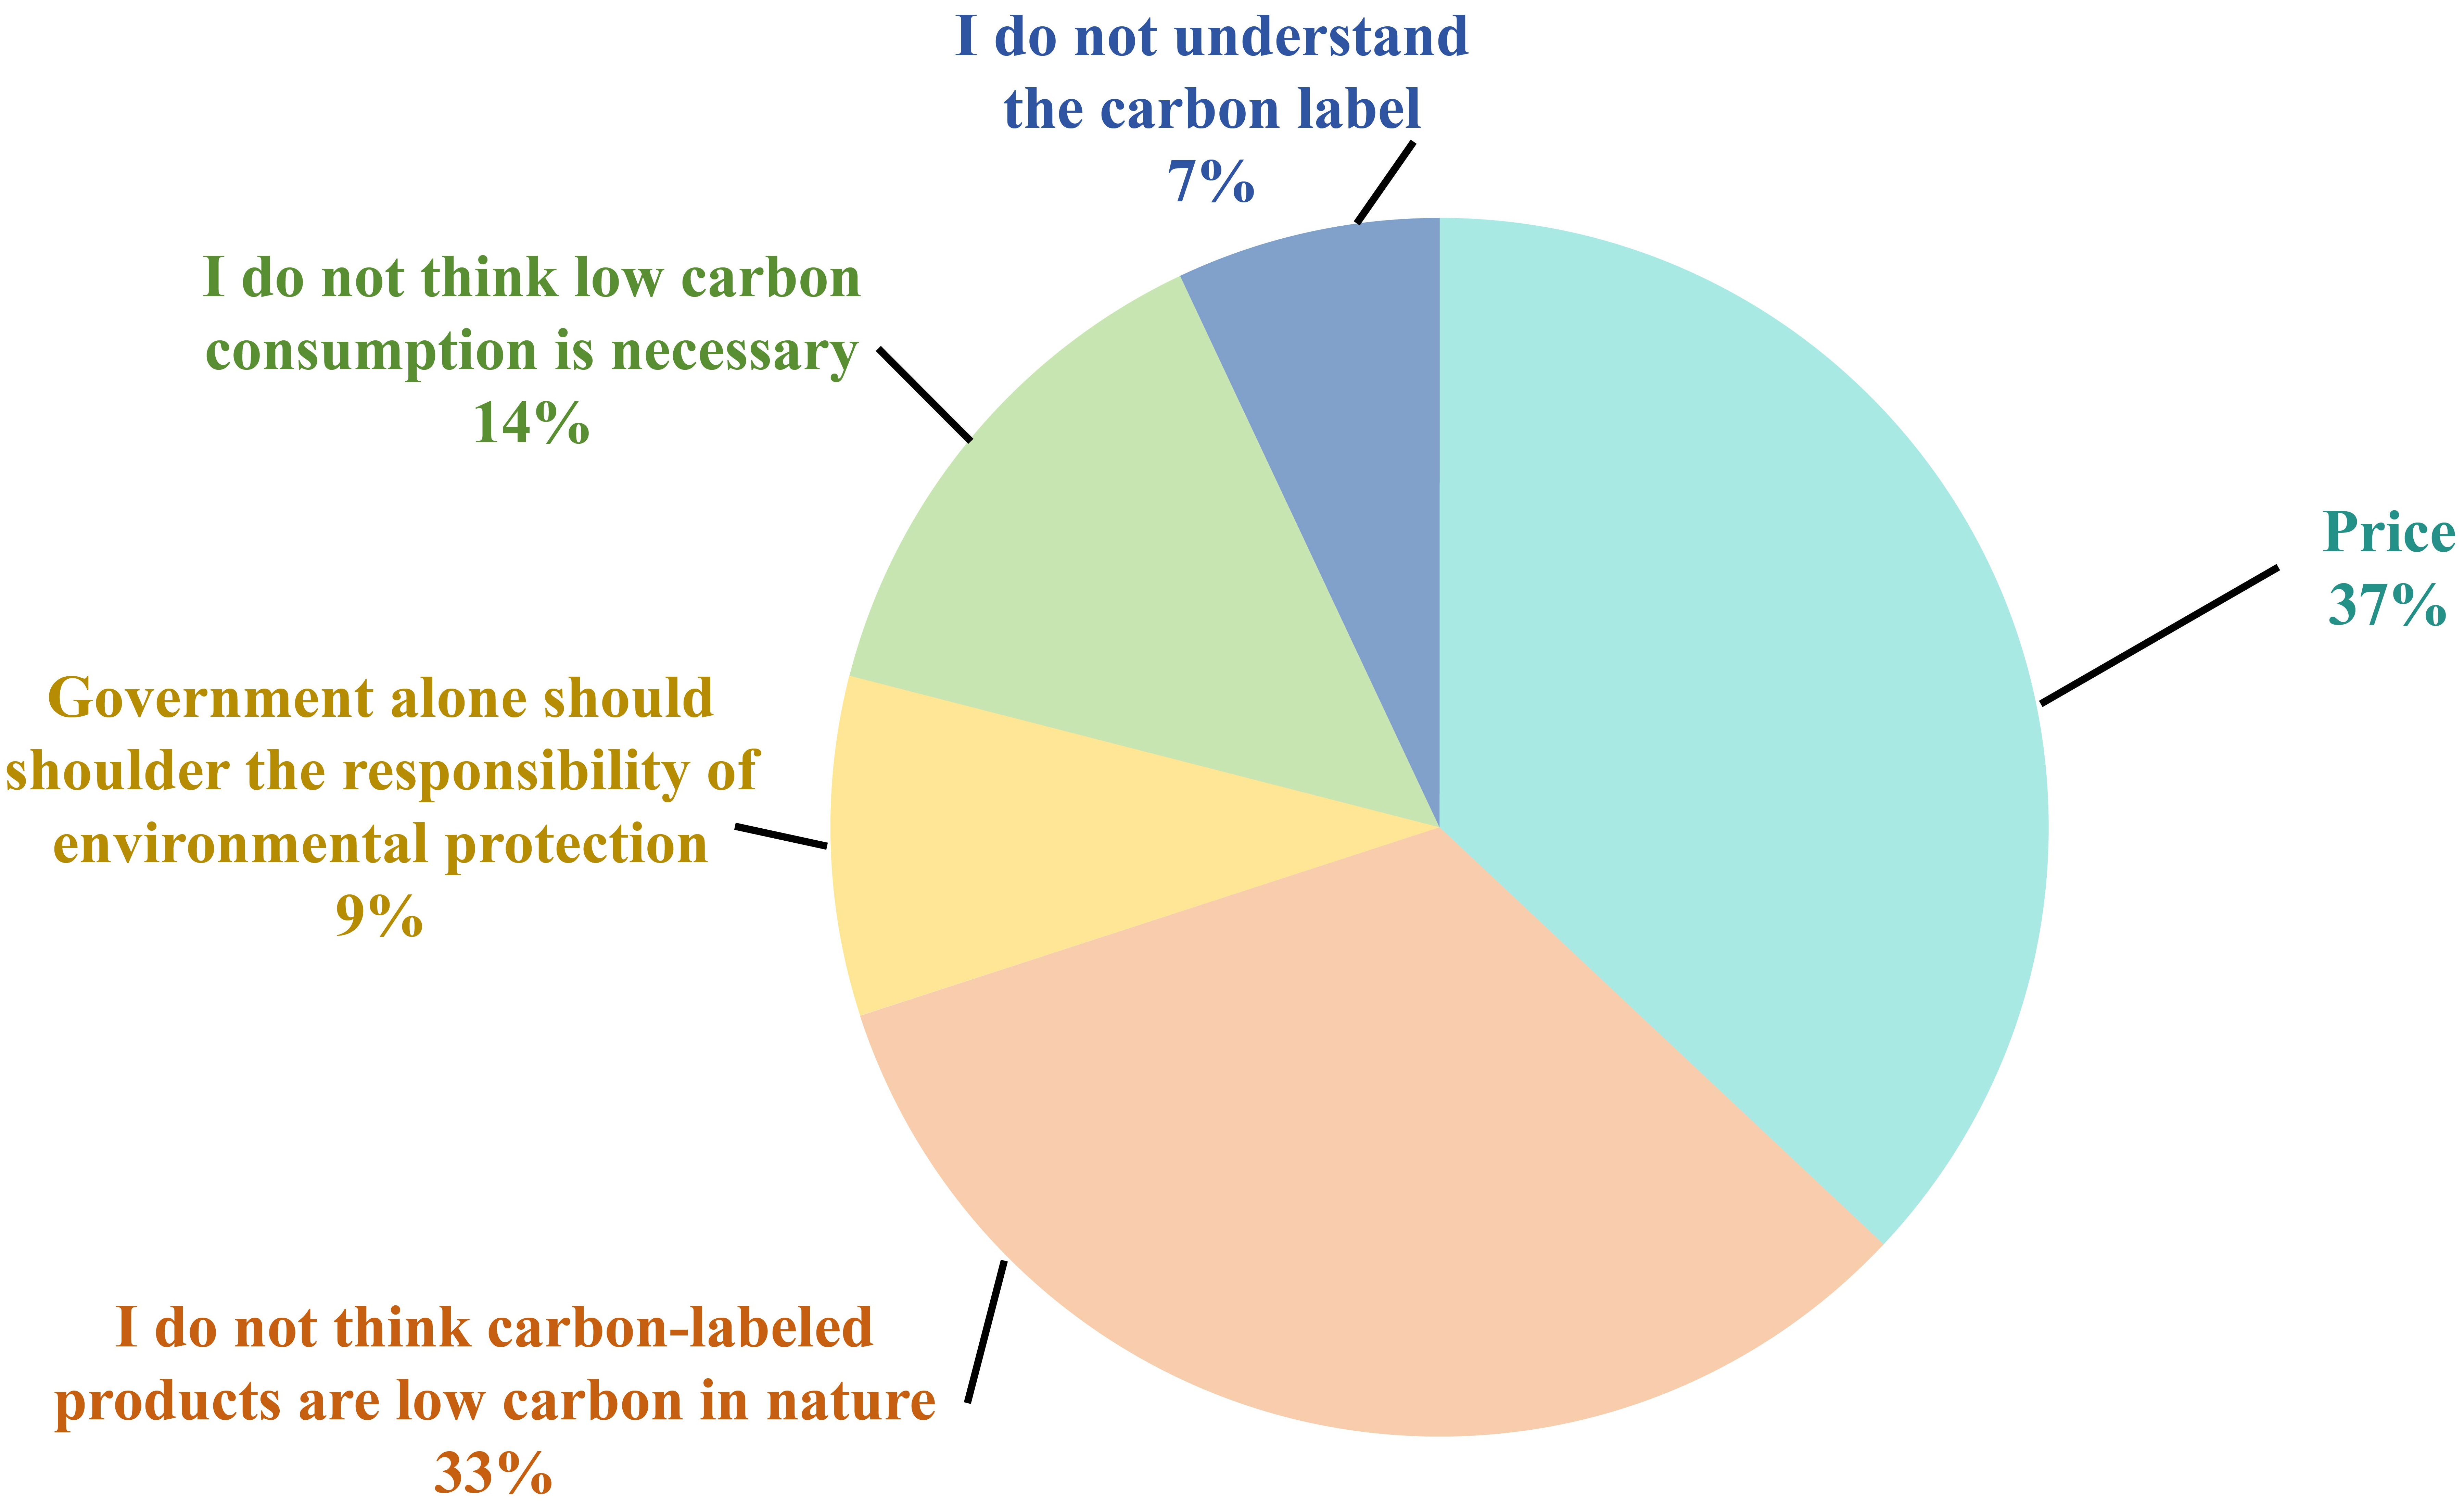
Figure 3. Reasons for refusing to pay for carbon-labelled drinks of respondents. Created with Microsoft PowerPoint.
Differing WTP across multiple groups
Using Statistical Product and Service Solutions (SPSS) 22.0, we perform ANOVA tests to evaluate the impact of demographic variables such as gender, education, household registration and income on college students’ extra WTP for carbon-labelled drinks. The test results are presented in Table 4.
Variance test results for demographic characteristics
| WTP for different drinks | F-value | |||
| Gender | Education level | Household registration | Income | |
| WTP for mineral water | 0.032 | 0.74 | 16.631*** | 10.89*** |
| WTP for milk | 1.021 | 1.356 | 21.126*** | 12.42*** |
| WTP for wine | 4.445** | 2.285 | 8.267*** | 9.966*** |
While gender does not appear to have a significant impact on the WTP for carbon-labelled mineral water and milk, it significantly affects the WTP for carbon-labelled wine. Specifically, the WTP for carbon-labelled wine is higher for males than it is for females, which may be attributable to the characteristics of the wine products[91]. Previous research has indicated that consumers with greater knowledge about wine are more likely to pay a premium for eco-labelled wine products[92,93]. Given that males are major consumers of alcoholic drinks in China, male college students are expected to have a higher WTP for wine products than females. Surprisingly, the impact of education on the WTP for carbon-labelled drinks is insignificant, which is consistent with the research of Lea and Worsley[94]. Notably, our results conflict with those from some other previous studies[95-97], indicating that high academic qualifications can lead to high WTP. This could be explained by our research sample exclusively including college students with college diplomas or above. Furthermore, household registration has an influence on college students’ WTP for carbon-labelled drinks, and extra WTP for those with urban household registration was higher than for those with rural household registration. These considerable impacts indicate that under China’s dual urban-rural household registration system, a gap remains between environmental infrastructure and publicity in rural and urban areas. Finally, income influences the WTP for carbon-labelled drinks, where a higher income is indicative of a higher WTP. This agrees with the majority of previous research results[98].
Confirmatory factor analysis
The results indicate that the measurement model is appropriate. First, a Harman single-factor test is conducted to examine potential common method bias. The first factor accounts for 33.13% of the total variance, well below the 50% benchmark[99], indicating no serious common method bias.
Table 5 presents the details of the model fit indices. Absolute fit, incremental fit, and parsimony-adjusted indices are used to evaluate the consistency between the hypothetical measurement model and the actual sample data. The absolute fit index, root mean square error of approximation (RMSEA), meets the fitting criteria with an estimate of 0.057. Both the incremental comparative fit index (CFI) and Tucker-Lewis index (TLI) exceed 0.9, indicating that the hypothetical model represents a significant improvement over the null model. The model is also not excessively complex, as the parsimony-adjusted comparative fit index (PCFI) is greater than 0.5.
Fitting degrees of measurement model
| Fitting index | Fitting criteria | Measurement model | Fit or not |
| RMSEA | < 0.08 | 0.057 | Fit |
| CFI | > 0.9 | 0.947 | Fit |
| TLI | > 0.9 | 0.942 | Fit |
| PCFI | > 0.5 | 0.867 | Fit |
Table 6 presents the reliability and validity analysis of the questionnaire. A Cronbach’s alpha above 0.7 for each construct indicates good internal consistency and high reliability[100]. All factor loadings, composite reliability, and average variance extracted (AVE) values exceed 0.5, 0.7, and 0.5, respectively, confirming good convergent validity[101]. Moreover, the correlation coefficients between constructs are smaller than the square root of the AVE for each construct, indicating good discriminant validity[102]. Exploratory factor analysis with orthogonal rotation extracts five common factors with loadings above 0.7, indicating that the questionnaire has good structural validity[103].
Results of reliability and validity analysis
| Construct | Item | Cronbach’s alpha | Convergent validity | Discriminant validity | ||||||
| Factor loadings | AVE | CR | EA | PC | PCL | ACL | WTP | |||
| EA | EA1 | 0.916 | 0.826*** | 0.578 | 0.915 | (0.760) | ||||
| EA2 | 0.820*** | |||||||||
| EA3 | 0.824*** | |||||||||
| EA4 | 0.823*** | |||||||||
| EA5 | 0.626*** | |||||||||
| EA6 | 0.657*** | |||||||||
| EA7 | 0.743*** | |||||||||
| EA8 | 0.618*** | |||||||||
| PC | PC1 | 0.848 | 0.785*** | 0.577 | 0.844 | 0.481 | (0.760) | |||
| PC2 | 0.802*** | |||||||||
| PC3 | 0.781*** | |||||||||
| PC4 | 0.662*** | |||||||||
| PCL | PCL1 | 0.863 | 0.903*** | 0.780 | 0.914 | 0.514 | 0.358 | (0.883) | ||
| PCL2 | 0.857*** | |||||||||
| PCL3 | 0.890*** | |||||||||
| ACL | ACL1 | 0.848 | 0.867*** | 0.705 | 0.905 | 0.351 | 0.326 | 0.393 | (0.840) | |
| ACL2 | 0.866*** | |||||||||
| ACL3 | 0.820*** | |||||||||
| ACL4 | 0.803*** | |||||||||
| WTP | WTP1 | 0.745 | 0.794*** | 0.587 | 0.810 | 0.258 | 0.353 | 0.242 | 0.253 | (0.766) |
| WTP2 | 0.720*** | |||||||||
| WTP3 | 0.783*** | |||||||||
SEM hypotheses test
With the reliability and validity of the SEM confirmed (RMSEA = 0.041, CFI = 0.971, TLI = 0.968, PCFI = 0.871), we assess the direct effects in the model in Table 7. Family income and household registration are controlled, since these demographic variables were significant in the ANOVA test. Of the proposed direct hypotheses, H1, H2, and H6 are supported, showing positive and statistically significant effects. EA has a positive influence (β = 0.075, P < 0.1) on college students’ WTP, and ACL and PC are highly significant (β = 0.079, P < 0.05 and β = 0.297, P < 0.01, respectively). These results are consistent with previous research findings from direct path analyses[30,47,51,61]. More importantly, this study further reveals the fundamental influence of PC across the entire mechanism process and emphasises the importance of the government’s strengthening environmental publicity and education.
Path relationships of structural model
| Paths | Estimate | S.E. | Est./S.E. | P-Value | Relationship |
| EA → WTP | 0.075 | 0.040 | 1.868 | * | Supported |
| PCL → WTP | 0.032 | 0.040 | 0.795 | NS | Rejected |
| ACL → WTP | 0.079 | 0.036 | 2.173 | ** | Supported |
| PC → WTP | 0.297 | 0.038 | 7.735 | *** | Supported |
| EA → PCL → WTP | 0.014 | 0.018 | 0.787 | NS | Rejected |
| EA → ACL → WTP | 0.011 | 0.006 | 1.918 | * | Supported |
| EA → PCL → ACL → WTP | 0.008 | 0.004 | 1.999 | ** | Supported |
| PC → PCL → WTP | 0.005 | 0.006 | 0.776 | NS | Rejected |
| PC → ACL → WTP | 0.015 | 0.007 | 2.073 | ** | Supported |
| PC → PCL → ACL → WTP | 0.003 | 0.002 | 1.800 | * | Supported |
We next examine the hypothesised mediating paths. In the EA → WTP path, the ACL has a partial mediating role (β = 0.011, P < 0.1), while PCL does not have a mediating role (β = 0.032, P > 0.1). ACL and PCL have a chain mediation effect (β = 0.008, P < 0.05). In the PC → WTP path, only ACL (β = 0.015, P < 0.05) has a partially mediating role, and ACL and PCL exhibit a chain-mediating role (β = 0.003, P < 0.1). From the indirect path, we determine that the PCL mediates the PC → PCL → ACL → WTP path, which verifies the research by Trivedi et al.[65]. However, PCL does not significantly mediate the effects of EA and PC on WTP, indicating that increased consumer PCL will not directly increase WTP and can only take effect on WTP indirectly via ACL. This is consistent with previous studies showing that most consumers do not truly understand carbon labels[104], preventing EA and publicity from translating into purchasing practices[104,105]. This result also implies that information has a crucial influence on shaping consumer perceptions of carbon labels. Adequate favourable information about carbon labels can positively influence consumers’ purchasing inclinations towards carbon-labelled products[25]. In this sense, our findings highlight the importance of strengthening carbon label publicity through advertising or education in the entire influence mechanism.
Based on the above hypothesis test results, we modify the conceptual framework of the influence mechanism of college students’ WTP for carbon-labelled drinks. The final model is illustrated in Figure 4.
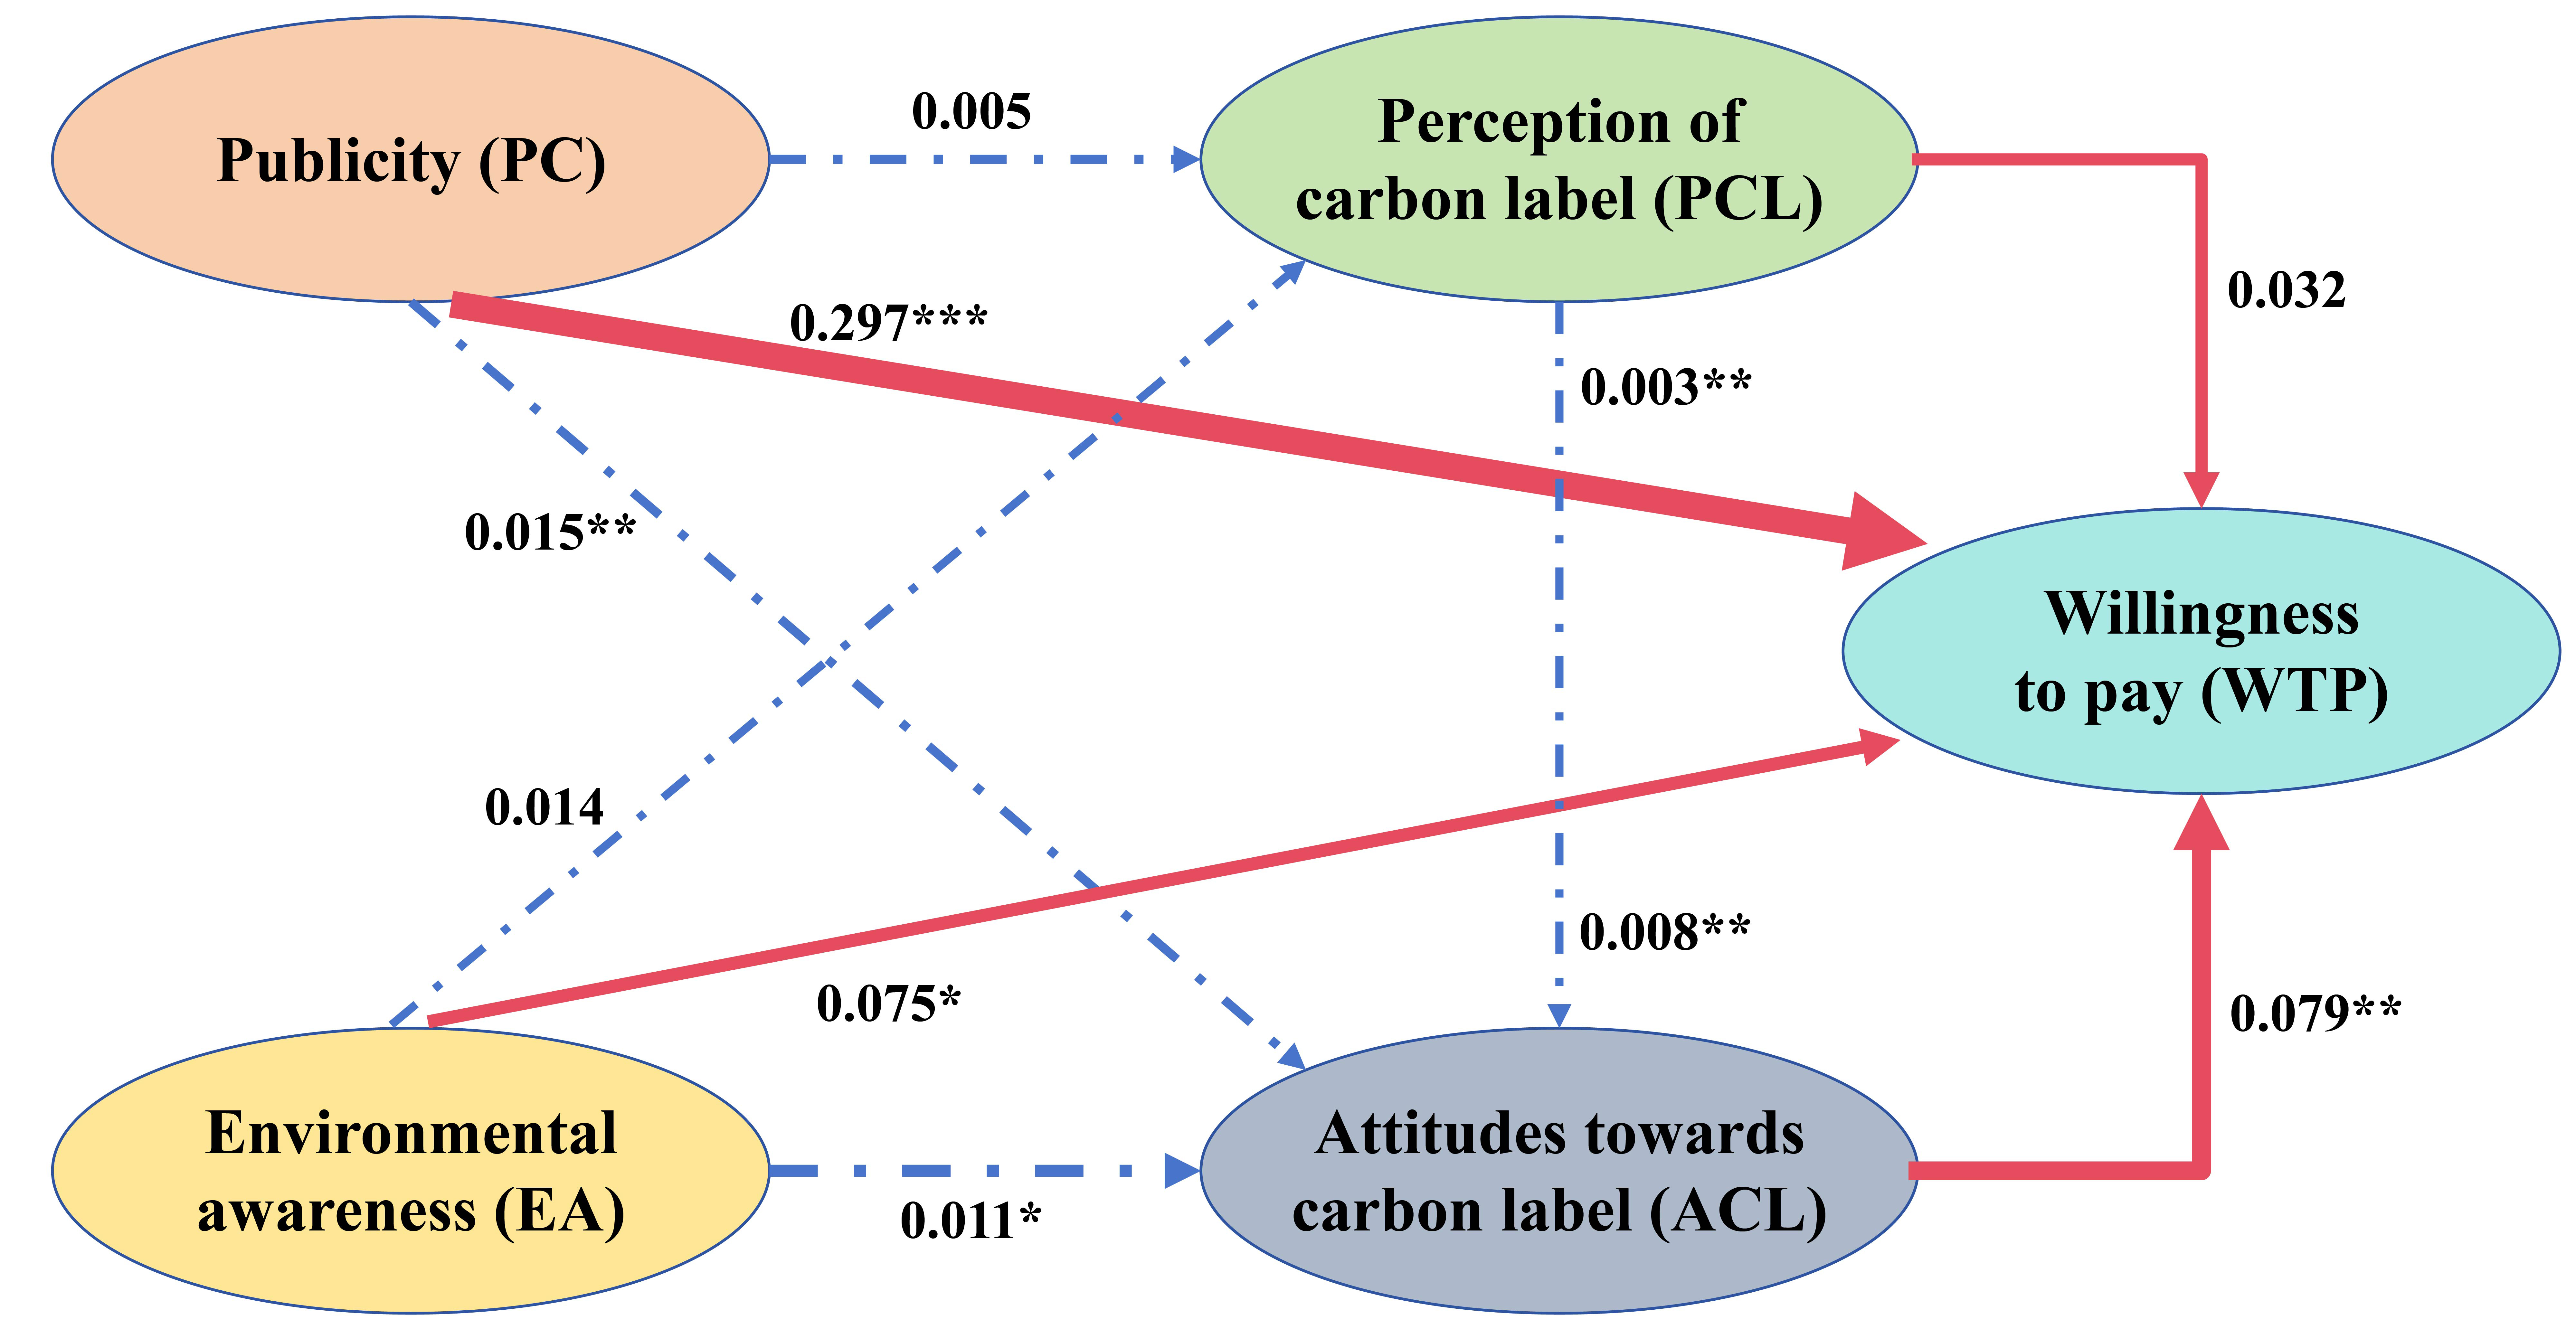
Figure 4. Revised conceptual framework of the influence mechanism underlying the WTP for carbon-labelled drinks. Created with Microsoft PowerPoint. *** Significant at P < 0.01; ** Significant at P < 0.05, * Significant at P < 0.1.
To test the robustness of the SEM outcomes, we conduct a subgroup analysis based on product categories. With satisfactory model fitness, the estimation results demonstrate high consistency with the former outcomes for water and wine [Table 8]. In contrast, only direct pathways remain significant for milk, while indirect pathways exhibit consistency with the main findings in terms of coefficient signs and magnitudes, despite being insignificant. Therefore, the robustness of our results across different drinks is validated.
Path relationships of different drinks
| Paths | All drinks | Water | Milk | Wine |
| EA → WTP | 0.075* | 0.053 | 0.096*** | 0.027 |
| PC → WTP | 0.297*** | 0.215*** | 0.191*** | 0.273*** |
| EA → PCL → WTP | 0.014 | 0.024 | 0.001 | 0.006 |
| EA → ACL → WTP | 0.011* | 0.011** | 0.005 | 0.009* |
| EA → PCL → ACL → WTP | 0.008** | 0.008** | 0.004 | 0.007* |
| PC → PCL → WTP | 0.005 | 0.008 | 0.001 | 0.002 |
| PC → ACL → WTP | 0.015** | 0.015** | 0.007 | 0.012* |
| PC → PCL → ACL → WTP | 0.003* | 0.003** | 0.001 | 0.002* |
DISCUSSION
Conclusions
This study first quantifies college students’ WTP for three types of carbon-labelled drinks in China. The results show that over 80% of respondents are willing to pay for carbon-labelled mineral water, milk, and wine. College students’ mean extra WTP is relatively high, with price premiums of 17.5%, 13.5%, and 12.9% for mineral water, milk, and wine, respectively. Furthermore, the WTP for a price premium decreases as the drink price increases. In contrast to previous research examining single or limited influencing factors, this study incorporates multiple factors into a single model, and the results demonstrate that the model is feasible in practice. College students with urban household registration and higher incomes are more willing to buy carbon-labelled drinks, while men are more willing to pay for carbon-labelled wine. EA, ACL, and PC all have a positive impact on consumer WTP. Moreover, ACL mediates the effects of EA and PC on WTP, and PCL and ACL exhibit a chain-mediating role. These findings indicate that well-educated young consumers can support the large-scale implementation of carbon labelling policies with high social acceptance[8,106]. Furthermore, we provide concrete evidence to support the development of targeted interventions aimed at consumers’ attitudes and perceptions of carbon labels to enhance policy effectiveness. Our findings are consistent with previous studies examining broader demographic groups in China[8] and in developing countries such as Egypt[106]. These results are informative for policymakers and enterprises seeking to operationalise carbon labelling systems, particularly in emerging economies.
Policy implications
The study demonstrates that 75.6% of responding college students believe carbon labels should be widely implemented, among whom 90% are willing to pay a 10% premium for carbon-labelled drinks. Therefore, the consumer market for carbon-labelled products has a promising future in China. These findings are expected to support the development and implementation of carbon labelling systems in China and provide a useful reference for promoting carbon-labelled products globally.
Improving carbon label publicity and enhancing EA are effective means to increase Chinese consumers’ WTP for carbon-labelled products. As many as 33.5% of college students reported that they had never heard of carbon labels, and 41.6% indicated that they were rarely exposed to publicity regarding carbon labels. Additionally, EA and PC positively influence WTP for carbon-labelled drinks through chain-mediating variables such as PCL and ACL. Therefore, the government should strengthen carbon label publicity efforts and raise consumers’ EA by identifying key consumer groups and developing corresponding strategies. Environmental education should go beyond improving consumers’ EA and teach them how to interpret carbon labels, including key metrics such as carbon footprints. Practical programs are also essential for raising students’ EA and promoting sustainable practices. Publicity should prioritise college students who demonstrate relatively higher WTP and willingness to participate in carbon-labelled product activities, encouraging them to take a leading role in adopting and promoting these products. For example, universities could encourage students with high WTP to post their low-carbon activities on social media to subtly influence their peers. Furthermore, since high EA does not necessarily guarantee clear perceptions of carbon labels, publicity campaigns could target male consumers who exhibit preferences for specific products and stronger low-carbon awareness than females, turning their awareness into low-carbon consumption practices and ultimately cultivating growth in carbon-labelled product consumption. Enterprises with on-campus retailers may improve advertising strategies by selling carbon-labelled drinks in dining halls and stores and providing information about the labels to enhance consumers’ perceptions and WTP.
Despite strong EA and clear perceptions of carbon-labelled products, consumers are unlikely to pay for these products without financial support. Since price is the primary barrier, increasing consumers’ income combined with targeted financial interventions should boost demand for carbon-labelled products. Our findings also emphasise the importance of appropriate pricing and establishing price premiums. Therefore, a pricing mechanism that involves the government, enterprises, and consumers should be constructed. Enterprises should bear a larger share of the price premium for high-priced products, while the government should provide support (e.g., subsidies, tax relief) for carbon label certification. Consumers should bear a lower proportion of the price premium. Targeted consumption incentives, such as vouchers for
Limitations and future research
Three study limitations are worth acknowledging, as they suggest opportunities for future research. First, although we include several deviation-reducing methods in our CVM study, deviations in actual WTP caused by the questionnaire are inevitable because the carbon label market in China is still immature. CVM surveys may suffer from overestimation due to sequencing effects, social desirability, strategic bias, and related concerns[110,111]. Future research should incorporate alternative methodologies to validate our findings, such as choice experiments that simulate real-world consumption behaviours through pilot products.
Second, although the empirical results demonstrate that the conceptual framework constructed in this study is well-grounded, future research could track and compare WTP changes over time and across different carbon-labelled products. To further test the generalisability of our model, it would be valuable to examine invariance across individuals with diverse demographic characteristics, such as varying price sensitivity, cultural backgrounds, and occupations.
Finally, research on carbon labels should not be restricted to consumers, as the real-world implementation and promotion of carbon labelling systems require collaborative efforts from the government, enterprises, and consumers. Therefore, it would be useful to explore both the individual and mutual influences of these stakeholders on carbon labelling systems.
DECLARATIONS
Authors’ contributions
Conception and study design: Fang, K.; Li, C.; Mao, M.
Data analysis and manuscript writing: Li, C.; Mao, M.; Li, R.; Fang, K.; Wiloso, E. I.
Data acquisition: Mao, M.; Li, C.; Li, R.
Availability of data and materials
The raw data that support the findings of this study are available from the corresponding author upon reasonable request.
Financial support and sponsorship
This study was financially supported by the Major Project of National Social Science Fund of China (22&ZD108, 24VRC079), the National Natural Science Foundation of China (72074193, 72534005, 71704157), and the Key R&D Program of Zhejiang Province (2022C03154).
Conflicts of interest
Prof. Fang, K. is an Editorial Board Member of the journal Carbon Footprints. He was not involved in any steps of the editorial process, notably including reviewers’ selection, manuscript handling, or decision-making. The other authors declare that there are no conflicts of interest.
Ethical approval and consent to participate
Not applicable.
Consent for publication
Not applicable.
Copyright
© The Author(s) 2025.
REFERENCES
1. Friedlingstein, P.; Jones, M. W.; O’sullivan, M.; et al. Global carbon budget 2021. Earth. Syst. Sci. Data. 2022, 14, 1917-2005.
2. IPCC. Climate change 2022: mitigation of climate change. Contribution of Working Group III to the Sixth Assessment Report of the Intergovernmental Panel on Climate Change, Shukla, P.R.; Skea, J.; Slade, R.; et al.; Eds.; Cambridge University Press; 2022. https://www.ipcc.ch/report/ar6/wg3/ (accessed 2025-12-10).
3. Lu, Q.; Fang, K.; Heijungs, R.; et al. Imbalance and drivers of carbon emissions embodied in trade along the Belt and Road Initiative. Appl. Energy. 2020, 280, 115934.
4. Lenzen, M.; Sun, Y.; Faturay, F.; Ting, Y.; Geschke, A.; Malik, A. The carbon footprint of global tourism. Nat. Clim. Change. 2018, 8, 522-8.
5. ISO/TS 14067. Greenhouse gases-carbon footprint of products-requirements and guidelines for quantification and communication. 2013. https://www.iso.org/obp/ui/es/#iso:std:iso:ts:14067:ed-1:v1:en (accessed 2025-12-16).
6. Liu, T.; Wang, Q.; Su, B. A review of carbon labeling: standards, implementation, and impact. Renew. Sustain. Energy. Rev. 2016, 53, 68-79.
7. Taufique, K. M. R.; Nielsen, K. S.; Dietz, T.; Shwom, R.; Stern, P. C.; Vandenbergh, M. P. Revisiting the promise of carbon labelling. Nat. Clim. Chang. 2022, 12, 132-40.
8. Zhao, R.; Geng, Y.; Liu, Y.; Tao, X.; Xue, B. Consumers’ perception, purchase intention, and willingness to pay for carbon-labeled products: a case study of Chengdu in China. J. Clean. Prod. 2018, 171, 1664-71.
9. Wang, L.; Shang, Y.; Li, C. How to improve the initiative and effectiveness of enterprises to implement environmental management system certification? J. Clean. Prod. 2023, 404, 137013.
10. Chen, X.; Zhen, S.; Li, S.; Yang, J.; Ren, Y. Consumers’ willingness to pay for carbon-labeled agricultural products and its effect on greenhouse gas emissions: evidence from beef products in urban China. Environ. Impact. Assess. Rev. 2024, 106, 107528.
11. Xu, M.; Lin, B. Leveraging carbon label to achieve low-carbon economy: evidence from a survey in Chinese first-tier cities. J. Environ. Manage. 2021, 286, 112201.
12. Mohmmed, A.; Li, Z.; Olushola, Arowolo. A.; et al. Driving factors of CO2 emissions and nexus with economic growth, development and human health in the Top Ten emitting countries. Resour. Conserv. Recycl. 2019, 148, 157-69.
13. Li, Q.; Long, R.; Chen, H. Empirical study of the willingness of consumers to purchase low-carbon products by considering carbon labels: a case study. J. Clean. Prod. 2017, 161, 1237-50.
14. He, J.; Yang, Y.; Liao, Z.; Xu, A.; Fang, K. Linking SDG 7 to assess the renewable energy footprint of nations by 2030. Appl. Energy. 2022, 317, 119167.
15. Wu, Z.; Tan, Y.; Fang, K.; Wu, X.; Ge, Y.; Chang, J. Scaling laws of energy metabolism in modern cities: insights from biological metabolism. Energy. Build. 2025, 332, 115421.
16. Ding, Z.; Jiang, X.; Liu, Z.; Long, R.; Xu, Z.; Cao, Q. Factors affecting low-carbon consumption behavior of urban residents: a comprehensive review. Resour. Conserv. Recycl. 2018, 132, 3-15.
17. Tao, S.; Wu, X.; Fang, K.; Lin, D. Identifying drivers of county-level industrial carbon intensity by a generic machine learning framework. J. Clean. Prod. 2024, 454, 142276.
18. Zhang, D.; Yang, T.; Lou, S. The new fashion for sustainable consumption: would you buy carbon label textiles?: Innovative conceptual model based on the theory of planned behavior and signaling theory. Environ. Dev. Sustain.. 2025.
19. Zhan, Y.; Ren, Y.; Xu, J. Willingness to pay a premium for Eco-Label products in China: a mediation model based on quality value. Sci. Rep. 2025, 15, 1783.
20. Liu, M. Chinese consumer preferences and willingness to pay for carbon-labeled eggs: an analysis based on choice experiment method. Front. Sustain. Food. Syst. 2025, 9, 1569674.
21. Zhao, R.; Wu, D.; Zhang, J. Policy Implications on carbon labeling scheme toward carbon neutrality in China. Front. Environ. Sci. 2021, 9, 739943.
22. Ma, M.; Zhou, N.; Feng, W.; Yan, J. Challenges and opportunities in the global net-zero building sector. Cell. Rep. Sustain. 2024, 1, 100154.
23. National Certification and Accreditation Administration. Notice Concerning the list of pilot product carbon footprint labelling and certification. 2024. https://www.cnca.gov.cn/zwxx/tz/2024/art/2024/art_06b0e33152304fb5820e31a8c0c2a0ac.html (accessed 2025-12-16).
24. Imran, N.; Kumar, M.; Jagtap, S.; Trollman, H.; Gupta, S.; Garcia-garcia, G. Exploring consumer behaviour on carbon labelled food products: Evidence from a survey on the case of sandwich production and consumption in UK. J. Agric. Food. Res. 2025, 21, 101937.
25. Xu, Y.; Zhang, Z.; Ren, Y.; et al. Can carbon labels shift consumers towards sustainable food? Evidence from Chinese consumers. Sustain. Futures. 2024, 8, 100363.
26. He, J.; Wang, S.; Heijungs, R.; et al. Interprovincial food trade aggravates China’s land scarcity. Humanit. Soc. Sci. Commun. 2024, 11, 76.
27. Rijnsoever, F. J.; van Mossel, A.; Broecks, K. P. Public acceptance of energy technologies: the effects of labeling, time, and heterogeneity in a discrete choice experiment. Renew. Sust. Energ. Rev. 2015, 45, 817-29.
28. Hartikainen, H.; Roininen, T.; Katajajuuri, J.; Pulkkinen, H. Finnish consumer perceptions of carbon footprints and carbon labelling of food products. J. Clean. Prod. 2014, 73, 285-93.
29. Gadema, Z.; Oglethorpe, D. The use and usefulness of carbon labelling food: a policy perspective from a survey of UK supermarket shoppers. Food. Policy. 2011, 36, 815-22.
30. Feucht, Y.; Zander, K. Consumers’ preferences for carbon labels and the underlying reasoning. A mixed methods approach in 6 European countries. J. Clean. Prod. 2018, 178, 740-8.
31. Upham, P.; Dendler, L.; Bleda, M. Carbon labelling of grocery products: public perceptions and potential emissions reductions. J. Clean. Prod. 2011, 19, 348-55.
32. Xiang, C.; Liu, N. Factors and paths influencing students’ low-carbon behavior. Carbon. Manag. 2024, 15, 2349173.
33. Ren, G.; Liu, C.; Chen, Y. Motivation and guidance of college students’ low-carbon behavior: evidence from Chinese colleges and universities. Front. Psychol. 2024, 15, 1375583.
34. Cripps, J.; Thiagarajah, K. What do college students’ think on meat consumption and environmental sustainability? An exploratory study. J. Nutr. Educ. Behav. 2018, 50, S16-7.
35. Wang, C.; Zhou, X.; Zhang, R.; Liu, Y. The impact of context cues on college students’ purchase behavior for low-carbon products in CBEC. Front. Psychol. 2023, 14, 1287235.
36. Genc, T.; Ekici, A. A new lens to the understanding and reduction of household food waste: a fuzzy cognitive map approach. Sustain. Prod. Consum. 2022, 33, 389-411.
37. Meyers, S.; Schmitt, B.; Chester-jones, M.; Sturm, B. Energy efficiency, carbon emissions, and measures towards their improvement in the food and beverage sector for six European countries. Energy 2016, 104, 266-83.
38. Feng, W.; Cai, B.; Zhang, B. A Bite of China: food consumption and carbon emission from 1992 to 2007. China. Econ. Rev. 2020, 59, 100949.
39. Stern, P. C. New environmental theories: toward a coherent theory of environmentally significant behavior. J. Soc. Isssues. 2000, 56, 407-24.
40. Foxall, R. G.; Goldsmith, R. E.; Brown, S. Consumer psychology for marketing. Hampshire: Cengage Learning EMEA, 1998. https://archive.org/details/consumerpsycholo0000foxa_s3h5/mode/2up (accessed 2025-12-16).
41. Ajzen, I.; Fishbein, M. Understanding attitudes and predicting social behavior. Englewood Cliffs, NJ: Prentice-Hall, 1980. https://catalog.nlm.nih.gov/discovery/fulldisplay/alma996273473406676/01NLM_INST:01NLM_INST (accessed 2025-12-16).
42. Roth, C. E. Environmental literacy: it’s roots, evolution and directions in the 1990s. ERIC Clearinghouse for Science, Mathematics, and Environmental Education, Columbus, OH. 1992, ED348235. https://eric.ed.gov/?id=ED348235 (accessed 2025-12-16).
43. Maloney, M. P.; Ward, M. P. Ecology: let’s hear from the people: an objective scale for the measurement of ecological attitudes and knowledge. Am. Psychol. 1973, 28, 583-6.
44. Catton, W. R.; Dunlap, R. E. Environmental sociology: a new paradigm. Am. Sociol. 1978, 13, 41-9. https://www.jstor.org/stable/27702311 (accessed 2025-12-16).
45. Diekmann, A.; Preisendörfer, P. Umweltbewusstsein, ökonomische Anreize und Umweltverhalten. Schweiz. Z. Soziol. 1991, 17, 207-31. https://szs.sgs-sss.ch/wp-content/uploads/2016/08/revue_17_2_1991.pdf (accessed 2025-12-16).
46. Wang, L.; Chen, L.; Li, C. Research on strategies for improving green product consumption sentiment from the perspective of big data. J. Retail. Consum. Serv. 2024, 79, 103802.
47. Maniatis, P. Investigating factors influencing consumer decision-making while choosing green products. J. Clean. Prod. 2016, 132, 215-28.
48. Naderi, I.; Van Steenburg, E. Me first, then the environment: young Millennials as green consumers. Young. Consum. 2018, 19, 280-95.
49. Kumar, D.; Raju, K. The role of advertising in consumer decision making. J. Bus. Manag. 2024, 14, 35-7.
50. Maichum, K.; Parichatnon, S.; Peng, K. Application of the Extended theory of planned behavior model to investigate purchase intention of green products among thai consumers. Sustainability 2016, 8, 1077.
51. Wong, E. Y. C.; Chan, F. F. Y.; So, S. Consumer perceptions on product carbon footprints and carbon labels of beverage merchandise in Hong Kong. J. Clean. Prod. 2020, 242, 118404.
52. Edenbrandt, A. K.; Lagerkvist, C. J.; Nordström, J. Interested, indifferent or active information avoiders of carbon labels: cognitive dissonance and ascription of responsibility as motivating factors. Food. Policy. 2021, 101, 102036.
53. Wang, L.; Gao, P.; Li, C. Public response to heterogeneous environmental policies: scenario-based experiments from interest appeal, implementation costs, and commitment mechanism. Energy. Sour. B. Econ. Plan. Policy. 2024, 19, 2304905.
54. Lee, E.; Lee, S.; Yang, C. The influences of advertisement attitude and brand attitude on purchase intention of smartphone advertising. Ind. Manag. Data. Syst. 2017, 117, 1011-36.
55. Kasterine, A.; Vanzetti, D. The effectiveness, efficiency and equity of market based and voluntary measures to mitigate greenhouse gas emissions from the agri-food sector. Geneva: United Nations Conference on Trade and Development, 2010. https://papers.ssrn.com/sol3/papers.cfm?abstract_id=1768948 (accessed 2025-12-16).
56. Marcon, A.; Ribeiro, J. L. D.; Dangelico, R. M.; de Medeiros, J. F.; Marcon, É. Exploring green product attributes and their effect on consumer behaviour: a systematic review. Sustain. Prod. Consum. 2022, 32, 76-91.
57. Perino, G.; Panzone, L. A.; Swanson, T. Motivation crowding in real consumption decisions: who is messing with my groceries? Econ. Inq. 2014, 52, 592-607.
58. Vanclay, J. K.; Shortiss, J.; Aulsebrook, S.; et al. Customer response to carbon labelling of groceries. J. Consum. Policy. 2011, 34, 153-60.
59. Lourenco, C. E.; Porpino, G.; Araujo, C. M. L.; Vieira, L. M.; Matzembacher, D. E. We need to talk about infrequent high volume household food waste: a theory of planned behaviour perspective. Sustain. Prod. Consum. 2022, 33, 38-48.
60. Miller, K. Communications theories: perspectives, processes, and contexts. New York: McGraw-Hill, 2005. https://books.google.com/books/about/Communication_Theories_Perspectives_Proc.html?id=uQgcAQAAIAAJ (accessed 2025-12-16).
61. Paul, J.; Modi, A.; Patel, J. Predicting green product consumption using theory of planned behavior and reasoned action. J. Retail. Consum. Serv. 2016, 29, 123-34.
62. Taufique, K. M.; Vaithianathan, S. A fresh look at understanding Green consumer behavior among young urban Indian consumers through the lens of Theory of Planned Behavior. J. Clean. Prod. 2018, 183, 46-55.
63. Kollmuss, A.; Agyeman, J. Mind the Gap: why do people act environmentally and what are the barriers to pro-environmental behavior? Environ. Educ. Res. 2002, 8, 239-60.
64. Kim, B.; Schuldt, J. P. Judging the environmental impact of green consumption: evidence of quantity insensitivity. J. Environ. Psychol. 2018, 60, 122-7.
65. Trivedi, R. H.; Patel, J. D.; Acharya, N. Causality analysis of media influence on environmental attitude, intention and behaviors leading to green purchasing. J. Clean. Prod. 2018, 196, 11-22.
66. Davis, R. K. Recreation planning as an economic problem. Nat. Resour. J. 1963, 3, 239-49. https://digitalrepository.unm.edu/nrj/vol3/iss2/3 (accessed 2025-12-11).
67. Zhu, L.; Song, Q.; Sheng, N.; Zhou, X. Exploring the determinants of consumers’ WTB and WTP for electric motorcycles using CVM method in Macau. Energy. Policy. 2019, 127, 64-72.
68. Madududu, P.; Jourdain, D.; Tran, D.; et al. Consumers’ willingness-to-pay for dairy and plant-based milk alternatives towards sustainable dairy: a scoping review. Sustain. Prod. Consum. 2024, 51, 261-77.
69. Parvizi, S.; Mehrara, M.; Taiebnia, A. Individuals’ willingness to pay for HIV vaccines in Iran: contingent valuation method. Health. Sci. Rep. 2024, 7, e70016.
70. Wang, Y.; Wu, L.; Zhou, Y. Household’s willingness to pay for renewable electricity: a meta-analysis. Energy. Econ. 2024, 131, 107390.
71. Huang, Q. Recent advances of information literacy education for international students in Chinese academic libraries. J. Acad. Librariansh. 2022, 48, 102497.
72. Huang, C. L.; Chen, J. Y.; Lin, X. Q.; Deng, J. S.; Tung, T. H.; Zhu, J. S. Parents’ willingness to pay for their children’s COVID-19 vaccine in Taiwan, China: a cross-sectional study. Hum. Vaccin. Immunother. 2023, 19, 2168936.
73. Jackson, D. L. Revisiting sample size and number of parameter estimates: some support for the N:q hypothesis. Struct. Equ. Model. 2003, 10, 128-41.
74. National Bureau of Statistics of China. Statistical Monitoring Report of China National Program for Women’s Development (2021-2030) in 2023. https://www.stats.gov.cn/sj/zxfb/202501/t20250124_1958439.html (accessed 2025-12-10).
75. Ning, J. Main data of the seventh national population census. National Bureau of Statistics of China. 2021. https://www.stats.gov.cn/english/PressRelease/202105/t20210510_1817185.html (accessed 2025-12-10).
76. Ravallion, M.; Chen, S. Fleshing out the olive? Observations on income polarization in China since 1981. China. Econ. Rev. 2022, 76, 101871.
77. Bengart, P.; Vogt, B. Fuel mix disclosure in Germany-the effect of more transparent information on consumer preferences for renewable energy. Energy. Policy. 2021, 150, 112120.
78. Tao, Y.; Duan, M.; Deng, Z. Using an extended theory of planned behaviour to explain willingness towards voluntary carbon offsetting among Chinese consumers. Ecol. Econ. 2021, 185, 107068.
79. Lim, Y. W.; Shafie, A. A.; Chua, G. N.; Hassali, M. A. A. Determination of cost-effectiveness threshold for health care interventions in Malaysia. Value. Health. 2017, 20, 1131-8.
81. Aristizabal, J.; Giraldo, R.; Mateu, J. Analysis of variance for spatially correlated functional data: application to brain data. Spat. Stat. 2019, 32, 100381.
82. Meyners, M.; Hasted, A. On the applicability of ANOVA models for CATA data. Food. Qual. Prefer. 2021, 92, 104219.
83. Ajayi, S. O.; Oyedele, L. O. Critical design factors for minimising waste in construction projects: a structural equation modelling approach. Resour. Conserv. Recycl. 2018, 137, 302-13.
84. Jain, P.; Jain, P. Are the sustainable development goals really sustainable? A policy perspective. Sustain. Dev. 2020, 28, 1642-51.
85. Petersen, L.; Hörisch, J.; Jacobs, K. Worse is worse and better doesn’t matter?: The effects of favorable and unfavorable environmental information on consumers’ willingness to pay. J. Ind. Ecol. 2021, 25, 1338-56.
86. Flora, D. B.; Curran, P. J. An empirical evaluation of alternative methods of estimation for confirmatory factor analysis with ordinal data. Psychol. Methods. 2004, 9, 466-91.
87. Marquart-Pyatt, S. T.; Shwom, R. L.; Dietez, T.; et al. Understanding public opinion on climate change: a call for research. Environ. Sci. Policy. Sustain. Dev. 2011, 53, 38-42. https://www.tandfonline.com/doi/full/10.1080/00139157.2011.588555 (accessed 2025-12-11).
88. Zhao, R.; Yang, M.; Liu, J.; Yang, L.; Bao, Z.; Ren, X. University students’ purchase intention and willingness to pay for carbon-labeled food products: a purchase decision-making experiment. Int. J. Environ. Res. Public. Health. 2020, 17, 7026.
89. Li, X.; Jensen, K. L.; Clark, C. D.; Lambert, D. M. Consumer willingness to pay for beef grown using climate friendly production practices. Food. Policy. 2016, 64, 93-106.
90. Wang, X.; Li, W.; Song, J.; Duan, H.; Fang, K.; Diao, W. Urban consumers’ willingness to pay for higher-level energy-saving appliances: focusing on a less developed region. Resour. Conserv. Recycl. 2020, 157, 104760.
91. Schäufele, I.; Hamm, U. Consumers’ perceptions, preferences and willingness-to-pay for wine with sustainability characteristics: a review. J. Clean. Prod. 2017, 147, 379-94.
92. Valenzuela, L.; Ortega, R.; Moscovici, D.; Gow, J.; Ugaglia, A. A.; Mihailescu, R. Consumer willingness to pay for sustainable wine-the Chilean case. Sustainability 2022, 14, 10910.
93. Stockl, A. F.; Moscovici, D.; Tischler, S.; Eitle, M. W.; Dolezal, C. Consumer knowledge and preferences for organic and sustainably certified wines: lessons from the DACH Region-Germany, Austria, and Switzerland. Sustainability 2024, 16, 4464.
94. Lea, E.; Worsley, T. Australians’ organic food beliefs, demographics and values. British. Food. Journal. 2005, 107, 855-69.
95. Bougherara, D.; Combris, P. Eco-labelled food products: what are consumers paying for? Eur. Rev. Agric. Econ. 2009, 36, 321-41.
96. Gilg, A.; Barr, S. Behavioural attitudes towards water saving? Evidence from a study of environmental actions. Ecol. Econ. 2006, 57, 400-14.
97. Tianyu, J.; Meng, L. Does education increase pro-environmental willingness to pay? Evidence from Chinese household survey. J. Clean. Prod. 2020, 275, 122713.
98. Brécard, D.; Hlaimi, B.; Lucas, S.; Perraudeau, Y.; Salladarré, F. Determinants of demand for green products: an application to eco-label demand for fish in Europe. Ecol. Econ. 2009, 69, 115-25.
99. Podsakoff, P. M.; Organ, D. W. Self-reports in organizational research: problems and prospects. J. Manag. 1986, 12, 531-44.
100. Yates, J. F.; Stone, E. R. The risk construct. In Yates, J. F.; Eds.; Risk-taking behavior. UK: Wiley Chichester, 1992;1-25. https://www.researchgate.net/publication/232505306_The_risk_construct (accessed 2025-12-16).
101. Hair, J. F.; Sarstedt, M.; Ringle, C. M.; Mena, J. A. An assessment of the use of partial least squares structural equation modeling in marketing research. J. Acad. Mark. Sci. 2012, 40, 414-33.
102. Cheung, G. W.; Cooper-thomas, H. D.; Lau, R. S.; Wang, L. C. Reporting reliability, convergent and discriminant validity with structural equation modeling: a review and best-practice recommendations. Asia. Pac. J. Manag. 2024, 41, 745-83.
103. Hinkin, T. R. A brief tutorial on the development of measures for use in survey questionnaires. Organ. Res. Methods. 1998, 1, 104-21.
104. Rondoni, A.; Grasso, S. Consumers behaviour towards carbon footprint labels on food: a review of the literature and discussion of industry implications. J. Clean. Prod. 2021, 301, 127031.
105. Cadario, R.; Li, Y.; Klesse, A. K. Bridging the knowledge gap: mapping carbon emissions to food items facilitates choices of plant-based over animal-based items. Appetite 2025, 208, 107910.
106. Mostafa, M. M. Egyptian consumers’ willingness to pay for carbon-labeled products: a contingent valuation analysis of socio-economic factors. J. Clean. Prod. 2016, 135, 821-8.
107. Tang, Y.; Zhang, Q.; Fang, K. Does international trade reduce global carbon inequality? Evidence from a producer-consumer shared responsibility. J. Environ. Manage. 2024, 355, 120307.
108. Zhang, Q.; Fang, K. Comment on “Consumption-based versus production-based accounting of CO2 emissions: is there evidence for carbon leakage? Environ. Sci. Policy. 2019, 101, 94-6.
109. Raman, R.; Lathabai, H. H.; Nedungadi, P. Sustainable development goal 12 and its synergies with other SDGs: identification of key research contributions and policy insights. Discov. Sustain. 2024, 5, 150.
110. Oerlemans, L. A.; Chan, K.; Volschenk, J. Willingness to pay for green electricity: a review of the contingent valuation literature and its sources of error. Renew. Sustain. Energy. Rev. 2016, 66, 875-85.
Cite This Article
How to Cite
Download Citation
Export Citation File:
Type of Import
Tips on Downloading Citation
Citation Manager File Format
Type of Import
Direct Import: When the Direct Import option is selected (the default state), a dialogue box will give you the option to Save or Open the downloaded citation data. Choosing Open will either launch your citation manager or give you a choice of applications with which to use the metadata. The Save option saves the file locally for later use.
Indirect Import: When the Indirect Import option is selected, the metadata is displayed and may be copied and pasted as needed.
About This Article
Copyright

Data & Comments
Data
0


Comments
Comments must be written in English. Spam, offensive content, impersonation, and private information will not be permitted. If any comment is reported and identified as inappropriate content by OAE staff, the comment will be removed without notice. If you have any queries or need any help, please contact us at [email protected].