


fig3
From: Methane emissions from China’s waste sector: generation patterns, drivers, and mitigation potential
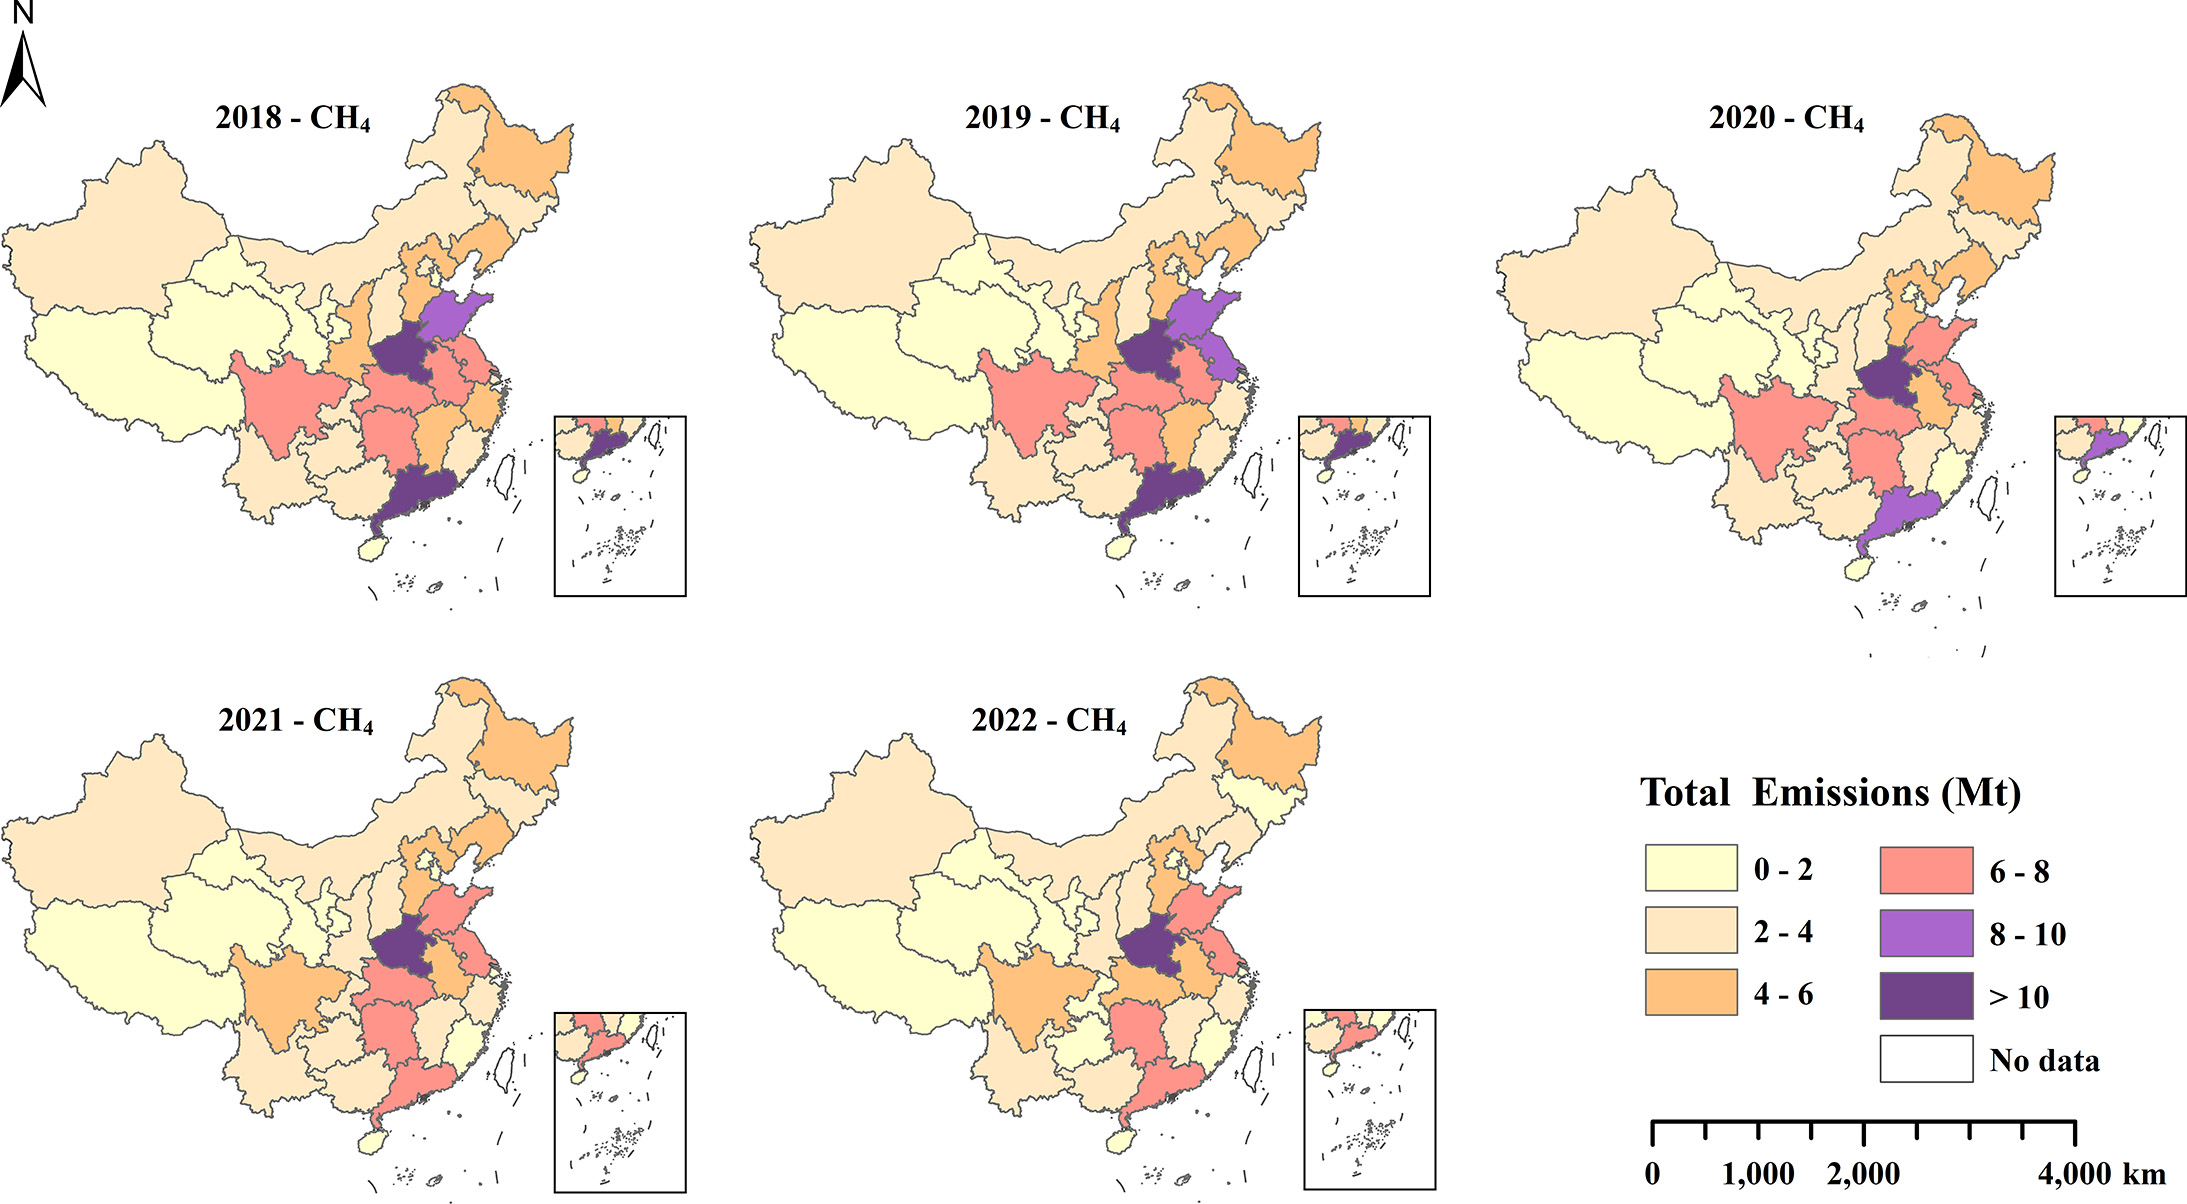
Figure 3. Regional distribution of methane emissions from waste in China, 2018-2022. The map used in the figure is the official map of China [GS(2024) 0650].


