

Methane emissions from China’s waste sector: generation patterns, drivers, and mitigation potential
 0
0 
Abstract
Methane is a potent greenhouse gas with a 100-year global warming potential of 27.9 and has become a major focus in global climate governance. As a major emitter, China faces substantial challenges in managing methane emissions from its waste sector. This study examines the patterns of methane generation and the potential for mitigation across different waste disposal systems in China. We established a comprehensive methane accounting model and quantified emissions from four waste sectors: municipal solid waste, urban sewage, agricultural cropping, and livestock and poultry farming. Using data from 2018 to 2022, we found that total methane emissions from waste in China were 10.2 million tons in 2022, representing a 27.8% decline, mainly due to substantial reductions in municipal solid waste emissions. In contrast, emissions from agricultural sources, particularly livestock and poultry farming, have increased, underscoring the need for targeted mitigation strategies. To assess future pathways, three policy scenarios were designed: Business as Usual (BAU), Urban Waste Recycling (UWR), and Agricultural Carbon Reduction and Sequestration (ACRS). The projections for 2025-2030 indicate that the ACRS scenario yields the greatest reduction in methane emissions, driven primarily by straw-to-fuel utilization and improved livestock manure management. This study provides valuable insights into the sources, drivers, and future trajectories of methane emissions from waste in China, and offers policy recommendations to maximize methane mitigation benefits while minimizing greenhouse gas abatement costs.
Keywords
INTRODUCTION
Methane is the second most significant greenhouse gas, with a 100-year global warming potential (GWP100) of 27.9. Effectively controlling methane emissions is a critical component of global climate governance, contributing not only to climate mitigation but also to economic co-benefits due to methane’s inherent energy value. Annual global methane emissions are estimated at around 610 million tons, with human activities accounting for nearly two-thirds of the total[1]. Methane emissions have continued to rise, reaching approximately 572-689 Tg per year during 2008-2017, reflecting a persistent upward trend since the early 2000s[2], with anthropogenic sources contributing about half of the total budget[3]. While global methane emissions continue to grow, regional trajectories diverge significantly: emissions from Annex I parties such as the EU, USA, and Russia have declined since 1990, whereas non-Annex I countries including Brazil, China, India, Indonesia, and the Democratic Republic of the Congo have experienced substantial increases[4-6]. Current assessments emphasize the urgent need to achieve substantial methane reductions by 2030 to meet the objectives of the Paris Agreement. Achieving net-zero warming by 2050, relative to 2020, could be possible through rapid technical and behavioral interventions, provided these measures are implemented between 2033 and 2041 in line with the Global Methane Pledge[7].
The waste management sector represents a major source of anthropogenic methane, responsible for 19.9% of global emissions in 2022[8]. Over the past five decades, globalization-driven economic expansion has led to rising resource consumption in production and consumption systems, thereby intensifying methane emissions from waste streams[1]. Between 2010 and 2021, methane emissions from waste treatment grew faster than those from agriculture (48.4%) and energy (31.7%), reaching 19.9% of total emissions, with an average annual increase of 1.68% from solid waste treatment and wastewater management[9]. Compared with the energy sector, methane control technologies in waste management are generally more technically mature, offer a broader range of mitigation approaches, and respond more readily to policy interventions. Successful practices such as solid waste recycling and landfill gas recovery provide important empirical references for effective emission reduction strategies. For example, since 1990, the United States has implemented regulatory standards under the Resource Conservation and Recovery Act and the Clean Air Act to cap urban landfill sites and prevent gas leakage, resulting in a sharp decline in methane emissions from waste disposal between 1990 and 2000. In 1996, the UK introduced a landfill tax imposing high fees on biodegradable waste, effectively reducing methane emissions. Similarly, in 1999, the European Union issued the Landfill Directive, mandating the recovery and utilization of landfill gas or its combustion at landfill sites. China has also prioritized non-CO2 greenhouse gas reduction[9]. In 2023, the Ministry of Ecology and Environment of China launched the Methane Emissions Control Plan, outlining measures and targets for reducing methane emissions across energy, agriculture, livestock, waste management, and wastewater treatment by 2030. However, projections by the United Nations Environment Programme (UNEP) under baseline policy scenarios suggest continued growth in waste-related methane emissions, with a likely peak around 2050[10]. This trajectory underscores the urgent need to accelerate technological implementation and strengthen policy frameworks in waste management systems.
Research on methane emissions from waste systems has largely focused on municipal solid waste (MSW) and wastewater treatment infrastructure. Many studies indicate that methane emissions from these sectors are underestimated globally[11-14]. Du et al. analyzed provincial-level methane emissions from MSW landfills in China using IPCC Guidelines for National Greenhouse Gas Inventories and first-order decay modeling, revealing an annual increase of 71.79 Gg between 2003 and 2013, with faster growth in northern and western provinces compared with coastal regions[15]. Ghosh et al. assessed methane emissions from three non-engineered landfills in Delhi (1984-2015) using the IPCC Default Method (DM), First-Order Decay (FOD), and Landfill Gas Emissions Model (LandGEM)[16]. They reported estimated emissions of
In agriculture, most methane research focuses on paddy cultivation, while methane from agricultural waste, primarily crop residues, remains less studied. China's large volume of straw production represents a potentially significant source of methane through thermochemical conversion, yet emission dynamics in fuel production systems are insufficiently characterized. Xu et al. used the extended Logarithmic Mean Divisia Index (LMDI) method and Tapio’s decoupling index to analyze methane reduction in China’s agricultural sector (2010-2019)[26]. Shen et al. assessed long-term methane emissions from rice cultivation in China (2000-2060) using an integrated approach, identifying key drivers such as straw return rate (RSA), fertilization, and climate factors[27]. Other studies examine methane emissions from a broader perspective, considering urban energy consumption, food production, and consumption. Brown reviewed greenhouse gas accounting protocols for landfill diversion of food and yard waste, analyzing the Climate Action Reserve (CAR) and U.S. EPA WARM models with a focus on methane avoidance through decay rate constants and gas collection efficiency[28]. Wang et al. developed a dynamic model combined with the LMDI method to assess CH4 emissions from China's fossil-fuel and food systems[29]. Livestock methane emissions primarily derive from manure management systems and vary depending on handling methods. Wang et al. established a high-resolution dataset of livestock methane emissions in China (1990-2020), revealing that low-cost interventions could cut emissions by 36% ± 8% (4.4-6.9 Mt) by 2030[30]. Zhang et al. reported a fourfold increase in livestock methane emissions (31.8 to 131.7 Tg CH4/year) since 1950, driven mainly by cattle, with 2019 levels ~20% higher than FAOSTAT estimates and hotspots in South Asia, South America, and North Africa[31]. Chen et al. examined manure management systems in livestock and poultry farming, finding higher methane emissions in solid compared with liquid systems, due to differences in organic matter, water content, and microbial activity[32]. Overall, existing studies have focused more on agricultural and industrial methane sources, while emissions from waste management remain underexplored. Moreover, most methane accounting frameworks operate at provincial or municipal scales, with limited spatiotemporal integration.
In summary, current methane research spans multiple sub-sectors - including municipal waste, domestic sewage, livestock and poultry farming, and agricultural residues - but most studies examine single-source generation pathways. Previous research typically evaluated waste alongside energy and agriculture under IPCC classifications, without establishing a comprehensive framework that integrates waste generation from various sources into a unified system. This study addresses that gap by investigating methane generation patterns, key drivers, and mitigation potential across waste sources under China's strengthened methane control policies. The findings aim to provide actionable insights for policymakers and recommendations for enhancing waste methane management.
METHODS
Methodological framework
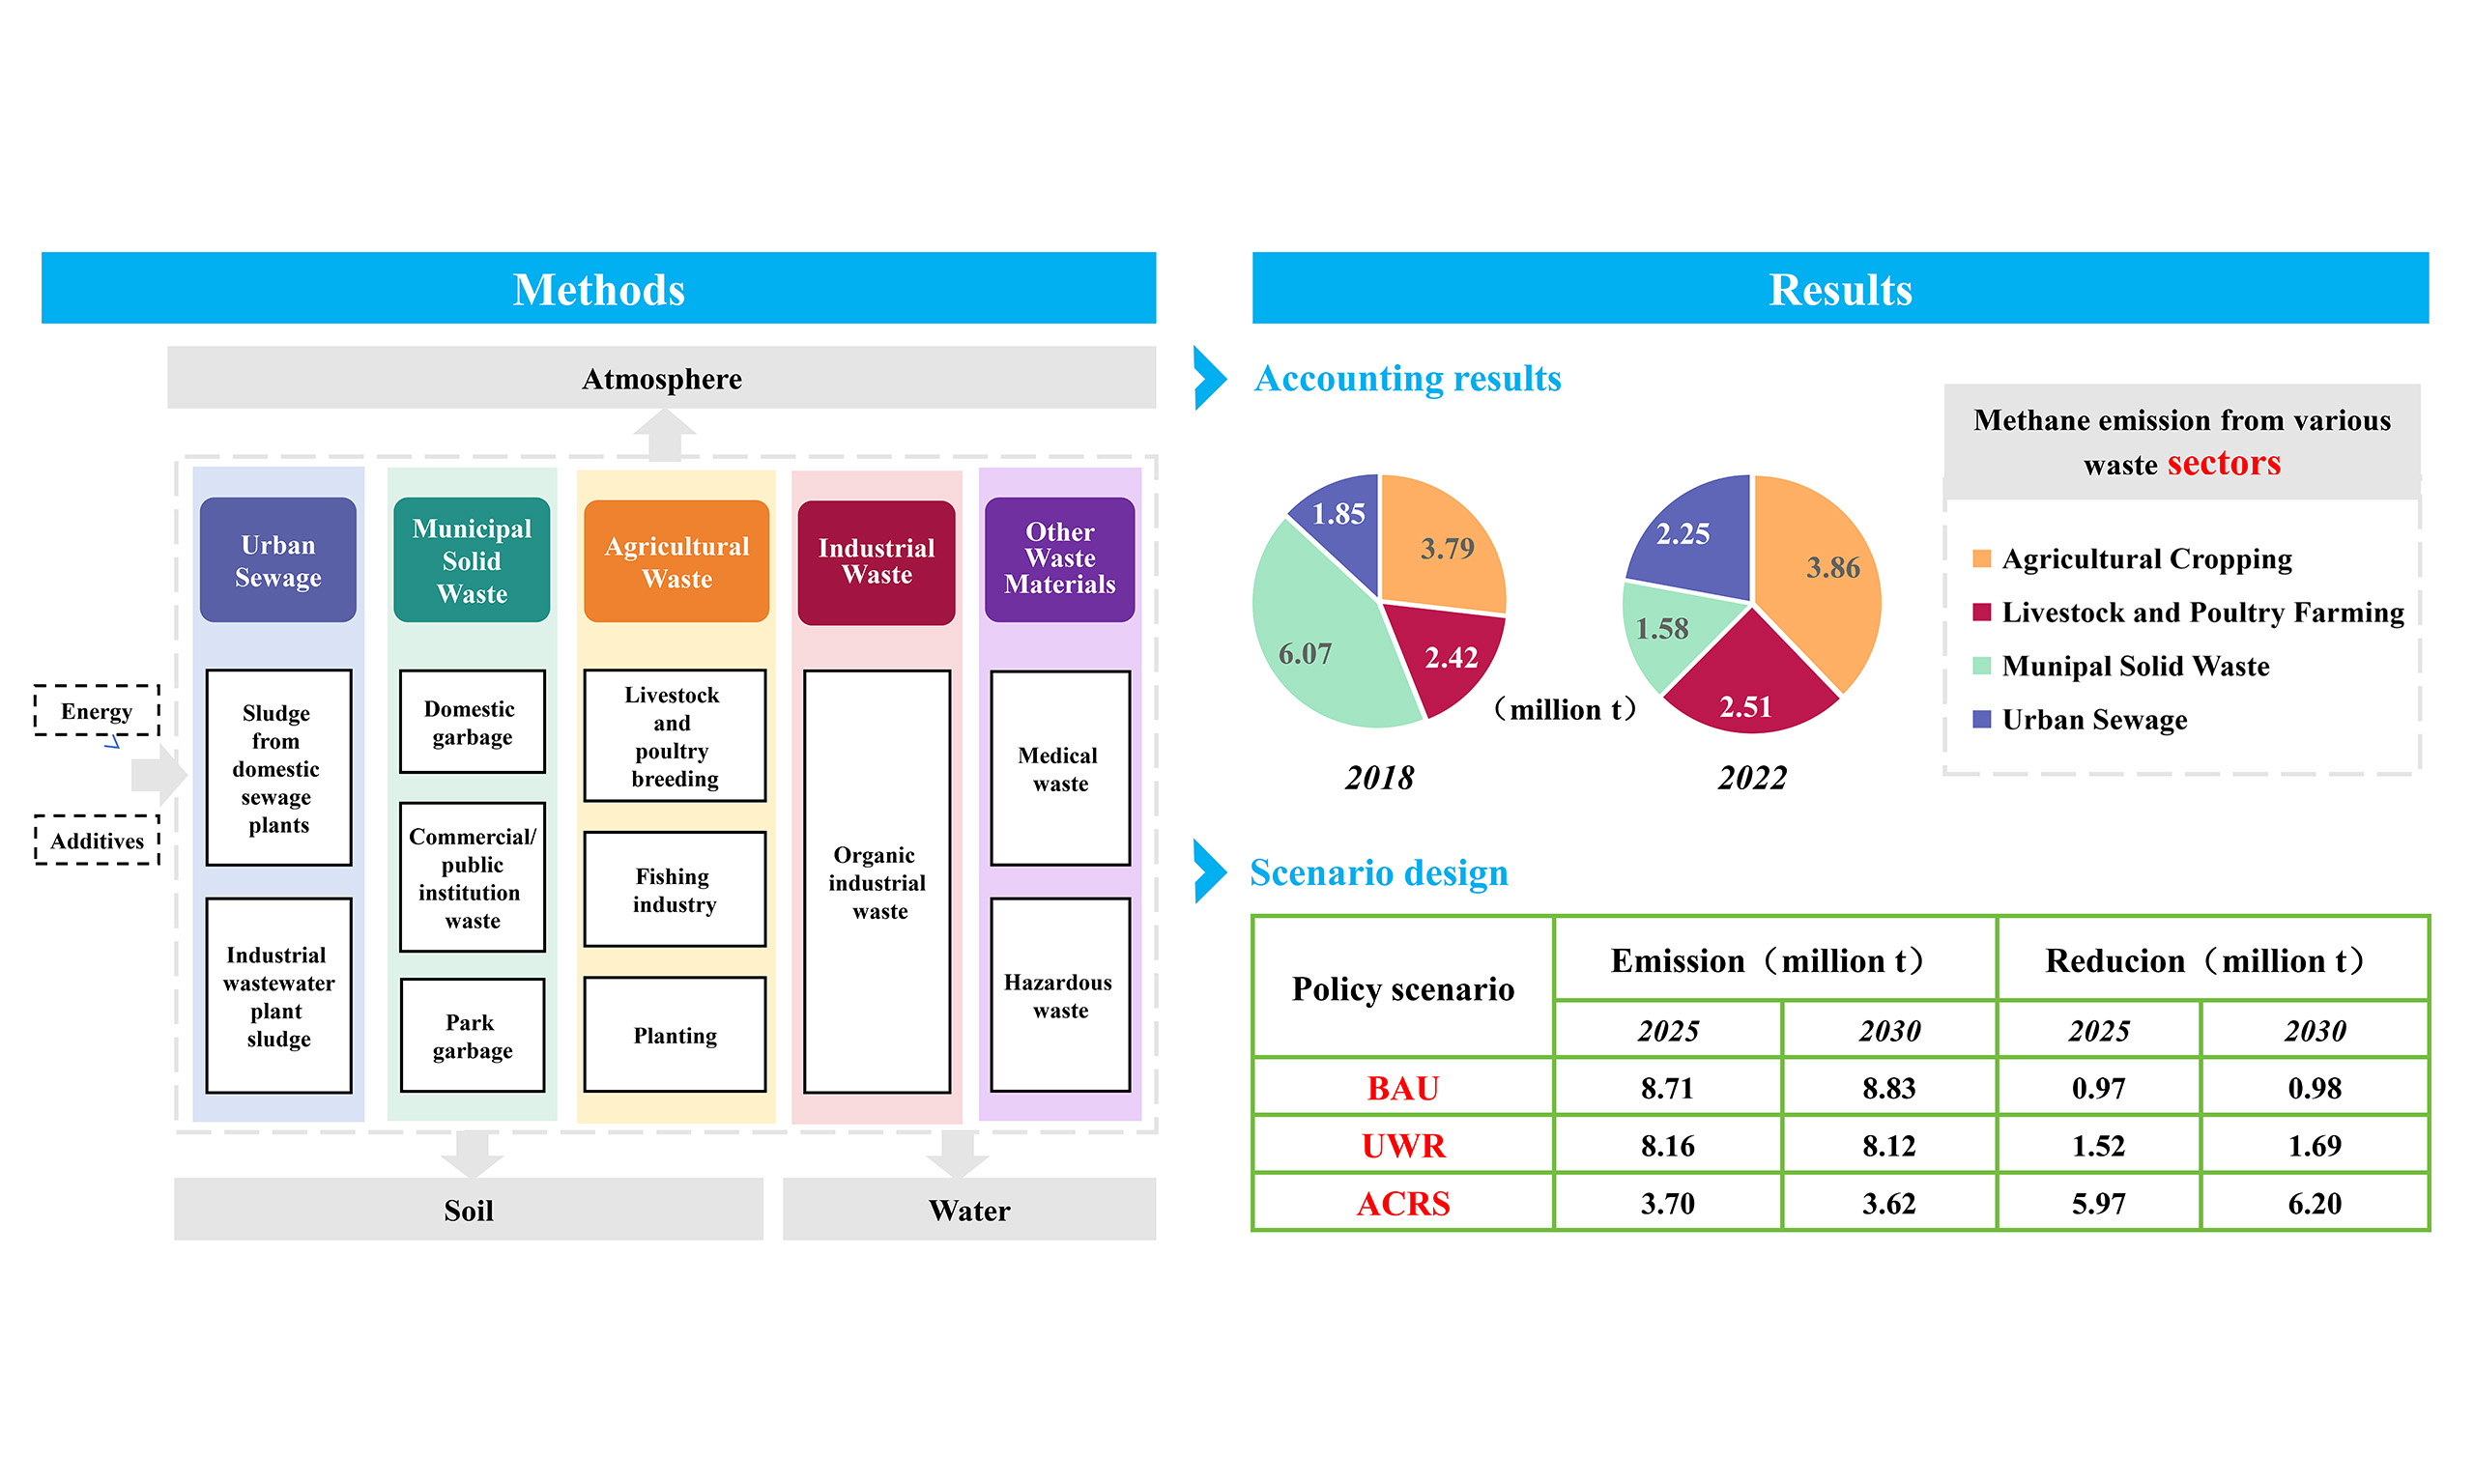
Waste refers to discarded environmental pollutants generated by human activities such as production, construction, and daily life, which are no longer considered usable at a given time and place. According to the IPCC National Greenhouse Gas Emission Inventory, waste can be classified by greenhouse gas emission sources into municipal solid waste (MSW), sludge, industrial waste, and other categories. This study develops a methane emissions accounting framework for waste, structured around five socioeconomic sectors: urban sewage, urban living, agricultural activities, industrial activities, and other activities [Figure 1]. These categories capture the primary activities responsible for waste generation in both urban and rural contexts. The framework is designed to “open the black box” of methane generation from waste, enabling an analysis of the sources, transformations, and pathways of element flows within each sector.
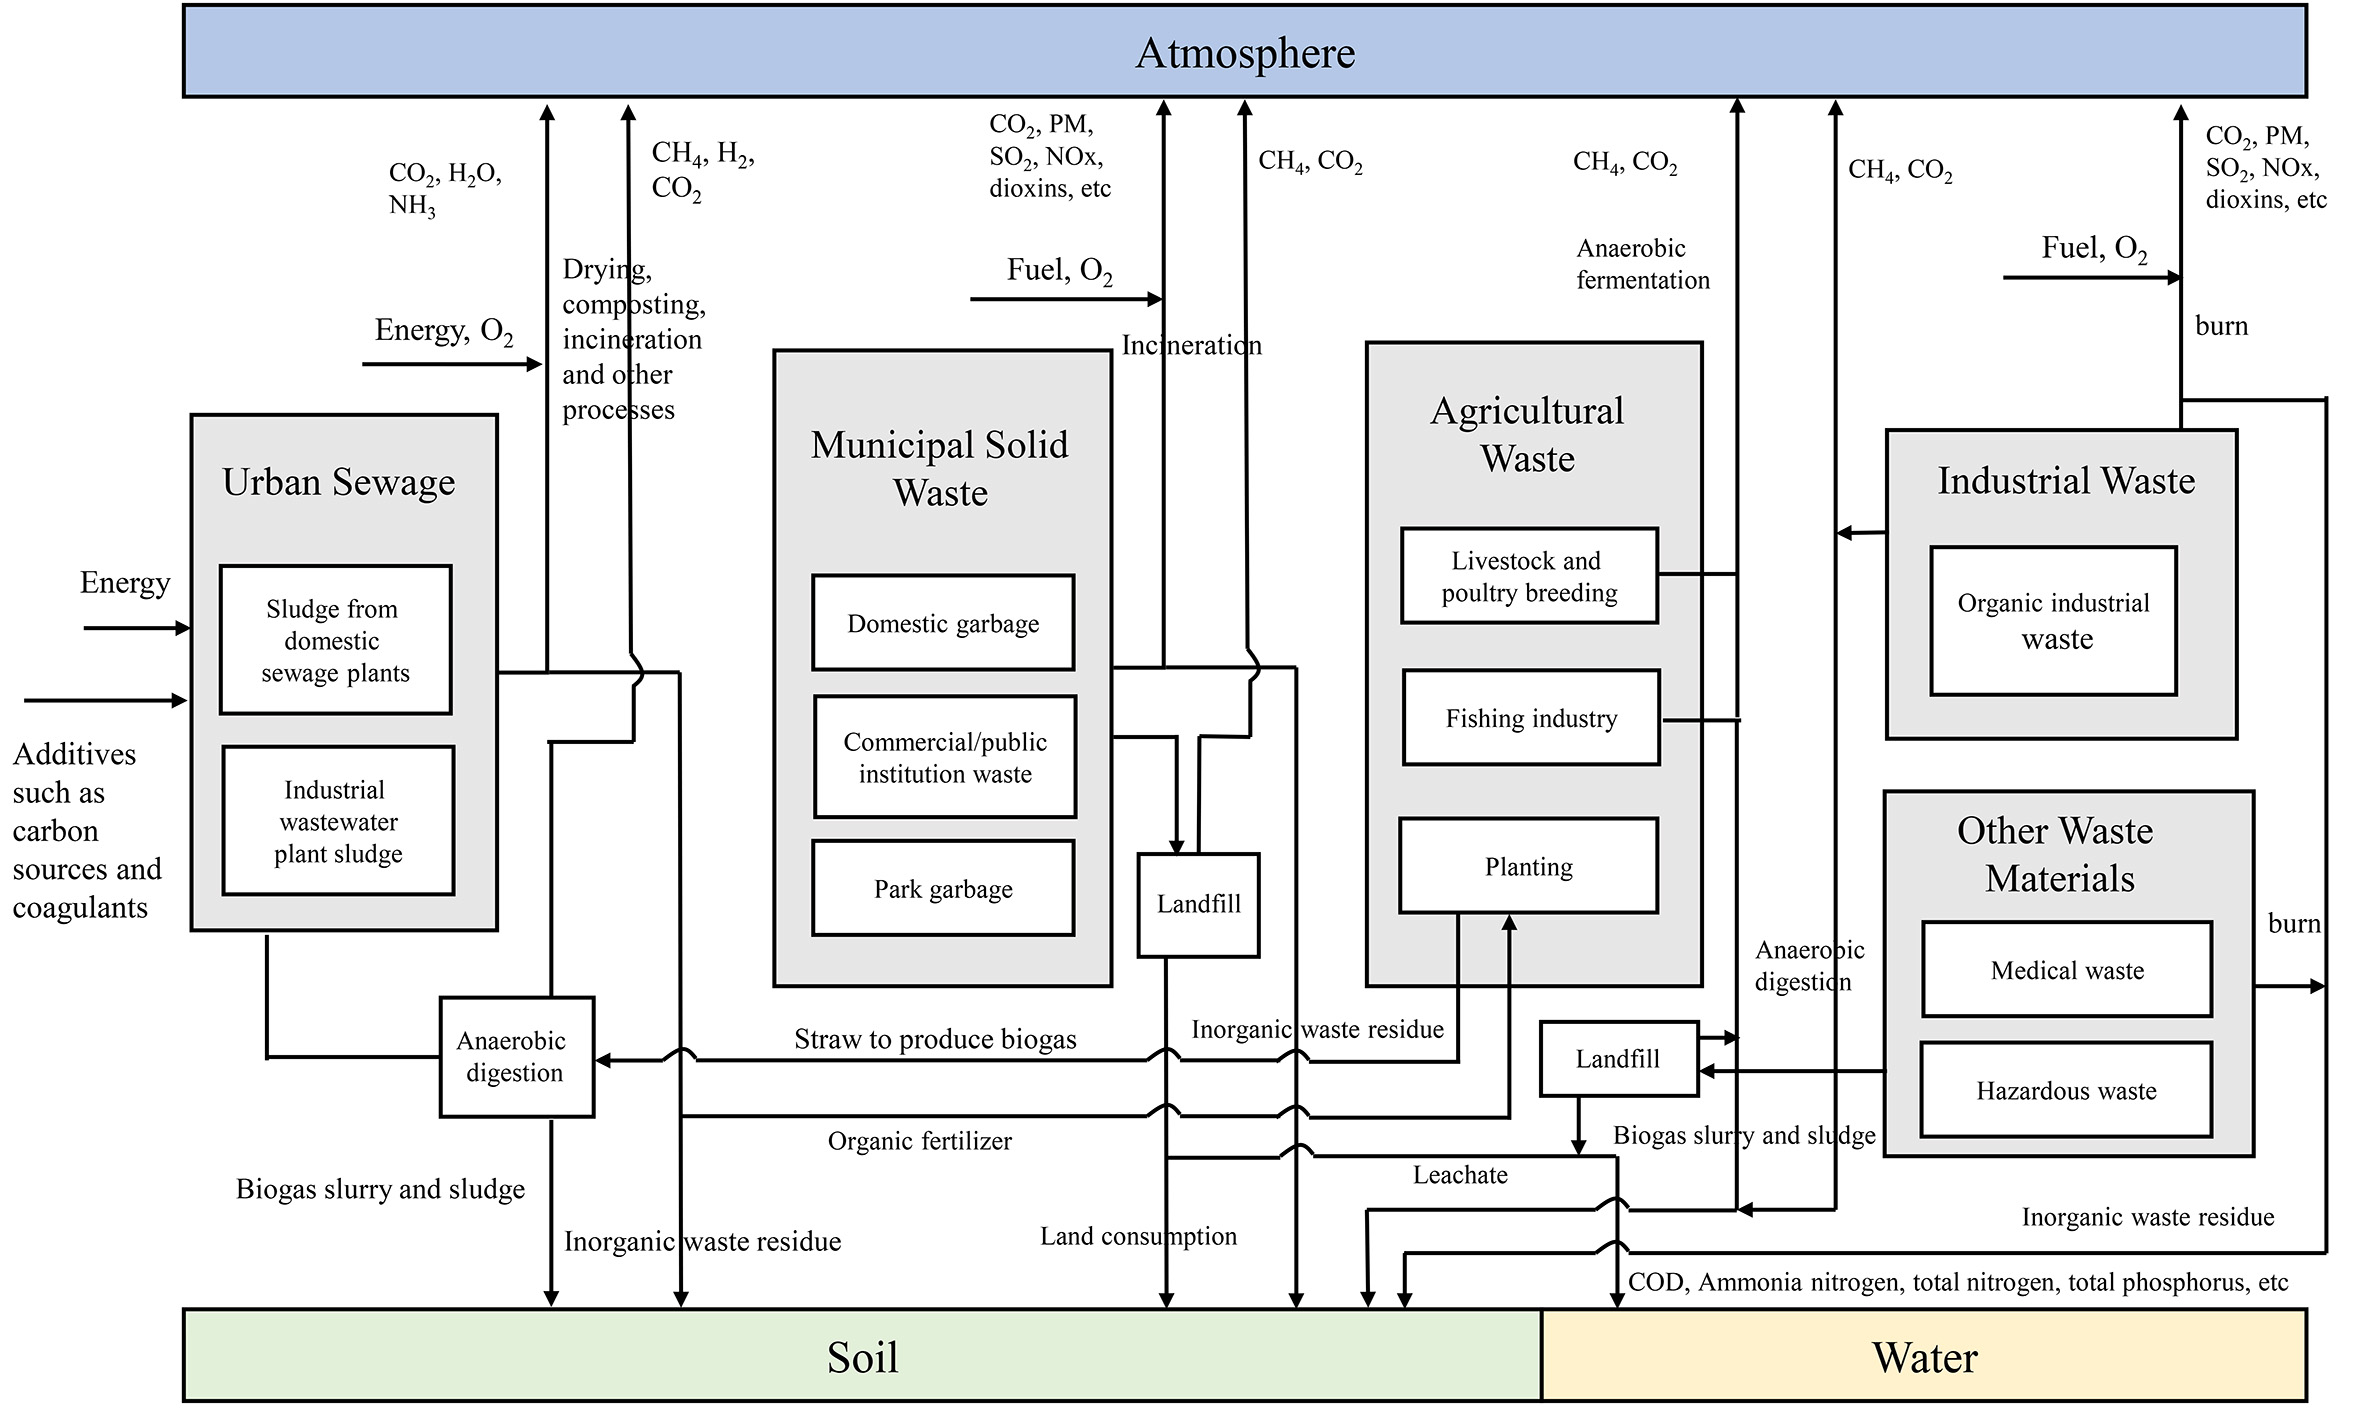
Figure 1. Framework structure of the waste methane emission accounting model.
Methane emissions from waste primarily originate from the decomposition of organic matter through anaerobic processes. The anaerobic conditions in landfills are the dominant source of methane, as organic residues from diverse disposal processes across activity sources enter landfills and decompose. At the subsector level, urban domestic sewage, municipal waste, livestock and poultry manure, crop residues, and organic industrial waste can all generate methane. Industrial waste, however, is generally recycled or properly treated, as enterprises are directly responsible for its management. As a result, methane generation and disposal in the industrial sector occur over relatively short intervals in an efficient and centralized manner. Because industrial waste is rapidly processed after generation, it is not the main focus of this study. In contrast, commercial/institutional waste, park waste, and medical waste typically contribute to methane emissions once deposited in landfills. Accordingly, this study focuses on methane emissions from four sub-sectors: municipal solid waste, urban sewage, agricultural cropping, and livestock and poultry farming.
Data sources
The provincial methane inventory for waste in China was constructed in accordance with the Handbook of Methods and Coefficients for Pollution Emission Calculation in Emission Source Statistical Surveys, the Technical Guidelines for Compilation of Integrated Emission Inventory of Air Pollutants and Greenhouse Gases (Trial), and the Guidelines for Compilation of Provincial Greenhouse Gas Inventory (GCPI)[33]. The accounting data used in this study were mainly retrieved from the China Rural Statistical Yearbook[34], China Urban Construction Yearbook, and China Urban and Rural Construction Yearbook[35], covering the period 2018-2022. Data on the grass-feed ratio and straw utilization rate were drawn from official statistics, policy documents, and research reports issued by the State Council and the Ministry of Agriculture and Rural Affairs of China.
Methane emissions accounting methods for each sector
Municipal solid waste
Urban solid waste, after recycling and landfilling, undergoes processes of adjustment, transition, and acidification, during which methanogenic bacteria generate methane. Part of this methane is subsequently treated through leachate management systems. The LandGEM model, proposed by the U.S. Environmental Protection Agency, is used to estimate landfill gas production[36], as shown in Equation (1):
where QM is the maximum expected landfill gas production (m3/a); i is the year; n = (current year) - (year of initial waste reception); j represents every 0.1 year, with a time step of 0.1 years; k is the methane generation rate, taken as 0.3/a, which falls within the range of 0.1 to 0.5 according to Chinese landfill design standards; L0 is the ultimate methane generation potential (m3/t), taken as 80.352 after 2006 according to Chinese landfill design standards; Mi is the amount of waste buried in the i-th year (t); tij is the age of the j-th portion of waste landfilled in year i;
Because methane from solid waste in the inventory is assumed to be fully released within a year, the formula can be simplified according to GCPI guidelines, as shown in Equation (2):
where
Urban sewage
Domestic sewage is primarily derived from residential sources. Methane emissions are calculated following the GCPI methodology, as shown in Equation (3):
where
Agricultural cropping
In the agricultural cropping sector, methane emissions mainly originate from straw residue, which can be either “returned to the field” or “removed from the field”. According to a 2021 Chinese government report, the off-field utilization rate of straw in China was 33.4%, with five primary applications: feed, fertilizer, base material, fuel, and raw material. Of these, fuel accounted for only 8.9% of off-field use. Off-field straw is typically processed in large-scale anaerobic fermentation reactors. Methane generation efficiency varies with straw type and treatment technologies, such as biochar application, hydrothermal carbon enhancement, calcium peroxide combined with zero-valent iron, pretreatment with fermentation aids, and co-digestion with livestock manure[37-40]. Among crop residues, rice and wheat are the primary contributors to methane generation, with theoretical potentials of 523.21 and 521.36 mL/g, respectively. This study adopts the average value of 522.3 mL/g. The total straw output is estimated using the straw-to-grain ratio, while methane emissions are calculated using the emission factor and pollution coefficient method.
Straw that is returned to the field decomposes naturally through composting, where methanogenic bacteria ferment it anaerobically, releasing methane into the atmosphere. This process resembles aerobic composting but is typically considered part of agricultural planting activities rather than waste management. Consequently, this study does not explicitly account for these emissions. According to the IPCC inventory, the methane emission factor for natural composting of waste is 4 g/kg. In this study, the emission factor for off-field straw utilization was 94 times higher than that for returned straw. A sensitivity analysis of parameter adjustments showed that including emissions from straw returned to the field altered results by 23.9%, a variation considered acceptable; thus, these emissions were excluded from the final estimates.
Livestock and poultry farming
Livestock manure is the main source of methane emissions from livestock and poultry farming, representing the second-largest methane emission pathway in this sector. This study focuses on the major methane-producing livestock in China, including cattle, sheep and goats, pigs, horses, donkeys, and mules. Cattle were further classified into dairy and beef cattle by breed and purpose. According to GCPI, methane generation efficiency from pig, cattle, and sheep manure varies with feeding practices. Therefore, two feeding methods were distinguished: large-scale breeding and free-range farming, based on the prevailing large-scale farming rates. Using methane emission factors for manure management from GCPI and livestock inventories reported in the China Rural Yearbook, methane emissions for different livestock from 2018 to 2022 were estimated. The calculation formula is given in Equation (4):
where
Policy scenario design
China has announced its goal of reaching peak carbon emissions by 2030. As outlined in the national action plan, the government established a medium-term scenario extending to 2025 for methane reduction, and a long-term peak scenario set for 2030. Considering the significant decline in methane emissions from urban waste disposal and the growing share from agricultural sources, this study designs three policy scenarios: Business As Usual (BAU), Urban Waste Recycling (UWR), and Agricultural Carbon Reduction and Sequestration (ACRS) [Table 1]. In the BAU scenario, no additional measures are implemented to enhance methane collection or utilization from waste. Under this assumption, future methane emissions from waste continue along the current trend, with only 10% of methane generated from the four major waste sub-sectors being collected and utilized. The UWR scenario reflects the urban waste recycling policy. Following the implementation of measures outlined in the Methane Emissions Control Action Plan, the national resource utilization rate of municipal solid waste is projected to reach 60% by 2025 and 80% by 2030. In this scenario, the harmless disposal rate of urban sludge will exceed 90% by 2025 and achieve full coverage by 2030, with 50% of sludge treated through anaerobic digestion. In 2019, anaerobic digestion accounted for 12.9% of the total treatment capacity among mainstream sludge treatment processes in China. Looking ahead, policies on urban sludge resource utilization are expected to continue, accompanied by improved waste disposal facilities. Accordingly, it is assumed that under UWR, the share of sludge treated through anaerobic digestion will increase to 50%. The ACRS scenario represents the agricultural carbon reduction and sequestration policy. In this case, enhanced methane reduction measures, such as the resource utilization of crop straw in farmland and the recycling of livestock and poultry waste, will be emphasized. The utilization rate of livestock and poultry waste is expected to exceed 80% by 2025 and 85% by 2030. According to Section "Agricultural cropping", the utilization rate of straw as off-field fuel in China was only 3% in 2021. Under ACRS, it is assumed that this rate will rise to over 15% by 2025 and 20% by 2030.
Policy scenarios for methane emissions control from waste in China
| Scenario | Municipal solid waste | Urban sewage | Agricultural cropping | Livestock and poultry farming |
| Business as usual (BAU) | Current government measures maintained. 10% of the methane generated in the four waste sub-sectors is collected and utilized | |||
| Urban waste recycling policy (UWR) | Methane recovery from landfills reaches 60% by 2025 and 80% by 2030 | Methane utilization from COD in sewage reaches 45% by 2025 and 50% by 2030 | - | - |
| Agricultural carbon reduction and sequestration (ACRS) | - | - | Straw fuel utilization exceeds 15% by 2025 and 20% by 2030 | Utilization of livestock and poultry waste exceeds 80% by 2025 and 85% by 2030 |
RESULTS
Distribution characteristics of methane emissions by waste sector
Figure 2 shows the variations in methane emissions from different waste sectors in China between 2018 and 2022. In 2022, total methane emissions from waste reached 10.2 million tons, representing a 27.8% reduction over the five-year span. Garbage disposal was the primary driver of this decline, accounting for 114.1% of the total reduction. At the subsector level in 2022, agricultural planting, livestock and poultry farming, and wastewater treatment contributed 37.8%, 24.6%, and 22.1% of total emissions, respectively. Over the past five years, despite a substantial 74% decrease in emissions from garbage disposal, the shares of methane emissions from the other three subsectors have steadily risen, with wastewater treatment showing the largest increase at 21.6%. In 2022, methane emissions from agricultural planting waste reached 3.86 million tons, a slight increase compared with 2018. However, its share of total emissions rose from 26.8% in 2018 to 37.8% in 2022. Livestock and poultry farming also remained a significant source of methane emissions. Between 2018 and 2022, emissions from this subsector first declined and then increased, resulting in a cumulative 3.8% rise. Its share of emissions consistently ranged from 17% to 25%. Methane emissions from wastewater treatment reached 2.25 million tons in 2022, marking a 21.7% increase compared with 2018. Its share of total emissions rose steadily each year, from 13.1% in 2018 to 22.1% in 2022, underscoring its growing importance in methane mitigation efforts.
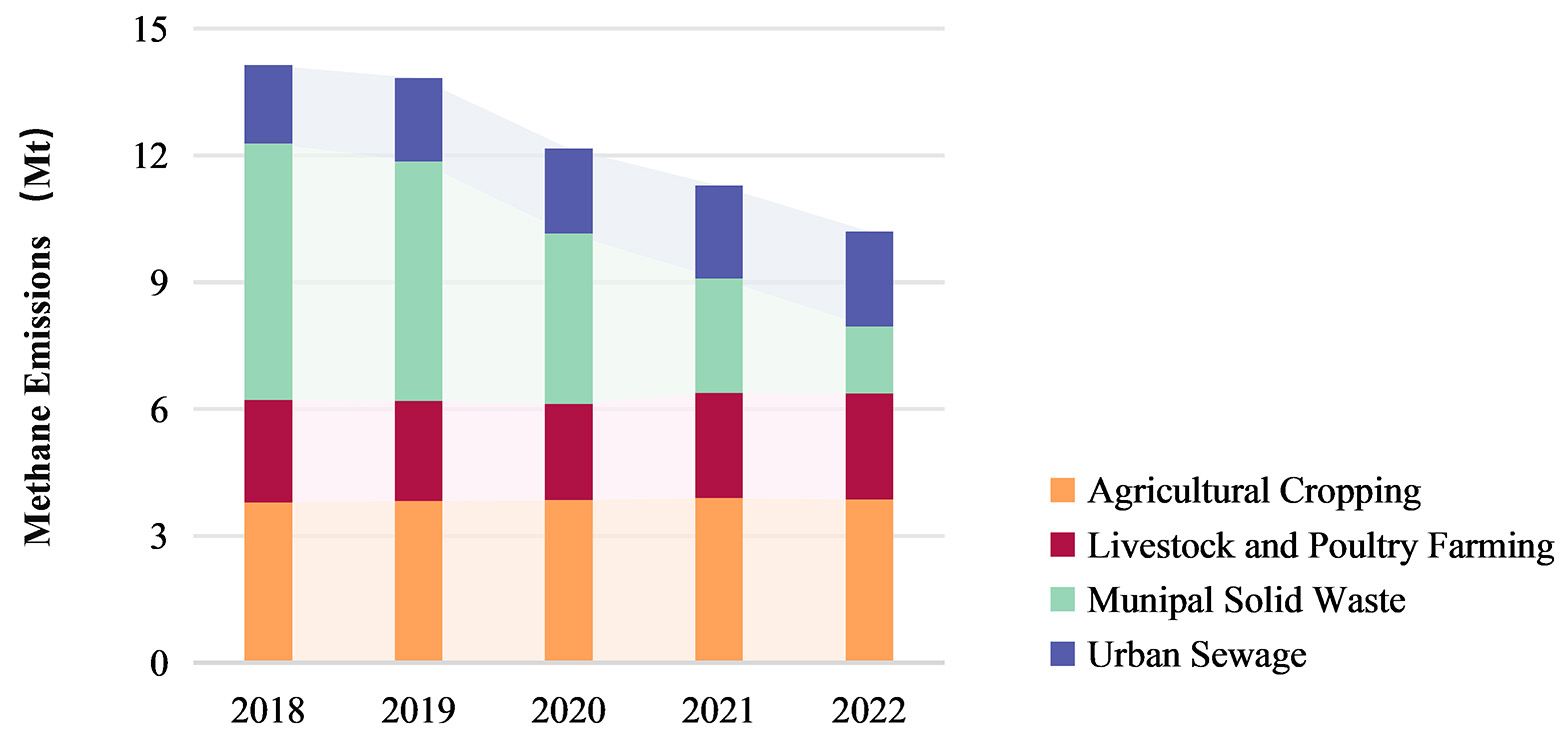
Figure 2. Methane emissions from various waste sectors in China, 2018-2022.
Regional distribution characteristics of total methane emissions from waste
Figure 3 illustrates the regional distribution of methane emissions from waste in China. In 2022, emissions were mainly concentrated in central and southern regions, particularly in provinces along the Yangtze and Yellow River basins. In southern coastal regions, the large scale of livestock farming and high population densities required extensive centralized waste disposal, rendering this area a major national hotspot for methane emissions. The provinces with the highest methane emissions from waste in 2022 were Henan, Shandong, Jiangsu, Hunan, and Guangdong. These provinces either serve as major grain producers (Henan, Shandong, Hunan) or are both populous and economically significant (Guangdong, Jiangsu). Specifically, Henan and Shandong emitted 1.09 and 0.75 million tons of methane from waste in 2022, accounting for 10.7% and 7.3% of national emissions, respectively.
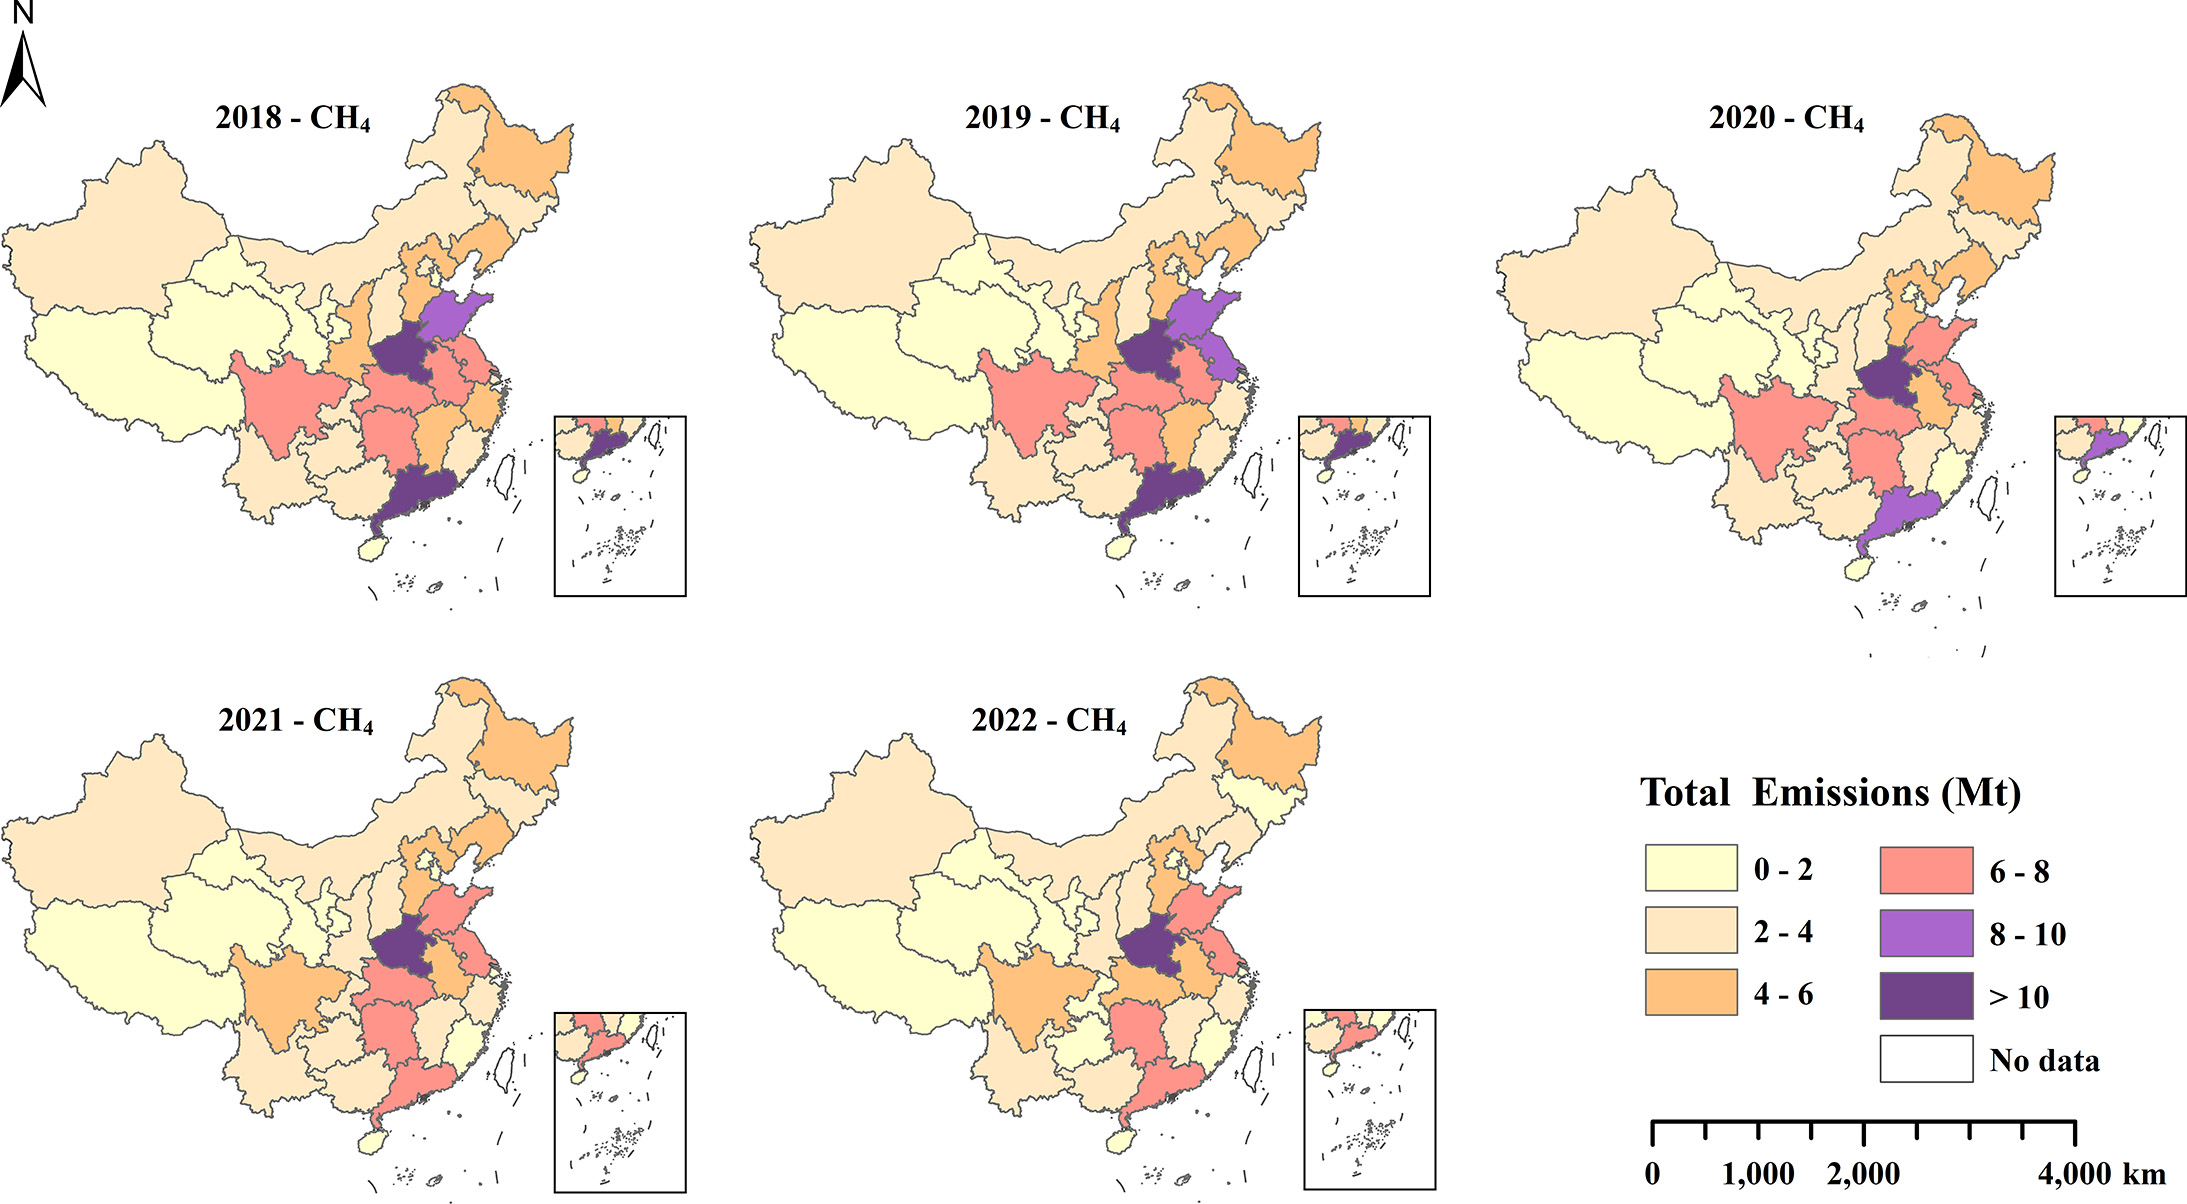
Figure 3. Regional distribution of methane emissions from waste in China, 2018-2022. The map used in the figure is the official map of China [GS(2024) 0650].
Between 2018 and 2022, the regions with the highest emissions shifted from eastern and southern coastal areas to central inland provinces. Coastal provinces generally experienced sharper emission declines than western and northeastern regions. This trend is largely explained by reduced agricultural land due to industrialization along the coast, as well as more advanced waste disposal infrastructure in coastal areas.
During this period, methane emissions from waste declined markedly in most provinces. Shanghai, Beijing, and Guangdong saw reductions of 67.4%, 58.7%, and 52.8%, respectively, largely due to shrinking agricultural activities driven by urbanization. Coastal provinces such as Hainan, Zhejiang, Tianjin, Liaoning, and Fujian also recorded sharp decreases - 50.8%, 48.9%, 46.6%, 40.4%, and 38.2%, respectively - placing them among the top ten in emission reduction rates. In contrast, Tibet and Qinghai experienced increases of 19.2% and 12.6%, making them the only provinces where methane emissions from waste rose.
From a sectoral perspective [Figure 4], methane emissions from livestock and poultry waste were concentrated in central and southwestern regions, including Henan, Hunan, Sichuan, Shandong, and Hubei. Over the past five years, total emissions from these provinces rose only marginally by 0.4%, remaining essentially stable. Methane emissions from agricultural planting waste were concentrated in central and eastern coastal provinces and the northeast, including Henan, Jiangsu, Anhui, Shandong, and Heilongjiang, with total emissions rising by 3.3% between 2018 and 2022. In 2018, emissions from garbage disposal were primarily concentrated in Guangdong, Henan, and Hunan. By 2022, these provinces had reduced such emissions by 77.9%, largely due to significant declines in sanitary landfill use. Conversely, methane emissions from sewage treatment increased across major provinces, particularly in coastal regions such as Guangdong, Jiangsu, and Shandong. This growth is attributed to China's recent initiatives to upgrade drainage networks, which have markedly improved sewage collection and treatment rates in densely populated areas.
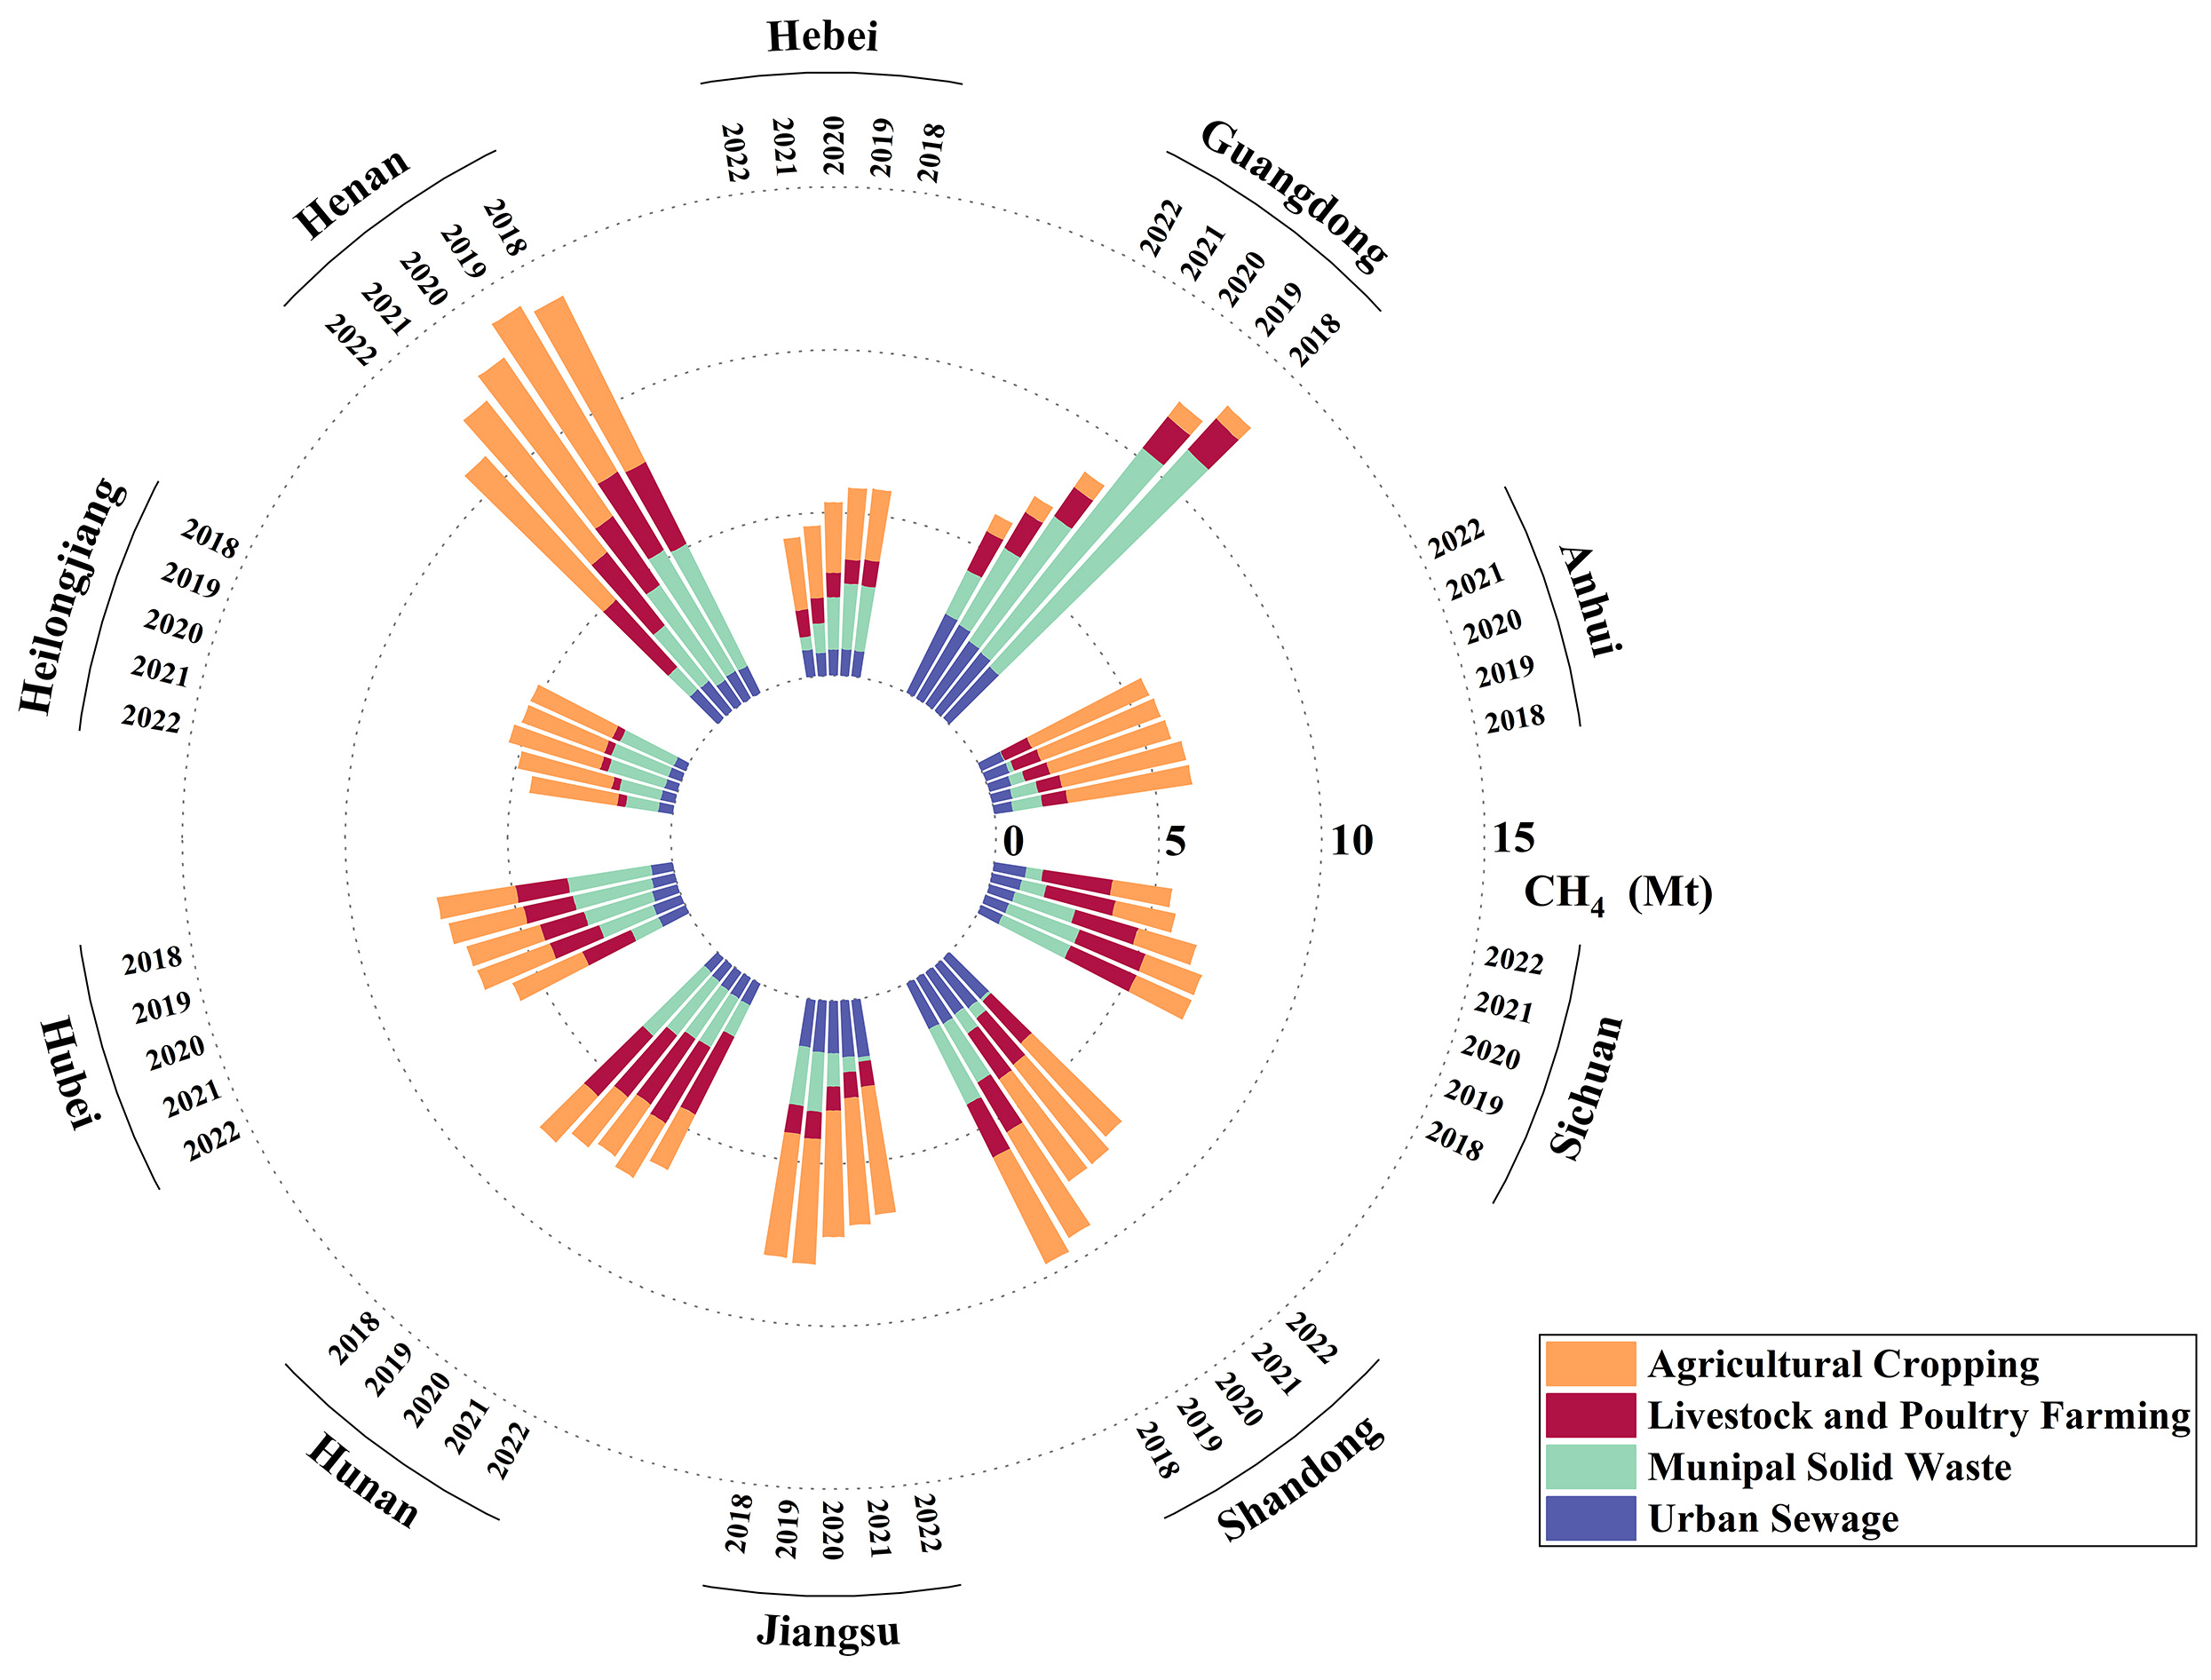
Figure 4. Regional distribution of methane emissions from various waste sectors in China, 2018-2022.
Analysis of methane emissions reduction potential under policy scenarios
Based on the estimated growth rates of methane emissions from four waste sub-sectors between 2018 and 2022, China's total methane emissions from waste are projected to follow a trend of initial decline followed by an increase between 2025 and 2030, reaching their lowest point in 2025 [Figure 5]. Specifically, total emissions are expected to reach 9.7 million tons in 2025 and 10.2 million tons in 2035. Under the Business As Usual (BAU) scenario, only 10% of methane emissions from waste will be recycled. Consequently, the medium-term decline and subsequent long-term increase in methane emissions from waste will continue without significant mitigation. Between 2025 and 2030, reductions under the BAU scenario are negligible, fluctuating between 0.97 and 0.99 million tons.
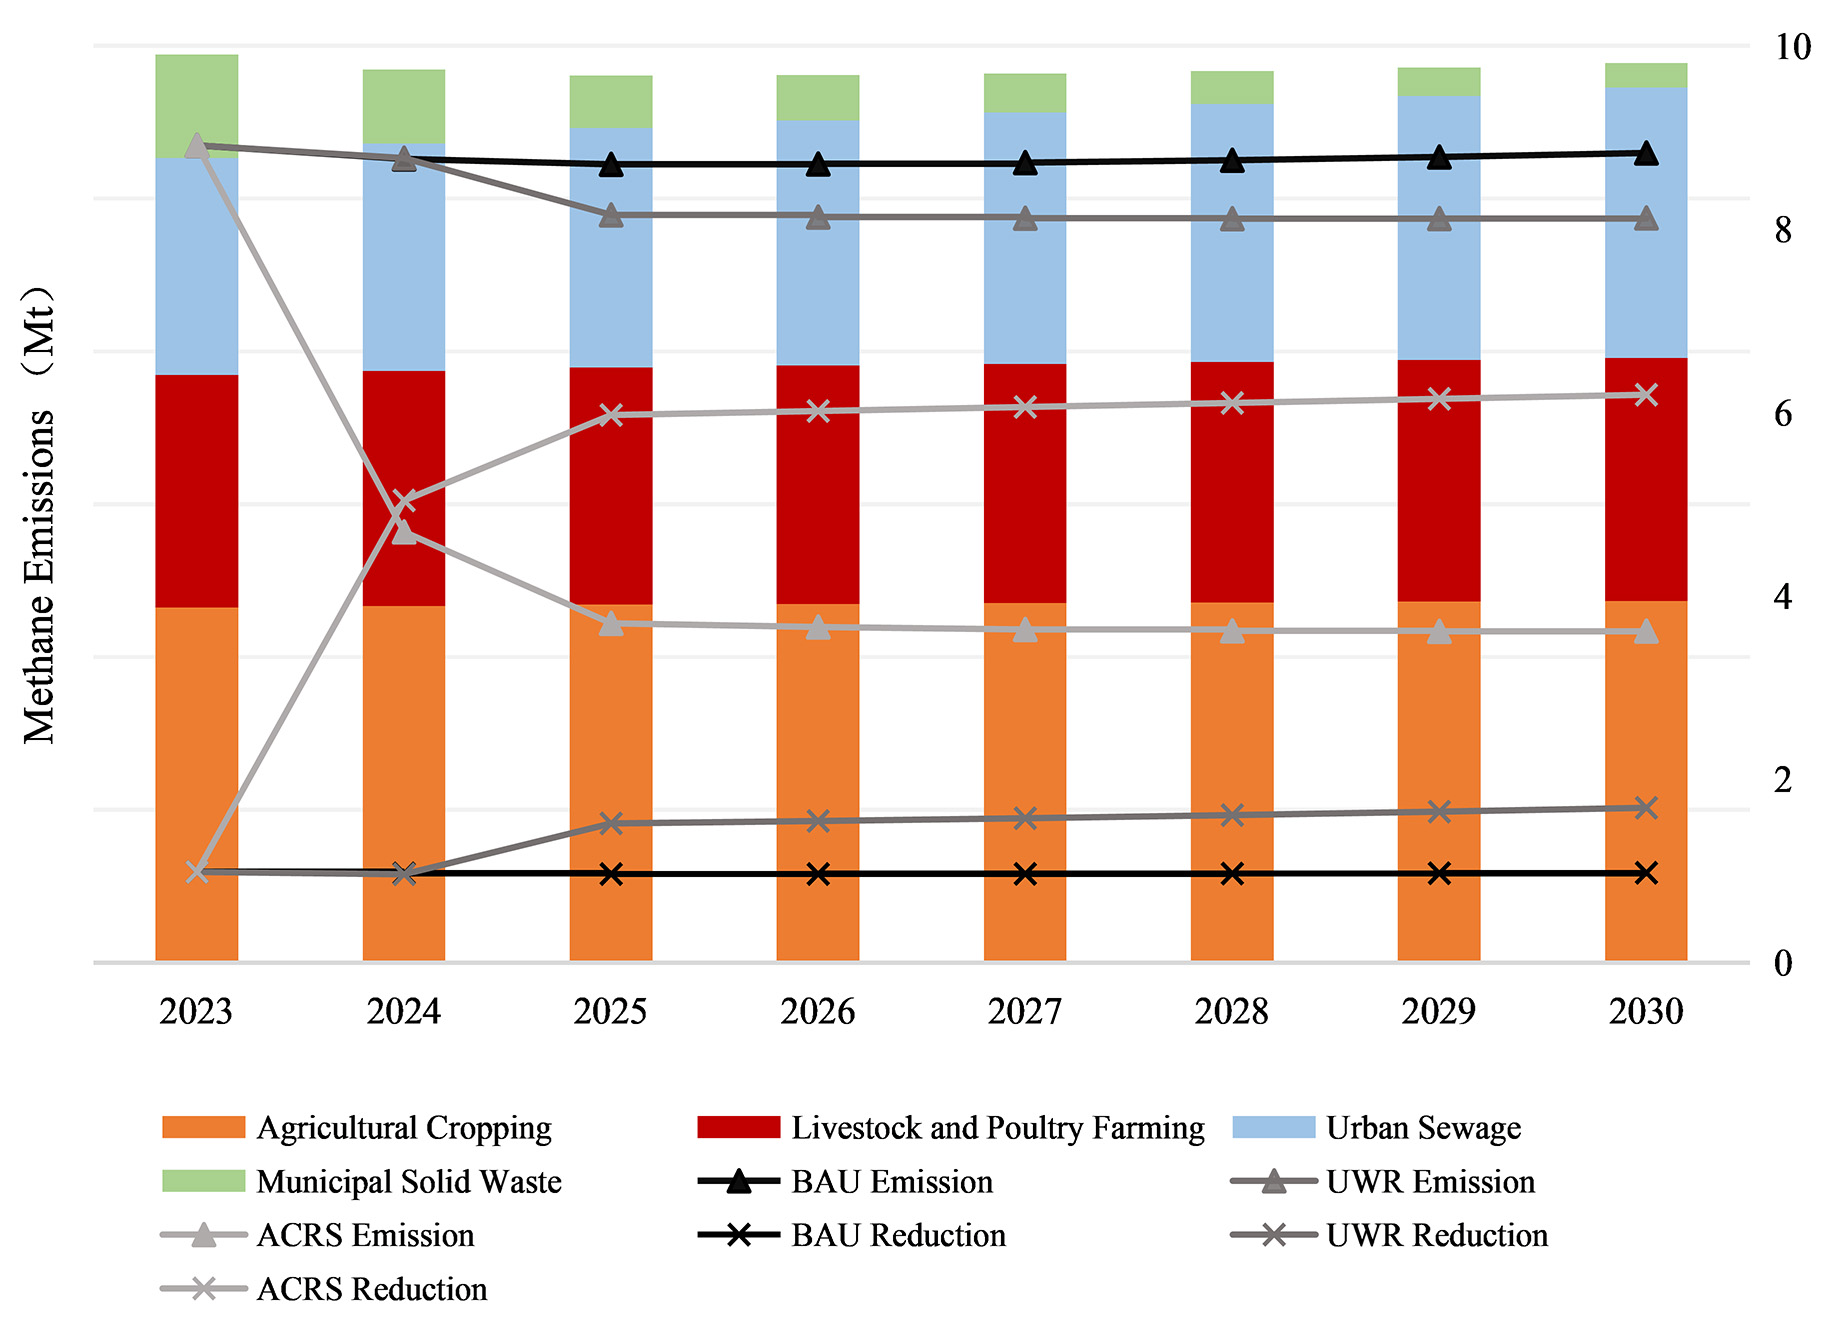
Figure 5. Trends in methane emissions from waste in China and emission reduction analysis under policy scenarios.
Under the Urban Waste Resource Utilization (UWR) policy scenario, methane generated from the garbage and sewage treatment sub-sectors can be more effectively recovered and utilized. By enhancing methane recovery from municipal solid waste and sewage, the UWR scenario could reduce emissions by 1.52 million tons in 2025, equivalent to 15.7% of that year’s total emissions. With increasingly ambitious policy targets, annual reductions under the UWR scenario are projected to rise, reaching 1.69 million tons by 2030.
Under the Agricultural Crop Residue Utilization (ACRS) scenario, methane emissions from crop residues are mitigated through large-scale fermentation systems designed to achieve near-zero emissions, while fugitive emissions from livestock manure are effectively controlled. By 2025, the ACRS scenario could achieve a reduction of 5.97 million tons, accounting for 61.7% of total emissions in that year, increasing to 6.19 million tons by 2030. Overall, methane emissions from waste can be mitigated under all three policy scenarios, with the ACRS scenario yielding the greatest benefits. In 2025, reductions under ACRS are 6.2 times higher than those under BAU and 3.9 times higher than those under UWR, primarily due to the energy utilization of straw and the improved management of livestock manure. As China's Methane Emissions Control Action Plan sets a quantitative reduction target for 2025, the benefits of waste-related emission reductions are concentrated around that year, while long-term impacts remain limited. Moving forward, greater attention should be paid to controlling methane emissions in the agricultural and urban sewage sectors. Efforts should focus on enhancing the recycling of crop residues and manure, as well as improving the operation management of anaerobic treatment facilities for urban sewage, to minimize fugitive methane emissions.
DISCUSSION AND POLICY IMPLICATIONS
Comparison with other studies
This study adopts the IPCC inventory method to categorize methane emissions from waste in China into four sub-sectors: urban waste, urban sewage, agricultural cultivation, and livestock and poultry farming.
Wang et al. estimated that total methane emissions in China, based on the IPCC method, would reach
Comparison with other studies
| No. | Author | Sector | Parameters | System boundary | Main conclusion | This study |
| 1 | Cai et al., 2018[42] | Waste disposal | Reaction constants ki and methane production ratios derived from FOD model parameters; waste composition based on regional averages | Direct emissions from landfills included; upstream processes (e.g., waste collection/transport) excluded | Methane emissions from landfills in China were 1.48 million tons in 2012. Compared with the BAU scenario in 2030, two mitigation scenarios were projected to reduce emissions by 0.60 and 0.97 million tons, respectively[42] | Methane emissions from waste disposal in China were estimated at 2.43 million tons in 2018 and projected to decline to 0.11 million tons by 2030. By 2030, the BAU, UWR, and ACRS scenarios are expected to reduce methane emissions by 0.98~6.19 million tons |
| 2 | Zhao et al., 2019[46] | Sewage treatment | Emission factors from IPCC Guidelines | Direct methane emissions from sewage treatment processes (anaerobic/aerobic systems) | Total methane emissions from municipal sewage treatment plants in 229 Chinese prefecture-level cities reached 1.17 million tons in 2014, three times higher than the emissions from similar plants in the United States in 2016[46] | Assuming 10% methane collection, methane emissions from sewage treatment in China were estimated at 1.67 million tons in 2018 |
| 3 | Zhao et al., 2024[47] | Livestock and poultry manure | Emission factors from IPCC (2006) Tier 1 & Tier 2 guidelines; manure management system proportions based on provincial data | Methane emissions from rice cultivation and five livestock categories (cattle, sheep, swine, poultry) via enteric fermentation and manure management | From 2010 to 2019, total methane emissions from China’s agricultural sector decreased from 24.27 to 22.17 million tons. Methane emissions from livestock and poultry manure decreased by 4.00 million tons between 2010 and 2016[47] | Total methane emissions from livestock and poultry manure in China increased from 2.04 million tons in 2018 to 2.26 million tons in 2022 |
| 4 | Xu et al., 2024[26] | Livestock manure | Emission factors from IPCC (2006) Tier 1, China’s Provincial GHG Inventory Guidelines, and other literature | Methane emissions from enteric fermentation and manure management | Methane emissions from China's livestock industry decreased from 13.85 million tons in 2001 to 11.82 million tons in 2021. Methane emissions from manure management increased from 1.76 to 1.92 million tons over the same period, with an average annual emission of 1.95 million tons[26] | Assuming 10% methane collection, methane emissions from livestock manure in China were estimated at 2.24 million tons in 2021 |
| 5 | Wang et al., 2021[50] | Livestock management, straw burning, waste disposal | Localized parameters from China’s Provincial GHG Inventory Guidelines; straw-to-grain ratios and straw burning rates from NDRC data | Methane emissions from rice cultivation, livestock enteric fermentation/manure management, and waste treatment | Regions with high methane emissions from livestock management are primarily located in western China, while regions with high emissions from waste disposal are concentrated in large cities such as municipalities and provincial capitals[50] | The provinces with the highest methane emissions from livestock and poultry farming are Henan, Hunan, and Sichuan. Methane emissions from waste disposal are concentrated in populous provinces such as Guangdong and Henan |
| 6 | Lu et al., 2024[51] | Waste disposal, sewage treatment, manure management | Locally measured data in Shandong Province prioritized; supplemented with literature data | All methane sources in Shandong Province, including energy activities, agricultural activities, waste treatment, and natural sources | Total methane emissions in Shandong Province in 2020 were 1.71 million tons[51] | From 2018 to 2022, total methane emissions from waste in Shandong Province declined from 0.96 to 0.74 million tons |
Overall, the methane emission estimates from the four waste sub-sectors in this study fall within a reasonable range compared to the existing literature. Differences in emission trends largely stem from variations in policy implementation, data accuracy, and system boundary definitions. As public awareness of waste-related methane emissions and their economic implications grows, significant reductions could be achieved under low-carbon development and related policy scenarios, as noted by Cai et al.[42]. Moreover, methane emissions from waste are strongly correlated with urban population density and agricultural activity intensity, with high-emission regions concentrated in densely populated urban centers and areas of intensive agriculture, consistent with findings by Wang et al.[50] and Lu et al.[51].
Uncertainty analysis
The uncertainty in the results of this study primarily arises from data collection methods, the costs of methane capture technologies, and the extent of policy enforcement. The methane emission factors for the four sub-sectors analyzed are largely derived from IPCC inventories and relevant literature. These factors may deviate from actual measurements, potentially leading to variations in the results. Moreover, substantial differences in emission factors may exist among neighboring provinces. For example, in Hunan and Guizhou, variations in terrain and farming practices result in differing methane emission factors for agricultural cultivation and livestock farming. Such regional discrepancies can affect the spatial distribution patterns of emission reductions. Currently, methane capture technologies for landfills are relatively mature. However, technologies for capturing methane from urban sewage and agricultural waste have not yet been widely adopted. The high costs of these technologies may delay policy implementation, thereby introducing considerable uncertainty into quantitative assessments of policy benefits.
Limitations
This study integrates methane emissions from waste systems into a unified framework, focusing on the emission characteristics and trends across four sub-areas linked to urban and agricultural activities. However, beyond these four sub-areas, methane-producing waste also includes organic matter from industrial production, kitchen waste from households, and garden waste. The potential for methane emissions from these sources depends on technological pathways, treatment processes, and treatment capacities, which may vary regionally. For instance, processes such as direct incineration of garden waste or converting kitchen waste into feedstock through drying and oil refining do not produce methane. Due to the complexity of these scenarios, they were not included in this study. In addition, this study accounts for methane emissions from agricultural straw only when used as fuel, while excluding its use as a soil amendment. By contrast, most other studies emphasize methane emissions from rice paddies and the utilization of straw as a soil amendment. Such discrepancies in scope may introduce potential biases, which should be acknowledged in future research.
The study also relies heavily on government reports and statistical yearbooks for activity data. Due to incomplete local guidelines, reference standards are mainly derived from zonal calculations based on national-level standards. This approach can lead to significant parameter discrepancies among neighboring provinces in different zones, thereby introducing uncertainty into the results. It should also be noted that the analysis is limited to methane emissions from non-industrial waste sources. Methane emissions from agricultural straw are estimated only for energy use and exclude emissions from the natural decay of straw returned to fields, which cannot be systematically monitored across regions. This omission may cause deviations from actual emission levels. Similarly, methane from small-scale livestock manure is excluded, with the analysis limited to emissions from livestock and poultry breeding. In the municipal solid waste sector, only methane emissions from landfilling are considered, while emissions from other treatment processes are not quantified. Consequently, variations in parameter values may result in discrepancies between the total methane estimates in this study and those reported in other domestic or international inventories, as well as those derived from atmospheric inversion data (see Section "Comparison with other studies").
Policy implications and insights
Methane emissions from waste disposal in China have declined significantly over the past five years, largely due to the "Waste-Free City" initiative and the expansion of waste incineration facilities nationwide. These measures have substantially reduced landfill volumes in both urban and rural areas. In 2018, China launched the waste-free city initiative, urging regions to minimize landfill use. The following year, a waste-sorting campaign was implemented, accompanied by a series of action plans aimed at reducing waste and improving resource utilization. Together, these policies have driven a nearly three-quarters reduction in landfill volumes over the past five years, with methane emissions from waste disposal falling accordingly from 42.9% to 15.5%. Looking ahead, as waste incineration capacity continues to expand, methane emissions from waste disposal are expected to decline further. By contrast, methane emissions from agricultural planting waste have exhibited a slight increase, reflecting the stability of China's agricultural structure and straw production. Despite the enforcement of bans on open straw burning since 2018 and the return of much agricultural waste to fields for reuse, this source of methane emissions remains outside the scope of the present study. Off-field utilization of straw for fuel is still limited, as it depends heavily on technological advances and policy support, and has been promoted only in select regions. Nevertheless, over the past five years, emissions from agricultural planting waste have overtaken those from other sources, making it the leading contributor to methane emissions. This shift highlights the agricultural sub-sector as a priority for future methane mitigation. Livestock manure is now the second-largest source of methane emissions from waste. With rising consumption of meat, eggs, and dairy products, the numbers of beef and dairy cattle have increased by 27.7% and 7.4%, respectively, over the past five years. Methane generation from manure is closely tied to livestock populations. However, large-scale pig farming in China remains relatively limited, with much of the production carried out by households, cooperatives, or small and medium-sized farms. As a result, the collection and utilization of methane from manure remain inadequate, posing an ongoing challenge for methane reduction. Methane emissions from sewage treatment systems have grown most rapidly, driven by improvements in urban drainage systems that have greatly expanded sewage collection and treatment capacity. The sewage treatment considered in this study refers primarily to municipal sewage, with methane emissions arising mainly under anaerobic conditions in pipelines and sludge treatment. Thus, the potential for methane generation from sewage depends largely on COD emissions from domestic water use. In the future, as sewage treatment facilities continue to expand in both urban and rural areas, the volume of sewage collected and treated will increase, further unlocking the potential for methane emissions.
Although the inflow of new landfill waste is declining, existing landfills remain a major source of methane emissions and will continue to require strong policy attention over the next five years. Meanwhile, methane emissions from urban wastewater treatment are increasing annually. However, with China accelerating its policies on wastewater treatment and resource recovery, wastewater - particularly industrial wastewater - offers significant potential for methane utilization. To accelerate methane capture and use, government departments could consider introducing additional economic instruments, such as preferential pricing or tax exemptions. Since agricultural planting and livestock farming are now the dominant and growing sources of methane emissions, the agricultural sector should be encouraged to develop efficient methane treatment and utilization technologies, such as high-solid anaerobic digestion and advanced purification systems. Stronger regulation and oversight of large-scale livestock farms are also needed to improve manure collection and treatment. At the same time, active investment in research and development of methane control technologies for rice paddies will be important to reduce off-field emissions.
From a regional perspective, methane emissions are concentrated in agricultural zones and densely populated areas. Therefore, incorporating waste management and methane reduction measures into regional strategies - such as high-quality development in the Yellow River Basin and green development in the Yangtze River Economic Belt - would be highly beneficial. In addition, large-scale, centralized solid waste disposal centers should be established near megacities[52]. These facilities could serve as integrated platforms for managing municipal solid waste, sewage, agricultural residues, and livestock manure, enabling large-scale methane reduction and centralized resource utilization. Such initiatives would provide robust support for China's proactive efforts to address climate change and control non-CO2 gas emissions.
CONCLUSION
This study developed a methane emissions accounting model covering the main sources of waste generation in both urban and rural settings and conducted a quantitative analysis of methane emissions from waste sectors and regions in China between 2018 and 2022. By incorporating China's key methane control policies and actions, three scenarios were designed to evaluate the potential for emission reductions between 2025 and 2030. The results show that total methane emissions from waste in China declined by 27.8% in 2022 compared with 2018, with urban waste contributing most to this reduction. However, emissions from agricultural waste, particularly livestock and poultry farming, remain substantial and cannot be ignored. Methane emissions are mainly concentrated in densely populated regions and areas with intensive agricultural activity, especially along the Yangtze River and Yellow River economic corridors. Policies on agricultural emission reduction and carbon sequestration have made the greatest contribution to waste-related methane reductions, and future initiatives in this area should be strengthened. Overall, this study provides new insights into the sources, pathways, and future trends of methane emissions in the waste sector, offering evidence-based guidance for governments to design effective control strategies, maximize mitigation benefits, and minimize greenhouse gas abatement costs.
DECLARATIONS
Authors’ contributions
Methodology, data collection and analysis, writing - original draft: Shang, H.
Conceptualization, writing - review & editing, project administration, supervision, funding acquisition: Meng, F.
Methodology, data collection, writing - review & editing: Hou, J.
Data collection, writing - original draft: Song, Z.
Writing - review & editing: Zhang, X.
Conceptualization, writing - review & editing: Huang, D.
Availability of data and materials
Data in this study are available from the corresponding author upon reasonable request.
Financial support and sponsorship
This work was financially supported by the National Natural Science Foundation of China [72522012, 72174028] and the National Social Science Fund of China (No. 20BJY086).
Conflicts of interest
All authors declared that there are no conflicts of interest.
Ethical approval and consent to participate
Not applicable.
Consent for publication
Not applicable.
Copyright
© The Author(s) 2025.
REFERENCES
1. International Energy Agency. Global methane tracker 2025; IEA: Paris, France, 2025; p 16. Available from: https://www.iea.org/reports/global-methane-tracker-2025 [Last accessed on 19 Sep 2025].
2. Stavert, A. R.; Saunois, M.; Canadell, J. G.; et al. Regional trends and drivers of the global methane budget. Glob. Chang. Biol. 2022, 28, 182-200.
3. Kirschke, S.; Bousquet, P.; Ciais, P.; et al. Three decades of global methane sources and sinks. Nature. Geosci. 2013, 6, 813-23.
4. Petrescu, A. M. R.; Peters, G. P.; Engelen, R.; et al. Comparison of observation- and inventory-based methane emissions for eight large global emitters. Earth. Syst. Sci. Data. 2024, 16, 4325-50.
5. Poulter, B.; Murray‐tortarolo, G.; Hayes, D. J.; et al. The North American greenhouse gas budget: emissions, removals, and integration for CO2, CH4, and N2O (2010-2019): results from the second regional carbon cycle assessment and processes study (RECCAP2). Global. Biogeochem. Cycles. 2025, 39, e2024GB008310.
6. Hemati, M.; Mahdianpari, M.; Nassar, R.; Shiri, H.; Mohammadimanesh, F. Urban methane emission monitoring across North America using TROPOMI data: an analytical inversion approach. Sci. Rep. 2024, 14, 9041.
7. Hoy, Z. X.; Woon, K. S.; Chin, W. C.; Van, Fan. Y.; Yoo, S. J. Curbing global solid waste emissions toward net-zero warming futures. Science 2023, 382, 797-800.
8. International Energy Agency. Methane tracker - data tools; 2023. Available from: https://www.iea.org/data-and-statistics/data-tools/methane-tracker [Last accessed on 19 Sep 2025].
9. Yang, R.; Feng, X.; Wang, M.; Li, L. Analysis on the driving forces of methane emissions from solid waste treatment in G7 countries. Adv. Clim. Chang. Res. 2023, 19, 573-81. (in Chinese).
10. United Nations Environment Programme. Global methane assessment: benefits and costs of mitigating methane emissions. Nairobi, Kenya: United Nations Environment Programme; 2021. Available from: https://www.unep.org/resources/report/global-methane-assessment-benefits-and-costs-mitigating-methane-emissions [Last accessed on 19 Sep 2025].
11. Maasakkers, J. D.; Varon, D. J.; Elfarsdóttir, A.; et al. Using satellites to uncover large methane emissions from landfills. Sci. Adv. 2022, 8, eabn9683.
12. Moore, D. P.; Li, N. P.; Wendt, L. P.; et al. Underestimation of Sector-Wide Methane Emissions from United States Wastewater Treatment. Environ. Sci. Technol. 2023, 57, 4082-90.
13. Wang, Y.; Zhou, C.; Lou, Z.; et al. Underestimated methane emissions from solid waste disposal sites reveal missed greenhouse gas mitigation opportunities. Engineering 2024, 36, 12-5.
14. Wang, Y.; Fang, M.; Lou, Z.; et al. Methane emissions from landfills differentially underestimated worldwide. Nat. Sustain. 2024, 7, 496-507.
15. Du, M.; Peng, C.; Wang, X.; Chen, H.; Wang, M.; Zhu, Q. Quantification of methane emissions from municipal solid waste landfills in China during the past decade. Renew. Sustain. Energy. Rev. 2017, 78, 272-9.
16. Ghosh, P.; Shah, G.; Chandra, R.; et al. Assessment of methane emissions and energy recovery potential from the municipal solid waste landfills of Delhi, India. Bioresour. Technol. 2019, 272, 611-5.
17. Liu, Y.; Cheng, Z.; Chen, A. Y.; et al. Big disparities in CH4 emission patterns from landfills between the United States and China and their behind driving forces. Fundam. Res. 2025, 5, 734-9.
18. Zhang, S.; Lei, M.; Huang, X.; Zhang, Y. Evaluation of methane emission from MSW landfills in China, India, and the U.S. from space using a two-tier approach. J. Environ. Manag. 2025, 377, 124705.
19. Krause, M. J.; Thoma, E. D.; Bryant, A.; et al. A high-resolution satellite survey of methane emissions from 60 North American municipal solid waste landfills. Environ. Sci. Technol. 2025, 59, 15080-91.
20. Delgado, M.; López, A.; Esteban, A. L.; Lobo, A. Some findings on the spatial and temporal distribution of methane emissions in landfills. J. Clean. Prod. 2022, 362, 132334.
21. Scarpelli, T. R.; Cusworth, D. H.; Duren, R. M.; et al. Investigating major sources of methane emissions at US landfills. Environ. Sci. Technol. 2024, 58, 21545-56.
22. Li, H.; You, L.; Du, H.; et al. Methane and nitrous oxide emissions from municipal wastewater treatment plants in China: A plant-level and technology-specific study. Environ. Sci. Ecotechnol. 2024, 20, 100345.
23. Song, C.; Zhu, J. J.; Willis, J. L.; Moore, D. P.; Zondlo, M. A.; Ren, Z. J. Methane emissions from municipal wastewater collection and treatment systems. Environ. Sci. Technol. 2023, 57, 2248-61.
24. Liu, W.; Li, N.; Gao, P.; Di, X.; Liu, L.; Li, G. K. Tracking China's methane emissions from wastewater: inventories, driving forces, and mitigation potential. Resour. Conserv. Recy. 2024, 210, 107831.
25. Yin, Y.; Qi, X.; Gao, L.; et al. Quantifying methane influx from sewer into wastewater treatment processes. Environ. Sci. Technol. 2024, 58, 9582-90.
26. Xu, Z.; Zheng, Y.; Wu, Y. Paving the way for sustainable agriculture: an analysis of evolution and driving forces of methane emissions reduction in China. Resour. Conserv. Recy. 2024, 202, 107392.
27. Shen, N.; Tan, J.; Wang, W.; et al. Long-term changes of methane emissions from rice cultivation during 2000 - 2060 in China: trends, driving factors, predictions and policy implications. Environ. Int. 2024, 191, 108958.
28. Brown, S. Greenhouse gas accounting for landfill diversion of food scraps and yard waste. Compost. Sci. Util. 2016, 24, 11-9.
29. Wang, X.; Wang, K.; Liu, H.; et al. Dynamic methane emissions from China's fossil-fuel and food systems: socioeconomic drivers and policy optimization strategies. Environ. Sci. Technol. 2025, 59, 349-61.
30. Wang, Y.; Zhu, Z.; Dong, H.; Zhang, X.; Wang, S.; Gu, B. Mitigation potential of methane emissions in China's livestock sector can reach one-third by 2030 at low cost. Nat. Food. 2024, 5, 603-14.
31. Zhang, L.; Tian, H.; Shi, H.; et al. A 130-year global inventory of methane emissions from livestock: Trends, patterns, and drivers. Glob. Chang. Biol. 2022, 28, 5142-58.
32. Chen, R.; Wang, Y.; Hu, J.; Lin, X. Methane emission and mitigation strategies in animal manure management system. Acta. Pedol. Sin. 2012, 49, 815-23. (in Chinese). Available from: https://www.cabidigitallibrary.org/doi/full/10.5555/20123362089 [Last accessed on 22 Sep 2025].
33. Ministry of Ecology and Environment of the People's Republic of China Home Page. Available from: https://www.mee.gov.cn/ [Last accessed on 19 Sep 2025].
34. Department of Rural Social and Economic Survey, National Bureau of Statistics. China Rural Statistical Yearbook. China Statistics Press; 2021. Available from: https://www.mohurd.gov.cn/ [Last accessed on 22 Sep 2025].
35. Ministry of Housing and Urban-Rural Development of the People's Republic of China Home Page. Available from: https://www.mohurd.gov.cn/ [Last accessed on 19 Sep 2025].
36. U.S. Environmental Protection Agency. Landfill gas emissions model (LandGEM): estimates emission rates from municipal solid waste landfills; Washington, DC: U.S. Environmental Protection Agency; 2005. Available from: https://www.epa.gov/land-research/landfill-gas-emissions-model-landgem [Last accessed on 22 Sep 2025].
37. Huang, W.; Wachemo, A. C.; Yuan, H.; Li, X. Modification of corn stover for improving biodegradability and anaerobic digestion performance by Ceriporiopsis subvermispora. Bioresour. Technol. 2019, 283, 76-85.
38. Tian, W.; Li, J.; Zhu, L.; et al. Insights of enhancing methane production under high-solid anaerobic digestion of wheat straw by calcium peroxide pretreatment and zero valent iron addition. Renew. Energy. 2021, 177, 1321-32.
39. Wang, C.; Liu, J.; Shen, J.; et al. Effects of biochar amendment on net greenhouse gas emissions and soil fertility in a double rice cropping system: a 4-year field experiment. Agr. Ecosyst. Environ. 2018, 262, 83-96.
40. Wang, X.; Li, Z.; Bai, X.; et al. Study on improving anaerobic co-digestion of cow manure and corn straw by fruit and vegetable waste: Methane production and microbial community in CSTR process. Bioresour. Technol. 2018, 249, 290-7.
41. Wang, D.; Yuan, W.; Xie, Y.; et al. Simulating CH4 emissions from MSW landfills in China from 2003 to 2042 using IPCC and LandGEM models. Heliyon 2023, 9, e22943.
42. Cai, B.; Lou, Z.; Wang, J.; et al. CH4 mitigation potentials from China landfills and related environmental co-benefits. Sci. Adv. 2018, 4, eaar8400.
43. Chen, Y.; Qiu, R.; Zheng, M.; Ni, B. J.; Guo, H. G. Spatiotemporal evolution and driver analysis of wastewater greenhouse gas emissions in Chinese mainland: insights and future trends. Environ. Res. 2025, 283, 122169.
44. Ma, Z.; Feng, P.; Gao, Q.; Lu, Y.; Liu, J.; Li, W. CH4 emissions and reduction potential in wastewater treatment in China. Adv. Clim. Chang. Res. 2015, 6, 216-24.
45. Wang, D.; Ye, W.; Wu, G.; et al. Greenhouse gas emissions from municipal wastewater treatment facilities in China from 2006 to 2019. Sci. Data. 2022, 9, 317.
46. Zhao, X.; Jin, X. K.; Guo, W.; et al. China's urban methane emissions from municipal wastewater treatment plant. Earth's. Future. 2019, 7, 480-90.
47. Zhao, H.; Jia, X.; Yang, J.; Wu, Y.; Wu, X.; Du, L. Spatiotemporal variations and influencing factors of methane emissions from livestock in China: a spatial econometric analysis. Sci. Total. Environ. 2024, 931, 173010.
48. Lan, H.; Brika, S. K.; Huseyn, A. A.; Shamshieva, N.; Du, L. Assessing spatiotemporal trends and drivers of livestock methane emissions in China: a spatial econometric analysis. Ecol. Ind. 2025, 178, 113992.
49. Du, M.; Kang, X.; Liu, Q.; et al. City-level livestock methane emissions in China from 2010 to 2020. Sci. Data. 2024, 11, 251.
50. Wang, K.; Zhang, J.; Cai, B.; Liang, S. Estimation of Chinese city-level anthropogenic methane emissions in 2015. Resour. Conserv. Recy. 2021, 175, 105861.
51. Lu, C.; Jiang, W.; Gao, W.; He, G.; Sun, C. Spatial-temporal characteristics of methane emission in shandong, China, based on an updated comprehensive methane emission inventory in 2020. Atmos. Pollut. Res. 2024, 15, 102044.
Cite This Article
How to Cite
Download Citation
Export Citation File:
Type of Import
Tips on Downloading Citation
Citation Manager File Format
Type of Import
Direct Import: When the Direct Import option is selected (the default state), a dialogue box will give you the option to Save or Open the downloaded citation data. Choosing Open will either launch your citation manager or give you a choice of applications with which to use the metadata. The Save option saves the file locally for later use.
Indirect Import: When the Indirect Import option is selected, the metadata is displayed and may be copied and pasted as needed.
About This Article
Special Issue
Copyright

Data & Comments
Data
0


Comments
Comments must be written in English. Spam, offensive content, impersonation, and private information will not be permitted. If any comment is reported and identified as inappropriate content by OAE staff, the comment will be removed without notice. If you have any queries or need any help, please contact us at [email protected].