


fig2
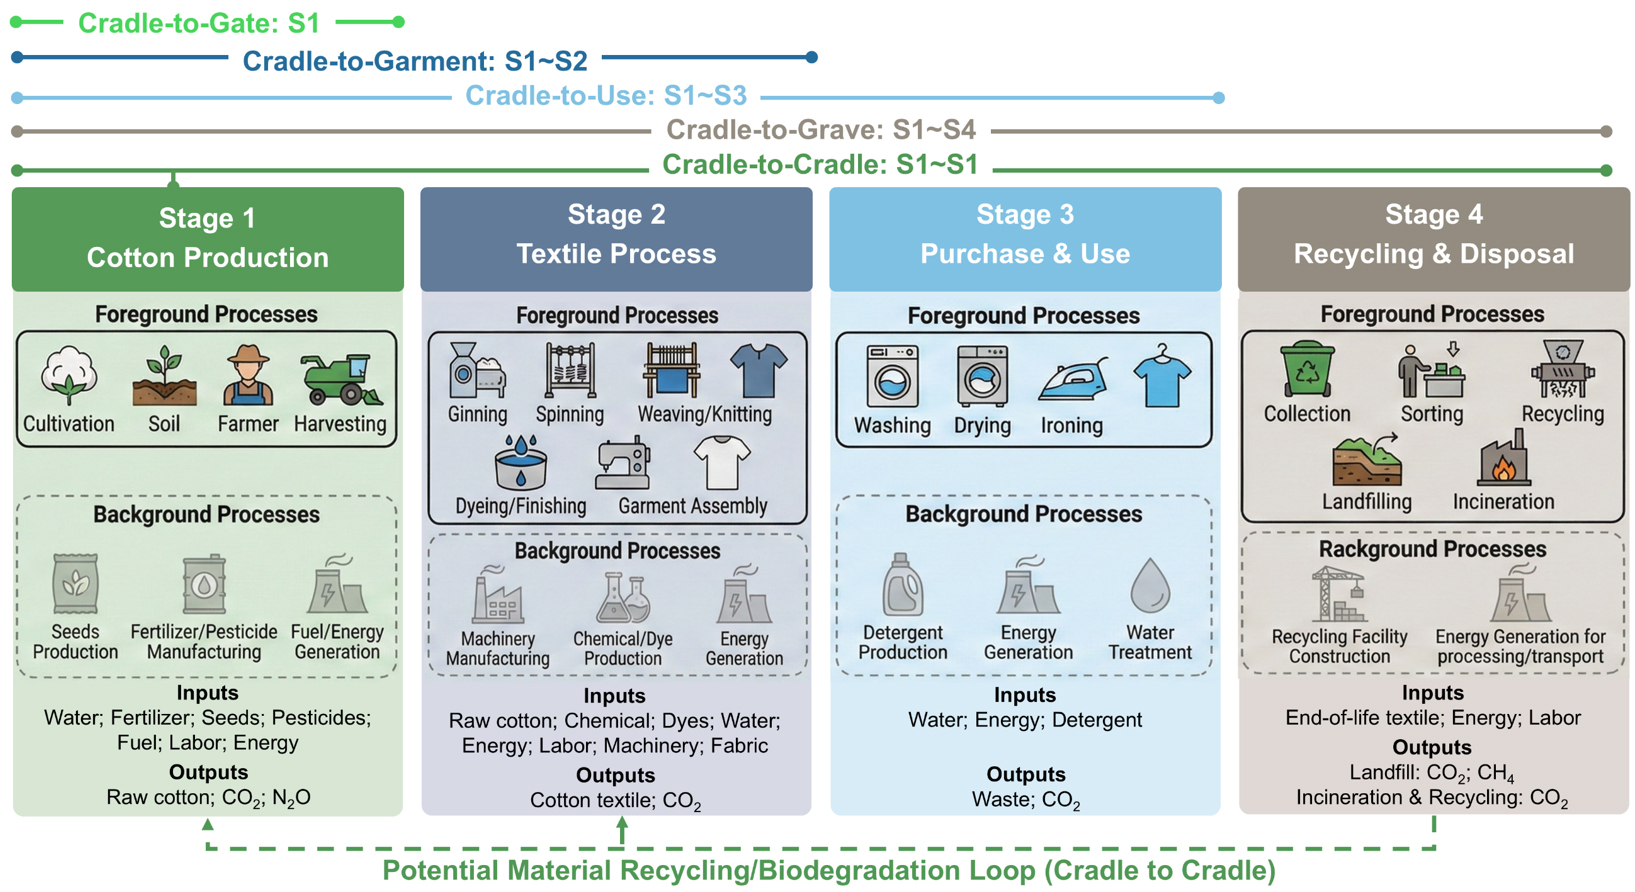
Figure 2. Different carbon footprint system boundaries of cotton and textile products according to study aims and contents. The figure was created by Microsoft PowerPoint 2019 and did not involve any copyright issues.
Figure 2. Different carbon footprint system boundaries of cotton and textile products according to study aims and contents. The figure was created by Microsoft PowerPoint 2019 and did not involve any copyright issues.


All published articles are preserved here permanently
https://www.portico.org/publishers/oae/


