


fig4
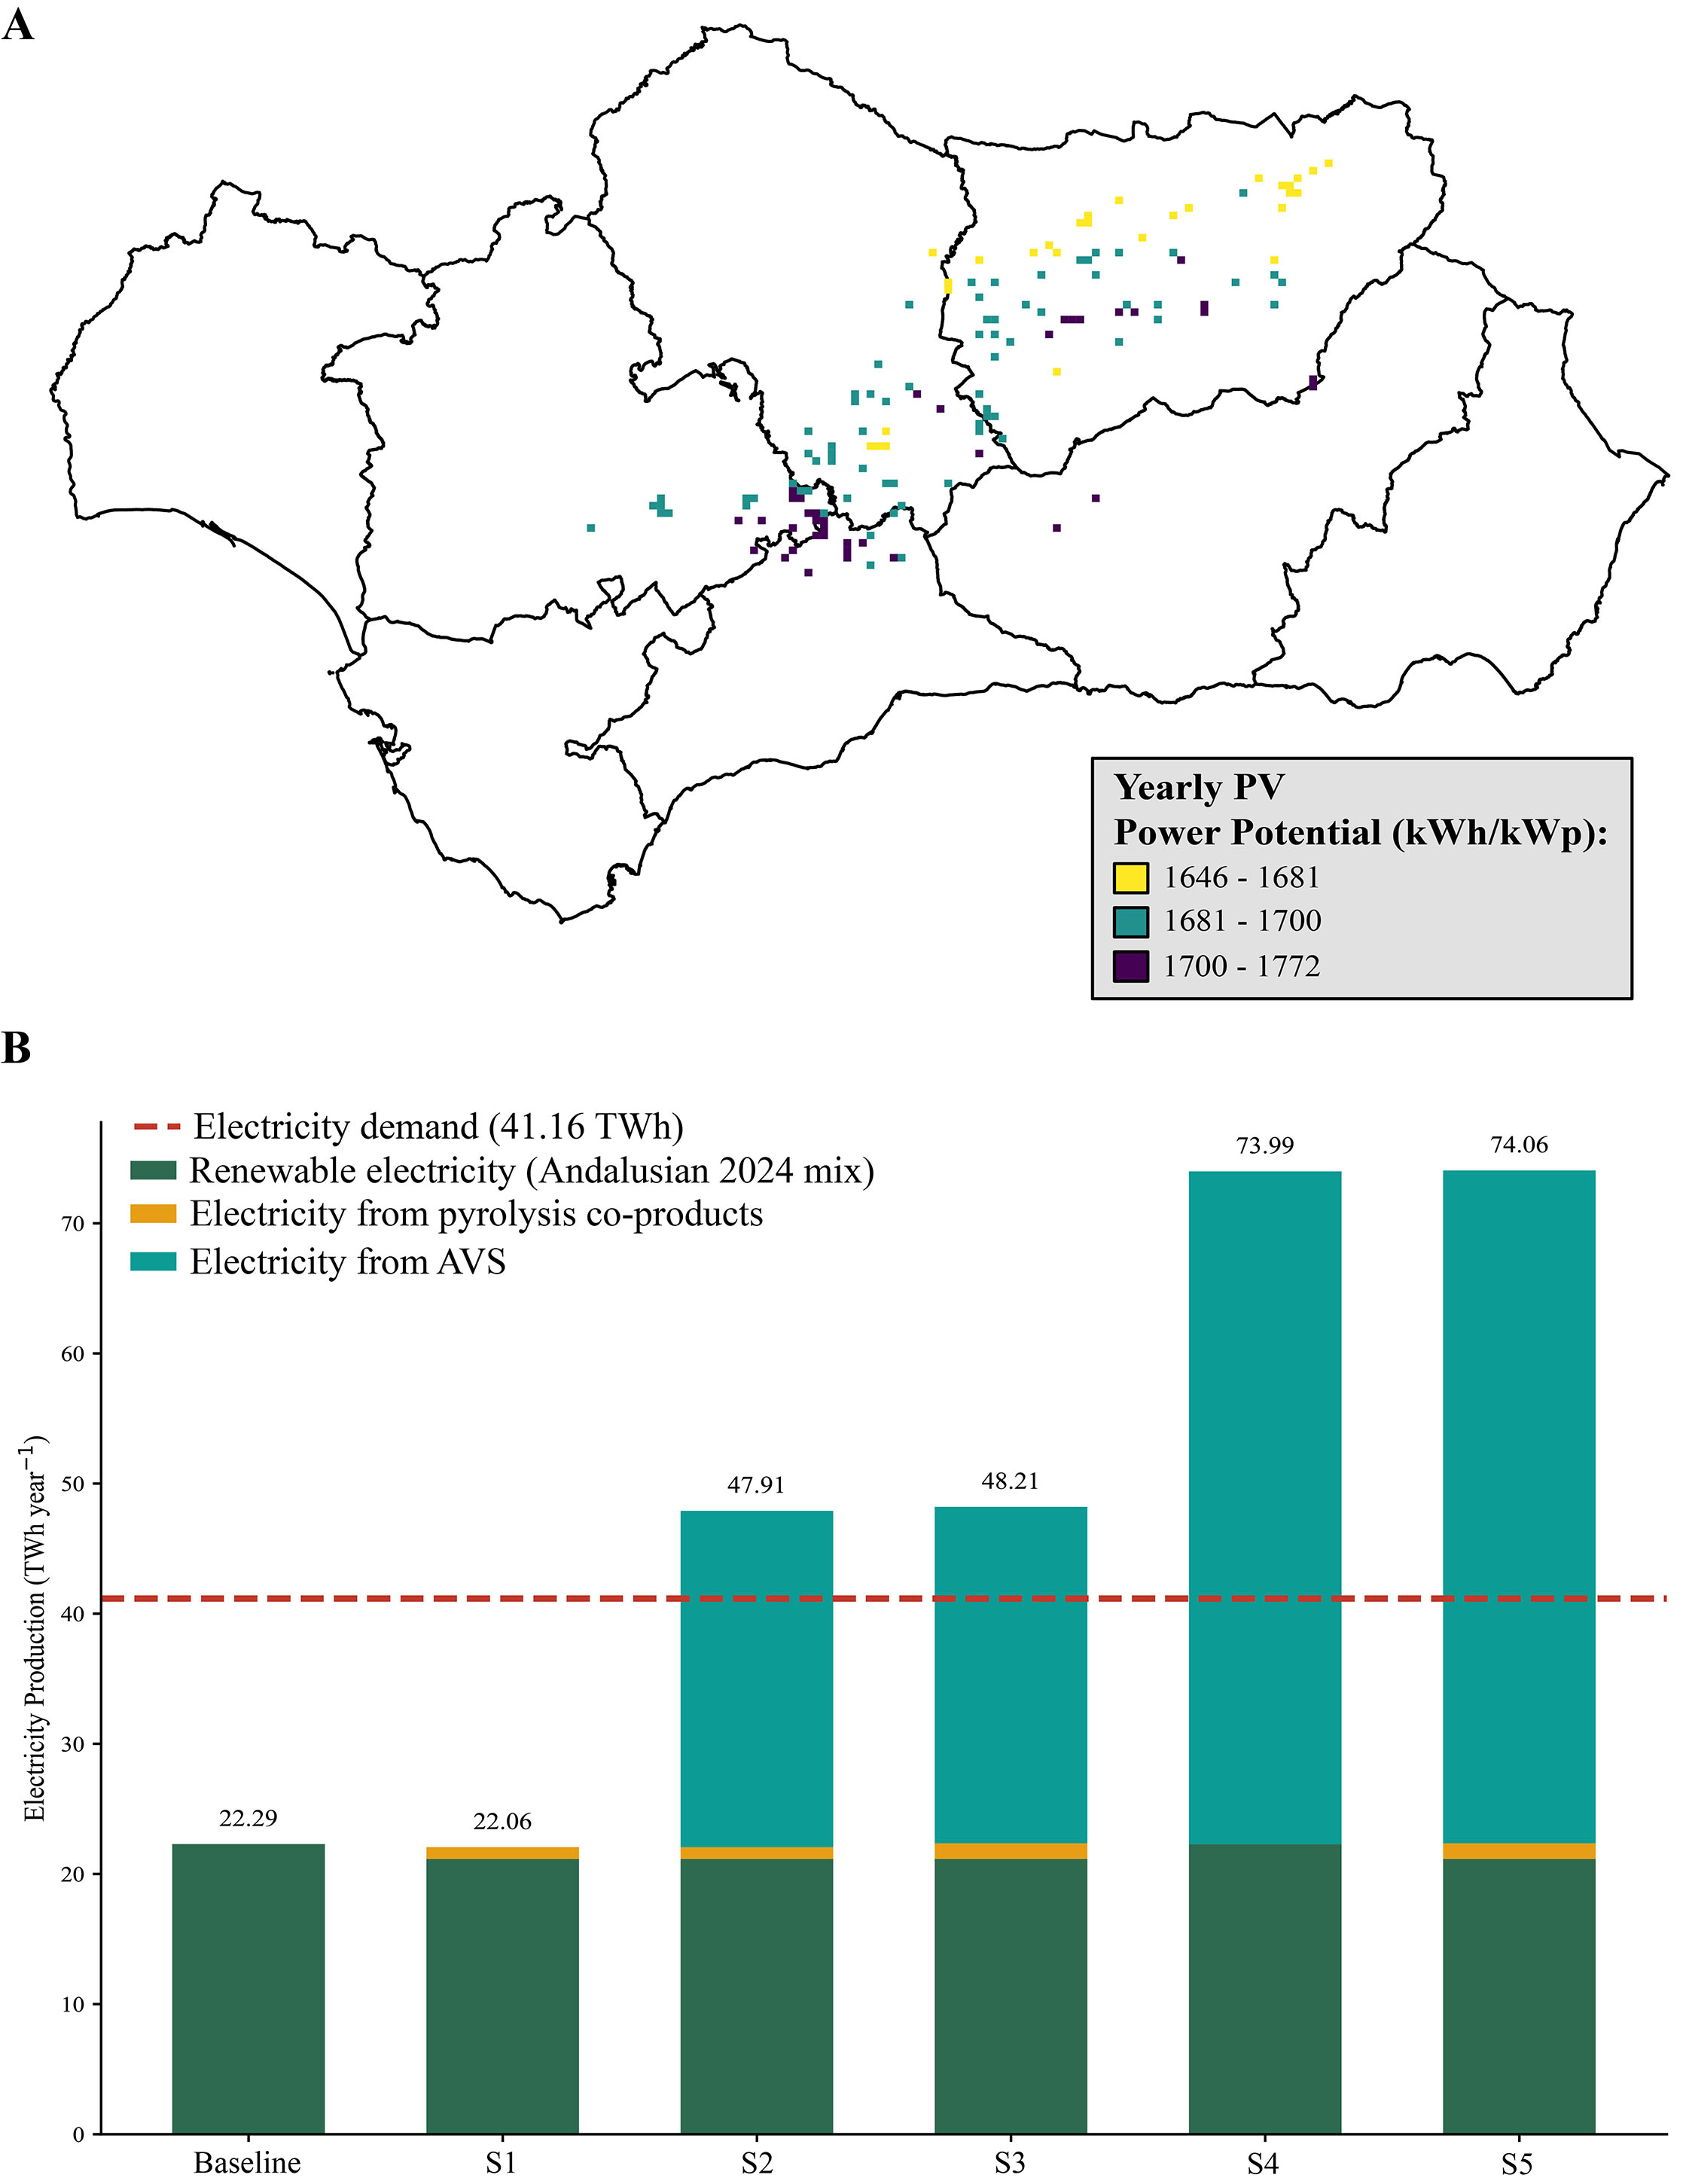
Figure 4. Optimal spatial distribution of AVS and potential electricity generation. (A) shows the spatial distribution of yearly photovoltaic (PV) power potential (kWh kWp-1) within areas suitable for agrivoltaic systems (AVS), mapped using ArcGIS Pro based on data from[28]. (B) illustrates the annual electricity production potential (TWh year-1) compared to the 2024 Andalusian renewable mix. The red dashed line indicates the regional electricity demand (41.1 TWh). Scenarios are defined by biochar feedstock and AVS deployment levels: S1 (EOP, no AVS), S2 (EOP, 50% AVS), S3 (EOP-OP, 50% AVS), S4 (AVS-only, 100% AVS), and S5 (EOP-OP, 100% AVS).


