


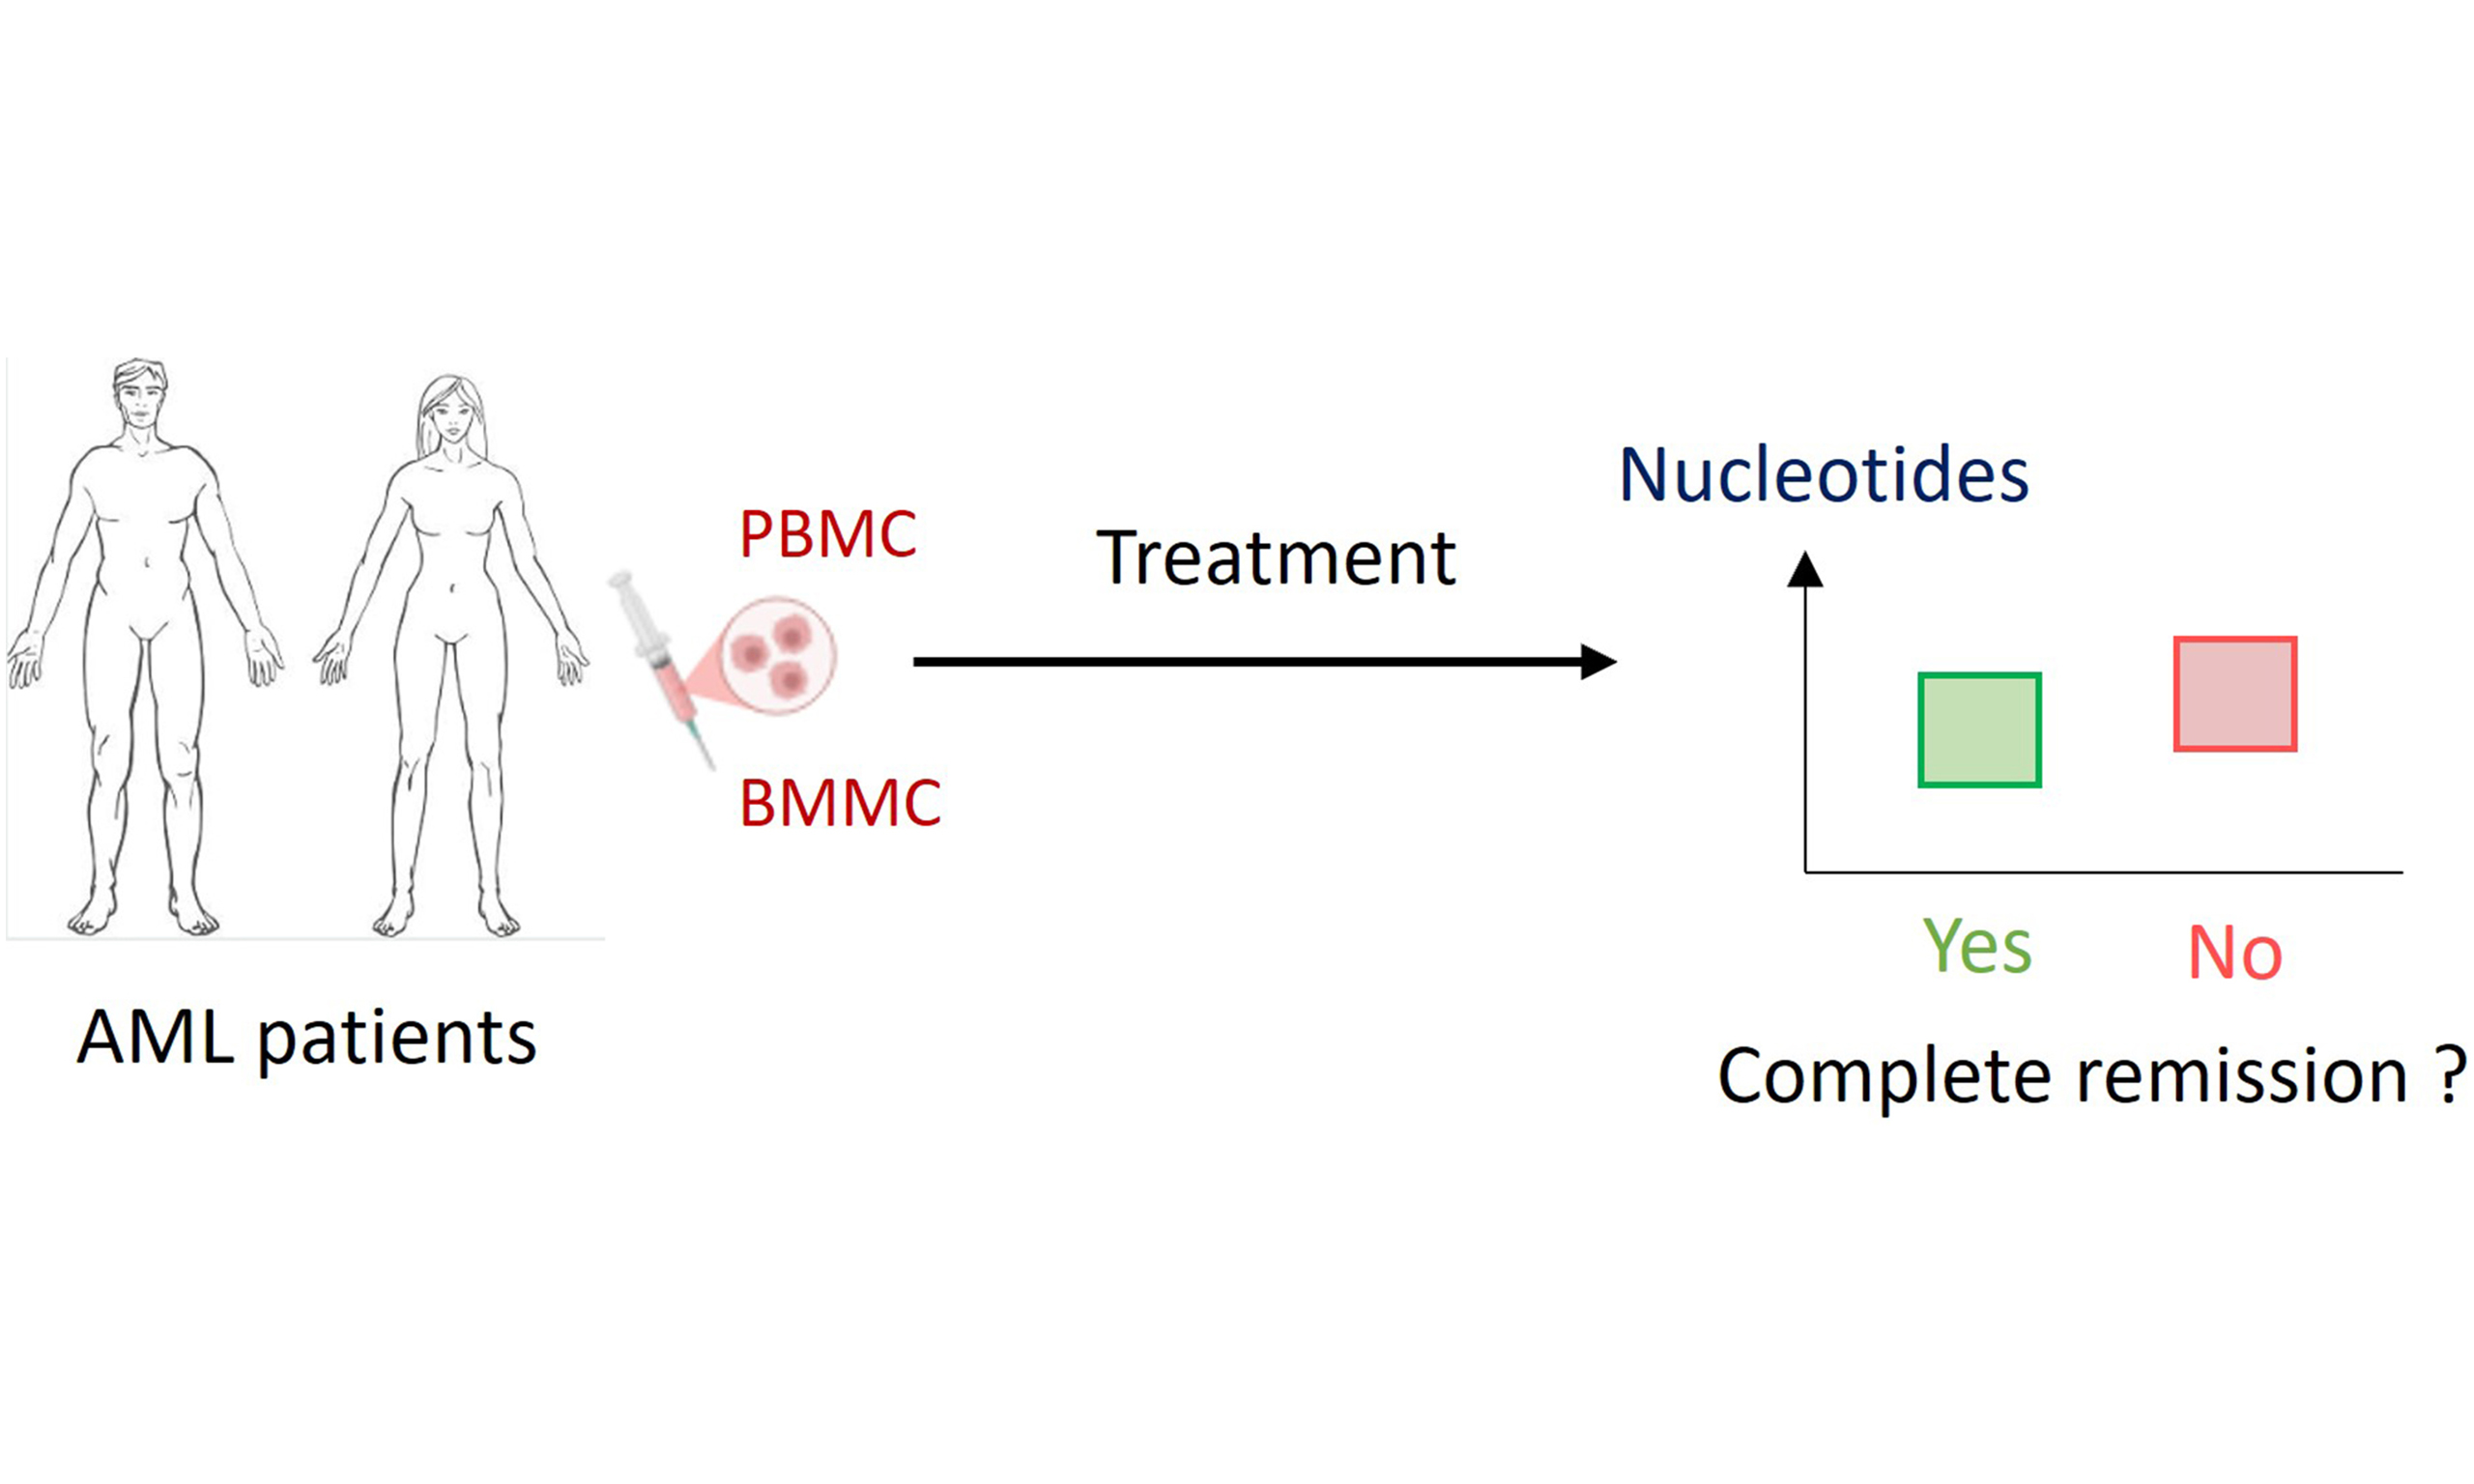
Evaluation of intracellular nucleotide pools in peripheral blood and bone marrow mononuclear cells and their association with frontline intensive chemotherapy response rates in AML patients
 0
0 Abstract
Aim: Resistance to frontline intensive chemotherapy remains a major clinical challenge in acute myeloid leukemia (AML). Currently, refractory AML is mostly observed in certain genotypes. In in vitro experiments, primary resistance in AML has been associated with nucleotide metabolism. However, the relationship between in vivo nucleotide metabolism, genotype, and the occurrence of complete remission (CR) remains largely unexplored. We aimed to investigate the potential association between in vivo nucleotide pools at AML diagnosis, genotype, and the efficacy of frontline intensive chemotherapy.
Methods: In this prospective pilot study, we quantified the intracellular nucleotide pools in peripheral blood (PBMC) and bone marrow mononuclear cells (BMMC) from 70 AML patients at diagnosis. Nucleotide levels were compared depending on genotype data and the occurrence of CR after the frontline intensive chemotherapy.
Results: No relationship was observed between nucleotide levels and genotype. Specific alterations of certain nucleotide levels in cells from patients who did not achieve CR were identified: elevated guanosine triphosphate (GTP) levels in BMMC and uridine monophosphate (UMP) levels in PBMC, as well as reduced adenosine monophosphate (AMP) levels and energy ratios [AMP/adenosine triphosphate (ATP), AMP + adenosine diphosphate (ADP)/ATP] in PBMC. These results may suggest impaired activity of enzymes such as UMP/cytidine monophosphate (CMP) kinase and reduced AMP-activated protein kinase (AMPK) activation in patients who did not achieve CR.
Conclusion: Our study provides the first in vivo data linking specific alterations in intracellular nucleotide levels to the efficacy of the frontline intensive chemotherapy in AML. These findings offer a novel perspective on the role of nucleotide metabolism in the primary resistance in frontline intensive chemotherapy.
Keywords
INTRODUCTION
Acute myeloid leukemia (AML) is a bone marrow (BM) disorder characterized by the clonal proliferation of immature hematopoietic cells, known as blasts. The standard frontline treatment remains intensive induction chemotherapy combining an anthracycline with cytarabine[1]. These regimens induce a complete remission (CR) in a relatively high proportion (65%-80%) of newly diagnosed patients[2,3]. Refractory AML, defined as the absence of CR after frontline treatment, is associated with primary resistance. Primary resistance is driven by intrinsic mechanisms, including impaired drug uptake or activation, increased drug inactivation, efflux through adenosine triphosphate (ATP)-binding cassette (ABC) transporters, protective signals from the BM microenvironment, or pre-existing resistant subclones. Cytarabine is a cytidine analog with similar intracellular metabolic pathways. Once inside the cell, cytarabine undergoes sequential phosphorylation by enzymes involved in nucleotide metabolism, producing mono-, di-, and ultimately triphosphate forms, with the triphosphate being the active metabolite. Cytarabine triphosphate then competes with endogenous nucleotides for incorporation into DNA, thereby disrupting DNA synthesis[4]. In parallel, cytarabine and cytarabine monophosphate can be deaminated by cytidine deaminase (CDA) and deoxycytidylate deaminase, respectively, resulting in inactive metabolites[4]. The deoxynucleoside triphosphate (dNTP) triphosphohydrolase (dNTPase) sterile alpha motif and histidine–aspartate domain–containing protein 1 (SAMHD1) is also implicated in antimetabolite deactivation via the hydrolysis of cytarabine triphosphate[5]. Given the close interplay between the metabolism of cytarabine and that of endogenous nucleotides, several primary resistance mechanisms have been linked to alterations in the nucleotide metabolism or intracellular nucleotide pools. A reduction in the expression of enzymes implicated in the anabolism of cytarabine such as deoxycytidine kinase (dCK) and uridine monophosphate (UMP)-cytidine monophosphate (CMP) kinase or an increase in enzymes implicated in its catabolism such as CDA, the cytosolic 5’-nucleotidase II (cN-II) and the dNTPase SAMHD1 have been associated with reduced cytarabine or frontline intensive chemotherapy efficacy[4-7]. The relationship between ribonucleotide reductase (RNR) activity, an enzyme that promotes dNTP production from ribonucleotides, and SAMHD1, a dNTPase that exerts an antagonistic effect, has also been associated with the efficacy of cytarabine[5]. Moreover, recent studies have identified adenosine monophosphate (AMP)-activated protein kinase (AMPK) as a key modulator of cytarabine and anthracycline efficacy in AML. It has been shown that this regulator of cellular metabolism, activated by a high AMP/ATP ratio, influences the response to chemotherapy in AML[8].
Collectively, these findings underscore the role of enzymes involved in nucleotide metabolism, and the resulting intracellular nucleotide levels, in the efficacy of frontline intensive chemotherapy in AML. An increase in anabolic enzymes and activation of AMPK by a high AMP/ATP ratio, together with a decrease in catabolic enzymes, dNTP levels and RNR expression, may be associated with the occurrence of CR. Except for the work reported by Galmarini et al. on cN-II[7], most previous studies have been performed in in vitro experiments, rather than on patient samples.
To summarize, resistance to frontline intensive chemotherapy remains a major clinical challenge in AML. Currently, refractory AML, associated with primary resistance, is mostly observed in specific gene mutations and complex karyotype settings[9]. In in vitro experiments, primary resistance in AML has been associated with nucleotide metabolism. However, the relationship between in vivo nucleotide metabolism, genotype, and the occurrence of CR remains largely unexplored.
In this context, we performed an in vivo pilot study to evaluate intracellular nucleotide pools in peripheral blood mononuclear cells (PBMC) and bone marrow mononuclear cells (BMMC) from AML patients, and to investigate their relationship with the efficacy of frontline intensive chemotherapy.
METHOD
Patients
The study was conducted following ethical approval granted by the French ethics committee (Comité de Protection des Personnes) on June 6, 2017 (No. 30/17_3). It was registered on ClinicalTrials.gov under the identifier NCT03234985. Patients were recruited from the Department of Hematology at Lyon-Sud Hospital (University Hospital of Lyon, France). Inclusion criteria were age ≥ 18 years and a diagnosis of AML, excluding acute promyelocytic leukemia, according to the World Health Organization (WHO) classification of haematolymphoid tumors.
Design of the study
Peripheral blood (PB) and/or BM samples were collected at AML diagnosis using BD Vacutainer® Cell Preparation Tubes (CPTTM) with sodium heparin (Becton Dickinson, Le Pont de Claix, France) as additional tubes to quantify intracellular nucleotides. Patients then received frontline intensive chemotherapy according to the following protocols: cytarabine 200 mg/m2 days 1-7 plus daunorubicin 60 or 90 mg/m2 days 1-3, or Vyxeos® on days 1, 3 and 5; cytarabine 200 mg/m2 days 1-7 plus idarubicin 9 mg/m2 days 1-5 or 12 mg/m2 days 1-3; or cytarabine 200 mg/m2 days 1-7 plus daunorubicin 60 mg/m2 days 1-3 and gemtuzumab ozogamicin 3 mg/m2 (maximum 5 mg per injection) on days 1, 4, and 7.
At the BM recovery, morphological CR was determined based on the cytological response. CR was defined as < 5% BM blast cells [Figure 1].
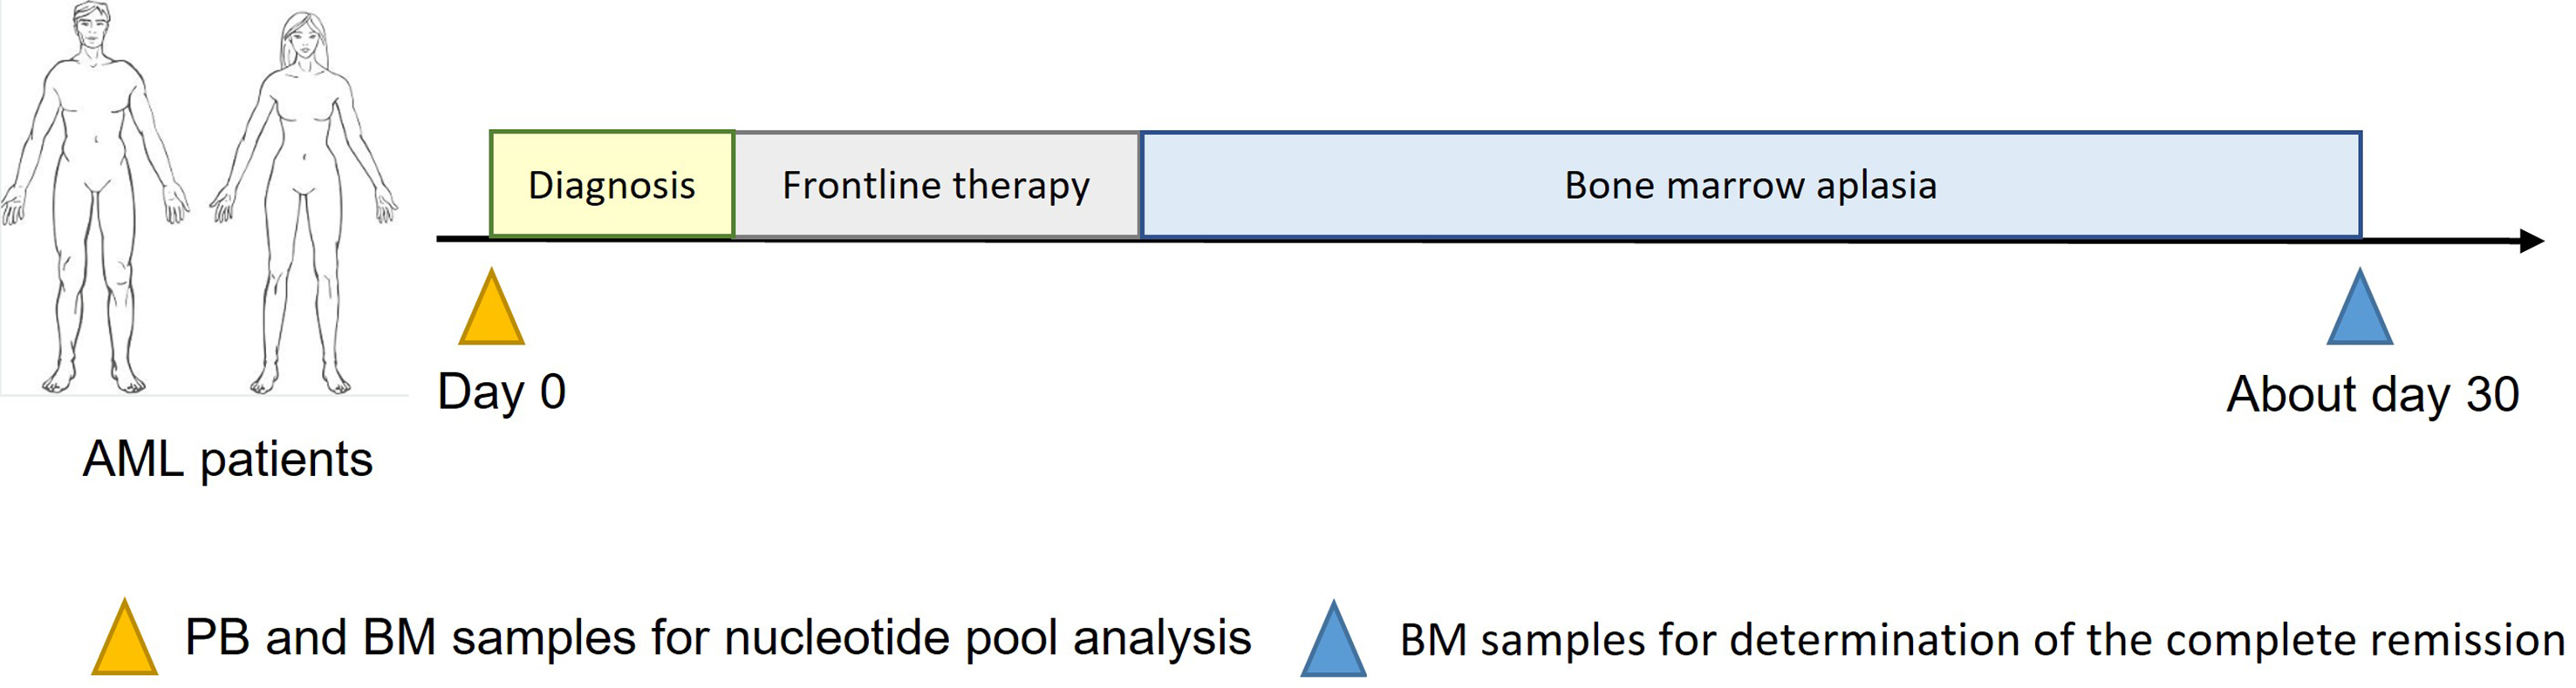
Figure 1. Design of the study. AML: Acute myeloid leukemia; PB: peripheral blood; BM: bone marrow.
Isolation of cells using CPTTM tubes
After collection, samples were centrifuged at 1,800 × g for 20 min at ambient temperature. Following homogenization, the supernatant was transferred to a tube and centrifuged at 720 × g for 10 min at +5 °C. The plasma-containing supernatant was then removed. Subsequent steps were performed on ice using cold solvents. Contaminating red blood cells were lysed by incubation for 2 min in 2 mL of hypotonic ammonium chloride (pH 7.4). After centrifugation at 720 × g for 10 min at +5 °C, the supernatant was removed. The CPTTM-purified fraction, containing AML blasts[10], was suspended in 1 mL of 1× phosphate-buffered saline (PBS). Twenty microliters of the suspension were used for cell counting and viability assessment. The remaining suspension was centrifuged, PBS was removed, and 500 µL of methanol/water (70:30, v/v) were added to lyse the CPT-purified fraction. Extracts were stored at -80 °C until analysis. Cell counts were performed using optical microscopy and a C-Chip Neubauer Improved Disposable Counting Chamber. Cell viability was evaluated using Trypan Blue (Sigma-Aldrich, St. Louis, MO, USA).
LC-MS/HRMS analysis of the intracellular nucleotide pool
Liquid chromatography (LC) was conducted on an Ultimate 3000 system (ThermoFisherScientificTM, Bremen, Germany), and mass spectrometry (MS) detection was carried out on a Q Exactive Plus Orbitrap® (ThermoFisherScientificTM) equipped with an electrospray source. The LC-MS method was previously validated and published[11].
The following nucleotides were identified and quantified: AMP, adenosine diphosphate (ADP), ATP, deoxyadenosine monophosphate (dAMP), deoxyadenosine triphosphate (dATP), UMP, uridine diphosphate (UDP), uridine triphosphate (UTP), thymidine monophosphate (TMP), thymidine triphosphate (TTP), CMP, cytidine diphosphate (CDP), cytidine triphosphate (CTP), deoxycytidine monophosphate (dCMP), deoxycytidine triphosphate (dCTP), guanosine monophosphate (GMP), guanosine diphosphate (GDP), guanosine triphosphate (GTP), deoxyguanosine monophosphate (dGMP), deoxyguanosine triphosphate (dGTP), and inosine monophosphate (IMP). Results were expressed as the quantity of each nucleotide in pmol normalized to 1 × 10⁶ cells.
Statistical analysis
Categorical variables were summarized using contingency tables. For continuous variables, the mean ± standard deviation, median, interquartile range, and minimum-maximum range were calculated. Relationships between qualitative variables were assessed using the chi-square test or Fisher’s exact test, as appropriate. Continuous variables were compared using the Mann-Whitney test, the Wilcoxon signed-rank test for paired data, and the Kruskal-Wallis test for comparisons across more than two groups. Correlations were analyzed using Spearman’s correlation test. As Spearman correlations were computed between the number of leukocytes and 13 additional variables within the same dataset, P-values were adjusted for multiple comparisons using the Holm-Bonferroni method to control the family-wise error rate. A permutational multivariate analysis of variance (PERMANOVA, permutations = 999) was applied for the global multivariate analysis of intracellular nucleotide pools. Principal coordinate analysis (PCoA) based on Euclidean distance was used to visualize the relationships between intracellular nucleotide pools and different groups. Logistic regression was performed to evaluate the association between intracellular nucleotide levels and the occurrence of CR vs. no CR. Nucleotide levels were log-transformed prior to analysis. The regression model was adjusted for age, sex, and total blast count, and variable selection was performed using an Akaike Information Criterion (AIC)-based approach. All statistical analyses were conducted using R software (4.5.1 version). Differences were considered statistically significant at the 5% level.
RESULTS
Description of the population
This prospective study included 83 patients between September 2017 and August 2020. Among them, both PB and BM samples were obtained for 54 patients, only BM for 25, and only PB for 4. Seven patients died before the initiation of frontline intensive chemotherapy, 4 patients did not receive the cytarabine- and anthracycline-based regimen, and 1 patient was followed up in another hospital. One patient died before BM recovery. Thus, at BM recovery, the study included 70 patients (49 with both PB and BM samples, 17 with only BM, and 4 with only PB) [Supplementary Figure 1]. Characteristics of the included population are summarized in Table 1. Because the number of patients carrying each individual mutation was relatively small, mutations were grouped into genetic subcategories [Table 1]. Among the 70 patients included, 14 had FMS-like tyrosine kinase 3–internal tandem duplication (FLT3-ITD) ± tyrosine kinase domain (TKD) mutations, 5 had CCAAT/enhancer-binding protein alpha (CEBPA) mutations, and 7 had tumor protein p53 (TP53) mutations.
Characteristics of the population
| Patients characteristics | n = 70 |
| Mean age (+/- sd) (years) | 50.7 (+/- 12.4) |
| Sex-ratio M/F | 1.2 |
| Mean number of leukocytes at diagnosis (+/- sd) (G/L) | 25.7 (+/- 36.4) |
| Median number of leukocytes at diagnosis [min-max range] (G/L) | 9.9 [1.1-177.1] |
| Mean PB blasts at diagnosis (+/- sd) (%) | 43 (+/- 32) |
| Mean BM blasts at diagnosis (+/- sd) (%) | 61 (+/- 24) |
| History of leukemia | |
| Newly diagnosed, n (%) | 60 (85.7%) |
| MRC/prior history of MDS, n (%) | 9 (12.9%) |
| Therapy related, n (%) | 1 (1.4%) |
| Genetic subgroups | |
| Complex karyotype, n (%) | 8 (11.4%) |
| Favorable genomic group | 31 (44.3%) |
| KMT2A or DEK rearrangements, n (%) | 5 (7.1%) |
| Other, n (%) | 24 (34.3%) |
| Not available, n (%) | 2 (2.9%) |
| Karyotype | |
| Diploid, n (%) | 47 (67.2%) |
| Hyperploid, n (%) | 8 (11.4%) |
| Monosomal, n (%) | 2 (2.9%) |
| Complex, n (%) | 8 (11.4%) |
| Not available, n (%) | 5 (7.1%) |
| 2022 ELN classification | |
| Favorable, n (%) | 22 (31.4%) |
| Intermediate, n (%) | 18 (25.7%) |
| Adverse, n (%) | 28 (40.0%) |
| Not available, n (%) | 2 (2.9%) |
Evaluation of the relationship between intracellular nucleotide pools and leukemia characteristics at diagnosis
Among the twenty-one nucleotides measured using the LC-MS/high-resolution mass spectrometry (HRMS) method, thirteen were consistently detectable and quantifiable in both PBMC and BMMC samples: AMP, ADP, ATP, UMP, UTP, CMP, CTP, dCTP, GMP, GDP, GTP, dGTP, and IMP. Their levels showed important disparities, from around 1 pmol/106 cells for dGTP to more than 10,000 pmol/106 cells for ATP. The purine nucleotides represent almost 90% of intracellular nucleotides in both PBMC and BMMC [Figure 2].
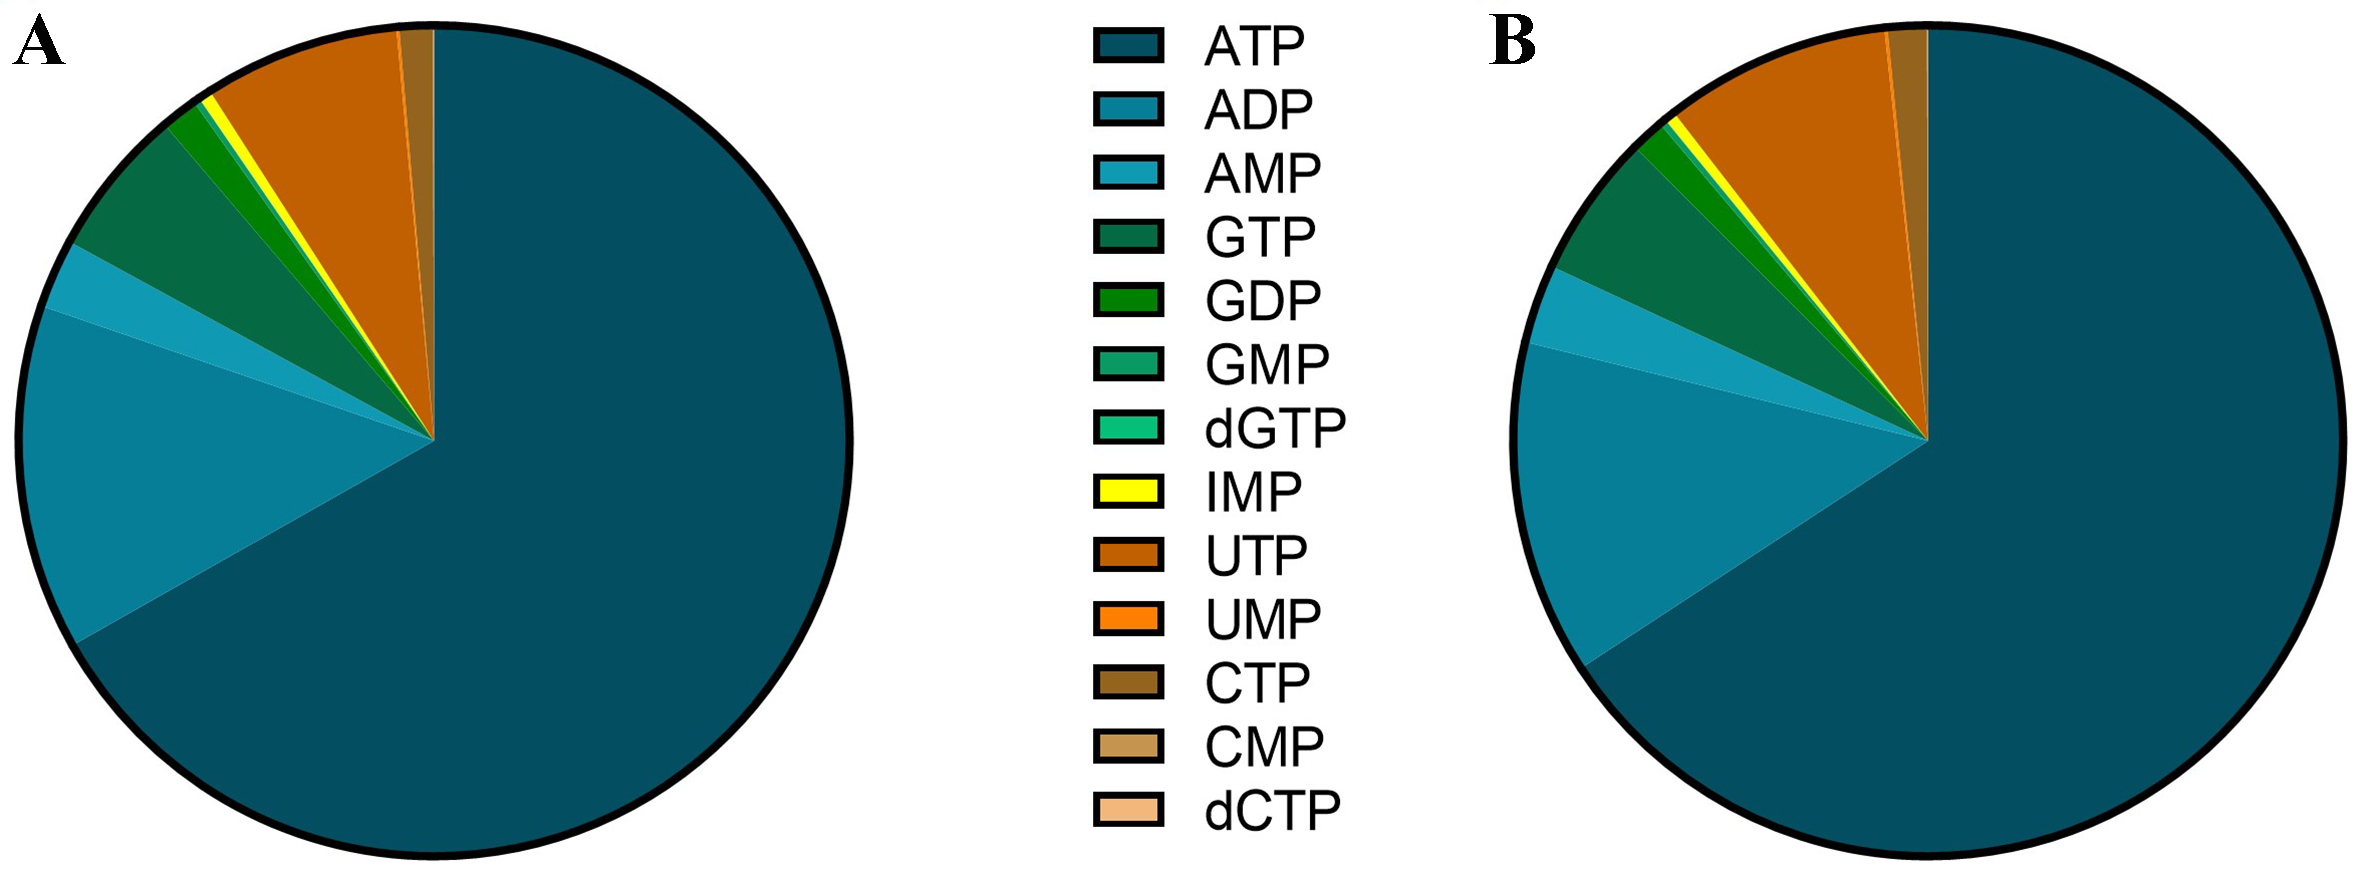
Figure 2. Distribution of nucleotides in (A) PBMC and (B) BMMC in AML patients. Results are expressed for each nucleotide as the percentage of the total content of nucleotides. PBMC: Peripheral blood mononuclear cells; BMMC: bone marrow mononuclear cells; AML: acute myeloid leukemia; ATP: adenosine triphosphate; ADP: adenosine diphosphate; AMP: adenosine monophosphate; GTP: guanosine triphosphate; GDP: guanosine diphosphate; GMP: guanosine monophosphate; dGTP: deoxyguanosine triphosphate; IMP: inosine monophosphate; UTP: uridine triphosphate; UMP: uridine monophosphate; CTP: cytidine triphosphate; CMP: cytidine monophosphate; dCTP: deoxycytidine triphosphate.
Comparison of nucleotide proportions between PBMC and BMMC using a PERMANOVA test revealed no significant difference (P = 0.055). However, the purine-to-pyrimidine ratio was significantly different, with 11.4 in PBMC and 8.7 in BMMC (P < 0.001).
The correlations between nucleotide levels and various leukemia characteristics at diagnosis were investigated. A significant correlation (P = 0.02) was observed between CMP levels in PBMC and the total number of leukocytes at diagnosis. However, the Spearman’s correlation coefficient (rs) was relatively low (0.42). In BMMC, a correlation between nucleotide levels and the degree of marrow leukemic infiltration (expressed as the percentage of blasts in BM) was observed only for dGTP (P = 0.02; rs = -0.28). The intracellular nucleotide pool was compared according to the presence of mutated genes, after grouping patients into genetic subgroups due to the small number of patients with specific mutations [Table 1]. Using a multivariate global approach (PERMANOVA), a significant difference (P = 0.035) was observed for intracellular nucleotides in BMMC between these subgroups [Figure 3]. However, univariate analysis of each nucleotide across the four genetic subgroups did not reveal any significant differences; P-values between 0.05 and 0.10 were noted for AMP (P = 0.056), CMP (P = 0.092), and the energetic stress ratio AMP/ATP (P = 0.069). The same PERMANOVA approach was applied to cytogenetic profiles based on karyotypic groups and to the European LeukemiaNet (ELN) classification [Table 1]. No significant differences in intracellular nucleotide pools were observed between the four karyotypic groups (P = 0.12) or among the three ELN classes (P = 0.36) [Figure 3].
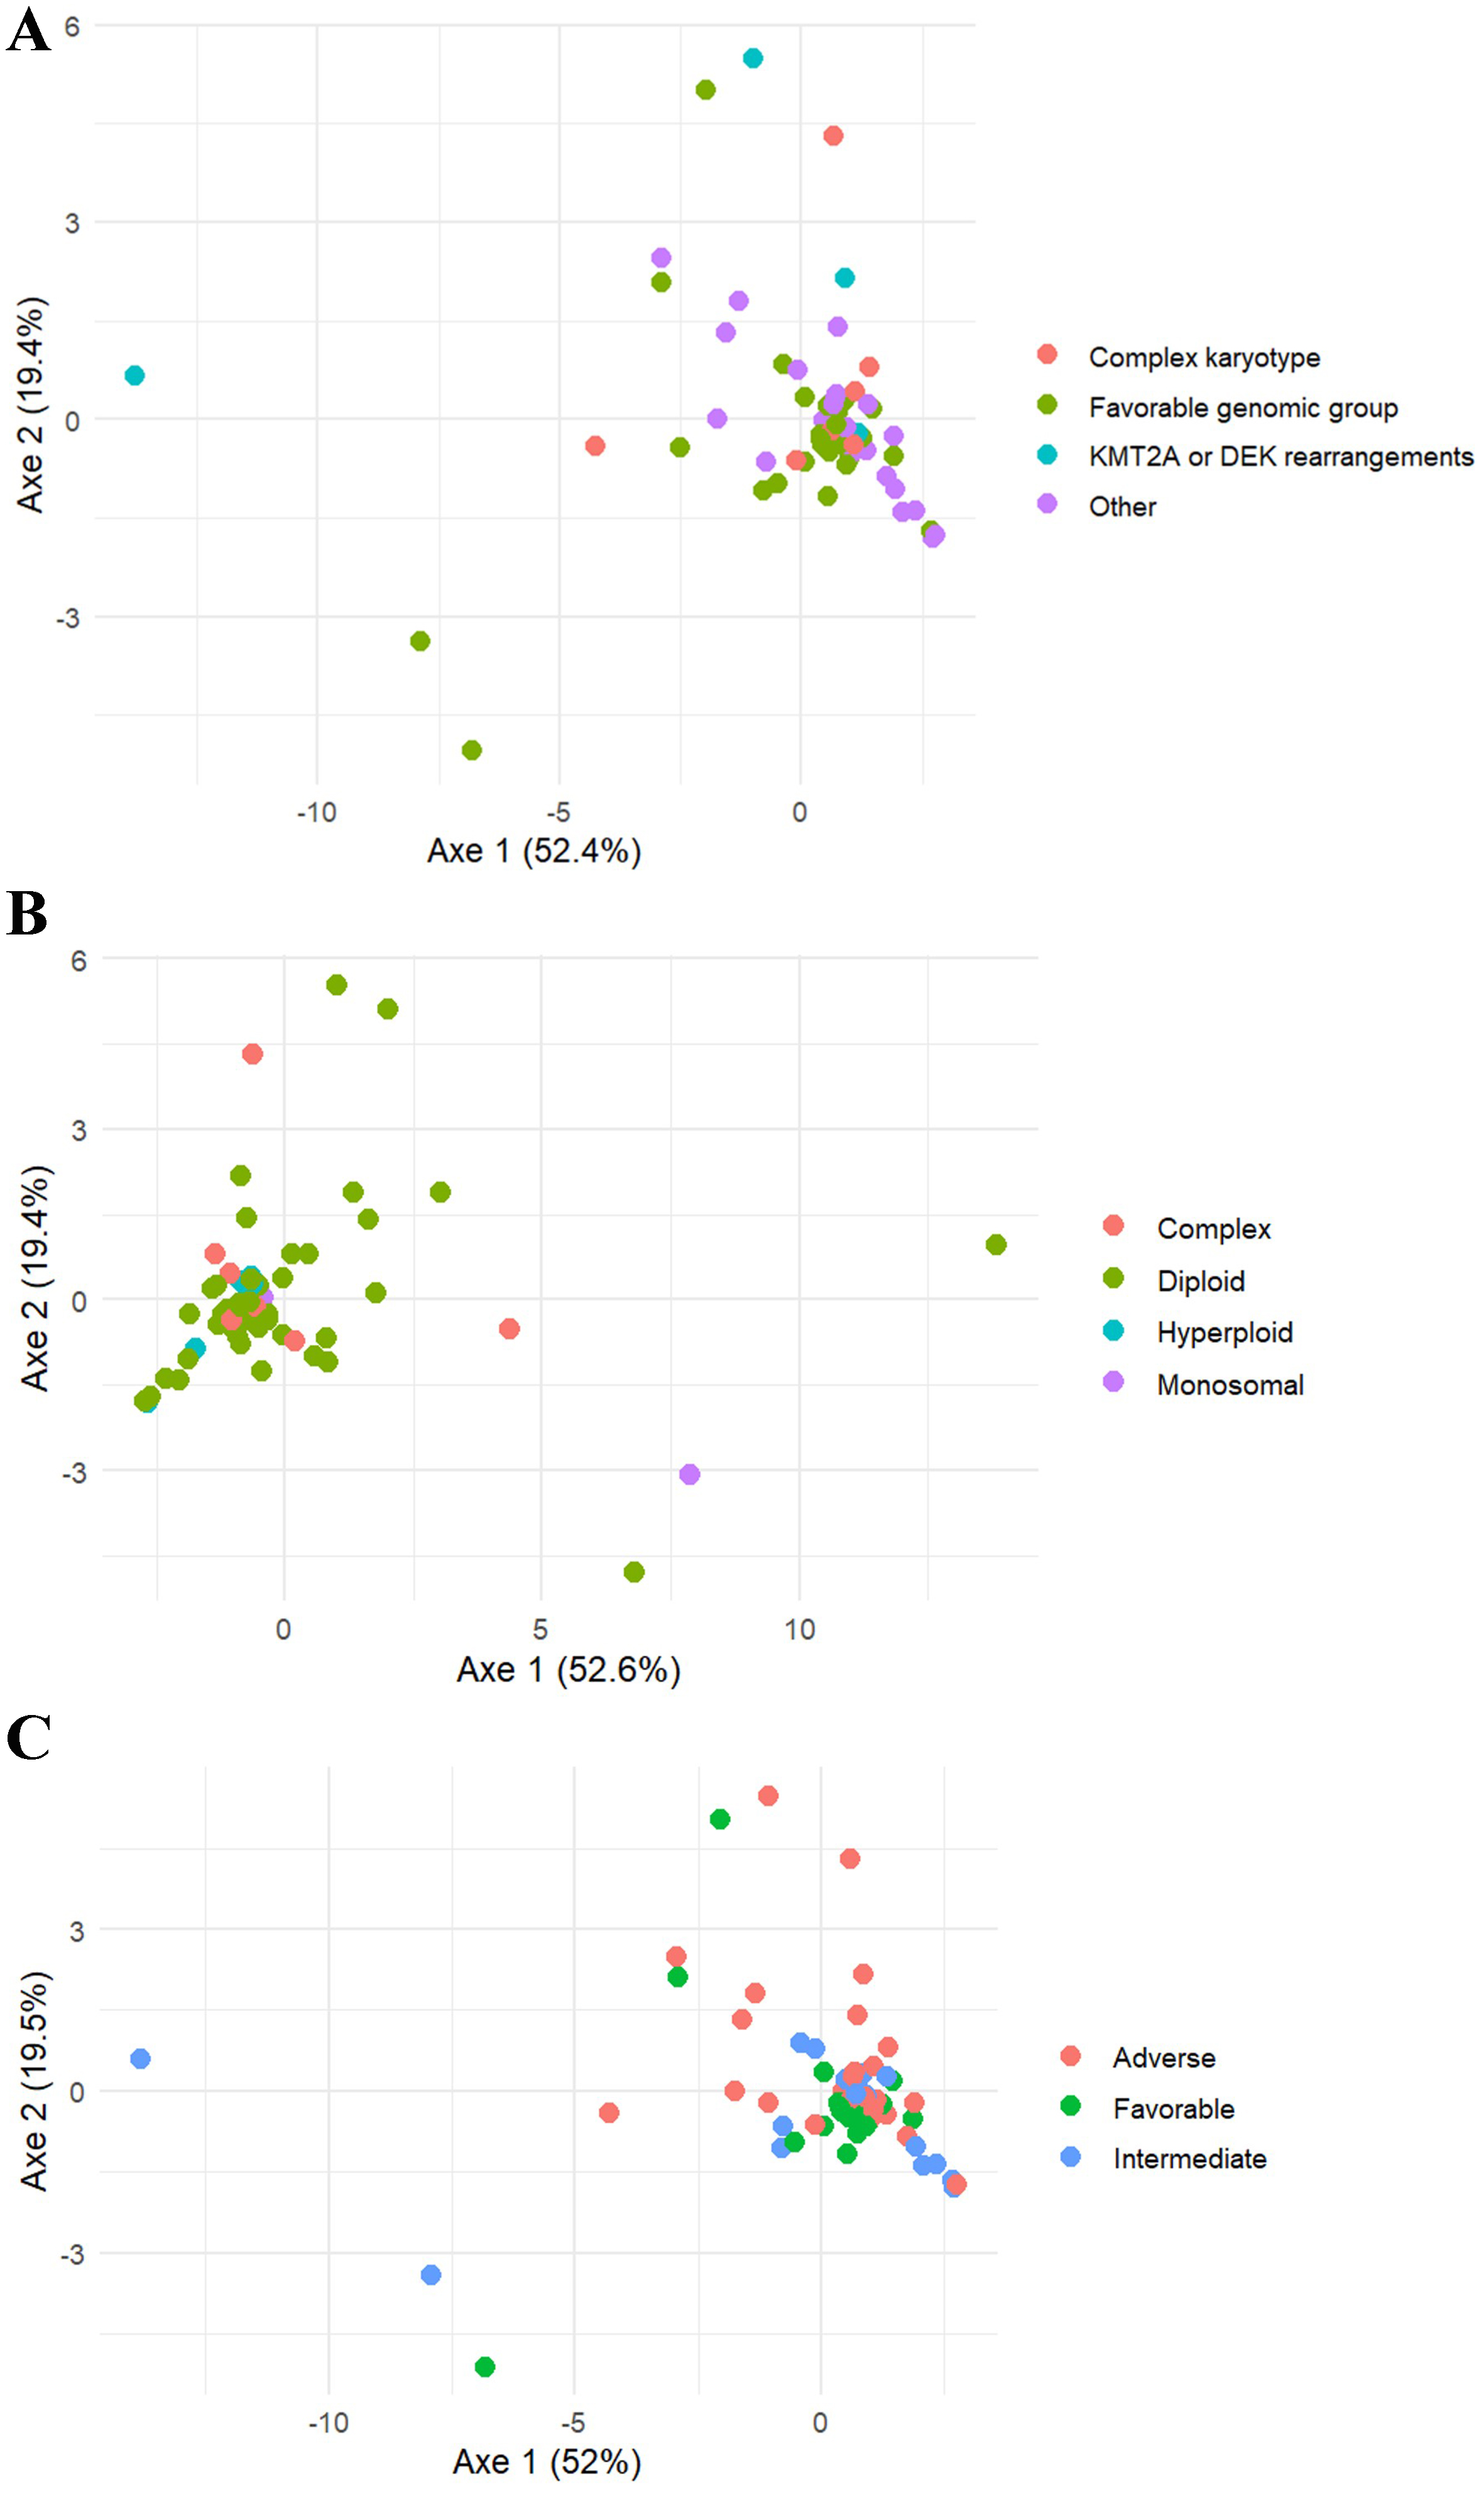
Figure 3. PCoA visualization for the comparison of the nucleotide pool in BMMC depending on (A) genetic subgroups; (B) karyotype; and (C) ELN classification. Favorable genomic group was defined as NPM1mut, CEBPA bZIP mutations or CBF-rearrangements. PCoA: Principal coordinate analysis; BMMC: bone marrow mononuclear cells; ELN: European LeukemiaNet; CEBPA: CCAAT/enhancer-binding protein alpha; CBF: core binding factors; KMT2A: lysine (K)-specific methyltransferase 2A.
Relationship between leukemia characteristics and the achievement of CR
Among the 70 patients included, CR was achieved in 52 patients (74.3%). No differences were observed in age, sex ratio, or percentage of blasts in PB and BM between patients who achieved morphological CR (= CR population) and those who did not (= no CR population). The median leukocyte count was significantly higher (P = 0.03) in the CR population (18.4 G/L) than in the no CR population (7.5 G/L). Genetic (P < 0.001) and cytogenetic (P = 0.006) abnormalities, and the ELN classes (P < 0.001) at diagnosis were associated with the occurrence of CR. Regarding the frontline intensive chemotherapy, the type of anthracycline administered in combination with cytarabine showed no association with the occurrence of CR [Table 2].
Description of the patient cohort based on the achievement of a CR population or not (no CR population)
| CR population | No CR population | P-value | |
| Number of patients (%) | 52 (74.3%) | 18 (25.7%) | NA |
| Mean age (+/- sd) (years) | 49.7 (+/- 12.4) | 53.7 (+/- 12.6) | NS |
| Sex-ratio M/F | 1.0 | 2.0 | NS |
| Median of number of leukocytes at diagnosis [min-max range] (G/L) | 18.4 [1.1-177.1] | 7.5 [1.3-33.7] | 0.030 |
| Mean PB blasts at diagnosis (+/- sd) (%) | 46.0 (+/- 32.7) | 32.6 (+/- 30.2) | NS |
| Mean BM blasts at diagnosis (+/- sd) (%) | 61.0 (+/- 24.8) | 59.8 (+/- 23.0) | NS |
| Genetic subgroups | |||
| Complex karyotype, n (%) | 2 (2.9%) | 6 (8.8%) | < 0.001 |
| Favorable genomic group | 30 (44.1%) | 1 (1.5%) | |
| KMT2A or DEK rearrangements, n (%) | 5 (7.4%) | 0 (0%) | |
| Other, n (%) | 13 (19.1%) | 11 (16.2%) | |
| Karyotype | |||
| Diploid, n (%) | 39 (60.0%) | 8 (12.3%) | 0.006 |
| Hyperploid, n (%) | 6 (9.2%) | 2 (3.1%) | |
| Monosomal, n (%) | 1 (1.5%) | 1 (1.5%) | |
| Complex, n (%) | 2 (3.1%) | 6 (9.2%) | |
| 2022 ELN classification | |||
| Favorable, n (%) | 22 (32.4%) | 0 (0%) | < 0.001 |
| Intermediate, n (%) | 13 (19.1%) | 5 (7.4%) | |
| Adverse, n (%) | 16 (23.5%) | 12 (17.6%) | |
| Induction treatment | |||
| Cytarabine + Daunorubicin, n (%) | 32 (45.7%) | 14 (20.0%) | NS |
| Cytarabine + Idarubicin, n (%) | 20 (28.6%) | 4 (5.7%) | |
Association of intracellular nucleotide levels at diagnosis of AML and the occurrence of CR after frontline intensive chemotherapy
As an initial approach, a global multivariate analysis was performed using a PERMANOVA test to compare intracellular nucleotide pools between the CR and no CR patients. For both PBMC and BMMC, no significant differences were observed between the CR and no CR populations (P = 0.76 for PBMC and P = 0.52 for BMMC) [Figure 4].
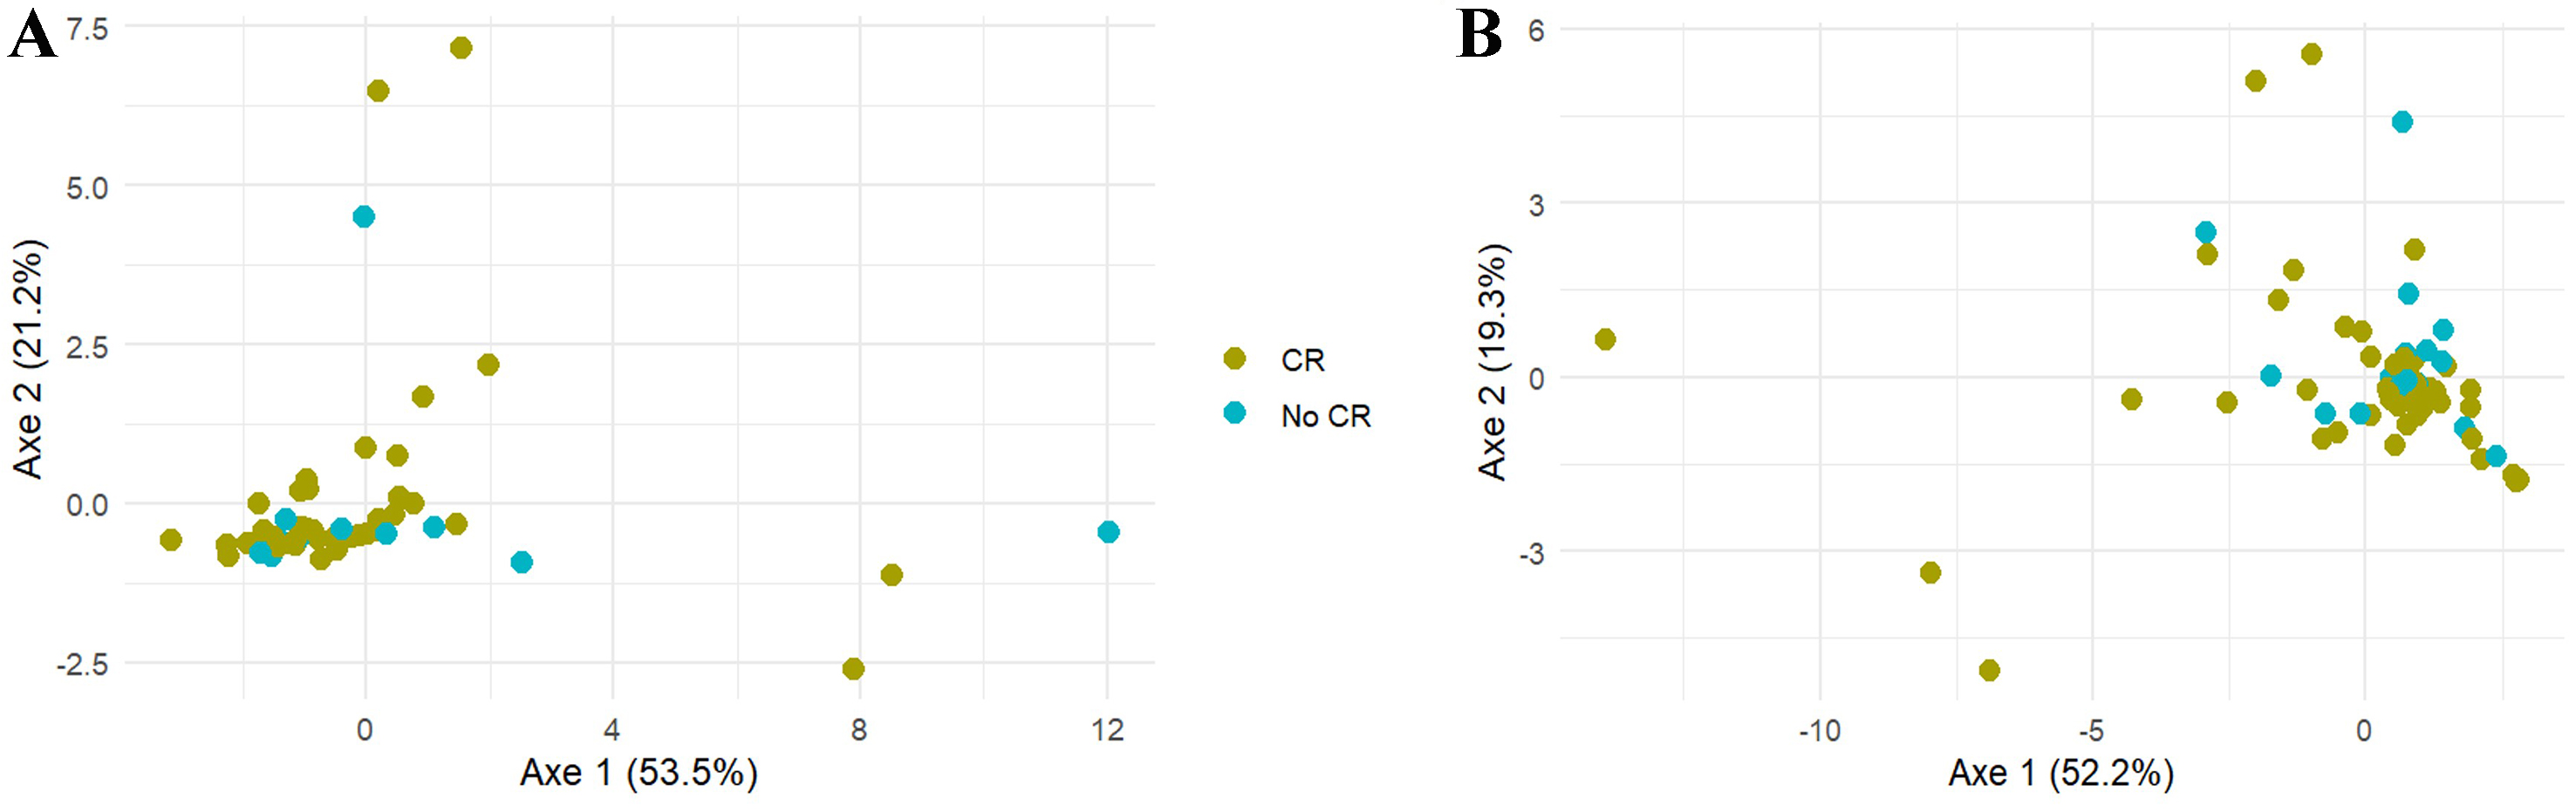
Figure 4. Comparison of the nucleotide pool in (A) PBMC and (B) BMMC depending on the occurrence of CR using a PCoA visualization. PBMC: Peripheral blood mononuclear cells; BMMC: bone marrow mononuclear cells; CR: complete remission; PCoA: principal coordinate analysis.
Secondly, a comparison between the CR and no CR populations was performed for the total nucleotide content, total purines, total pyrimidines, the purines/pyrimidines ratio, and for the levels of each individual nucleotide [Supplementary Table 1]. No significant differences between the two populations were observed for the intracellular total nucleotide content, purines, pyrimidines, or the purines/pyrimidines ratio in both PBMC and BMMC. Significant differences were observed for three nucleotides: in the no CR population, AMP levels were significantly decreased in PBMC (P = 0.004), UMP levels were significantly increased in PBMC (P = 0.009), and GTP levels were significantly increased in BMMC (P = 0.025) [Figure 5].
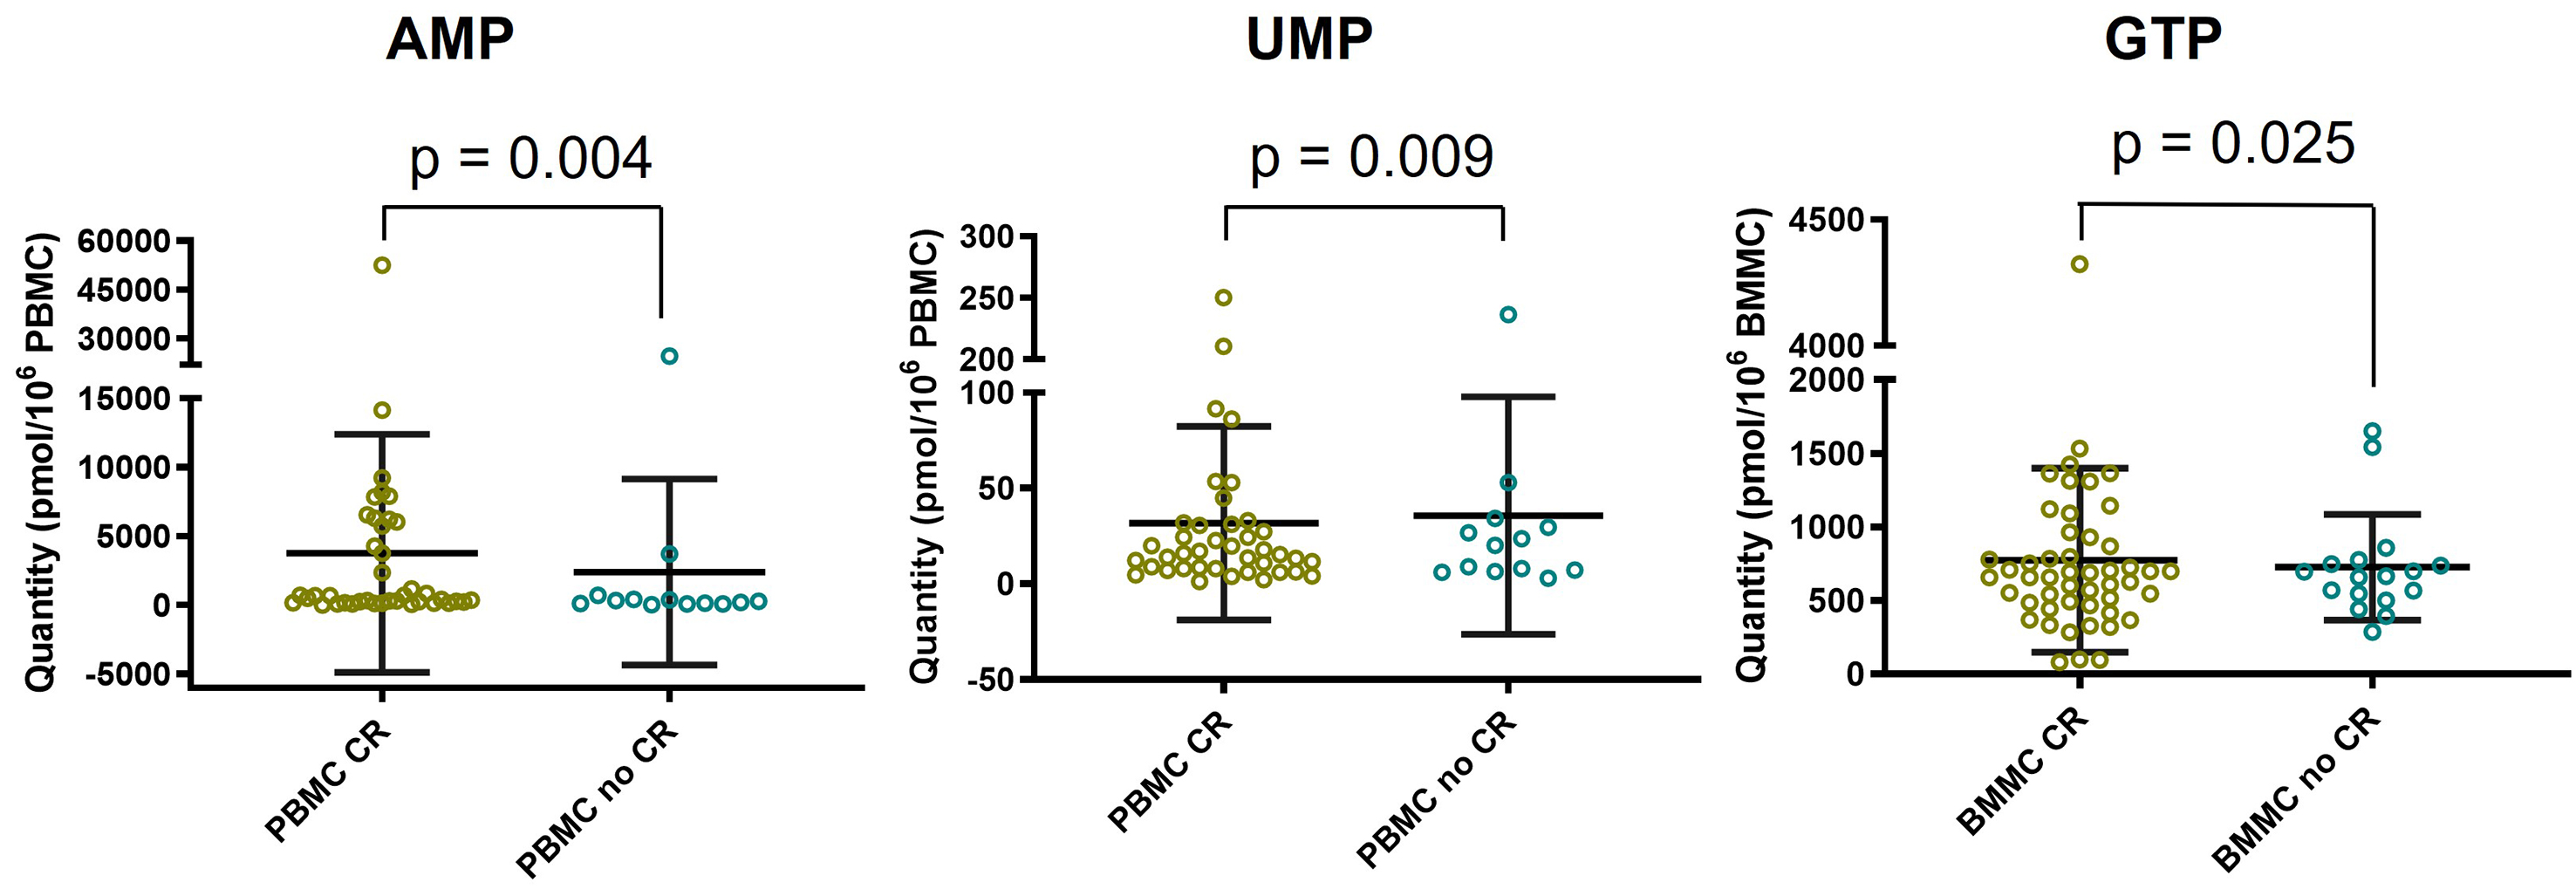
Figure 5. Statistical method used: Mann-Whitney test. Comparison of intracellular AMP, UMP and GTP levels between CR population and no CR population (medians and interquartile ranges). AMP: Adenosine monophosphate; UMP: uridine monophosphate; GTP: guanosine triphosphate; CR: complete remission; PBMC: peripheral blood mononuclear cells; BMMC: bone marrow mononuclear cells.
Since the activation of AMPK, which is dependent on cellular energy stress, has been associated with chemosensitivity to cytarabine and doxorubicin, we compared the intracellular energy status according to treatment response (CR vs. no CR). For this, the AMP/ATP and (AMP + ADP)/ATP ratios were calculated and compared between the CR and no CR populations [Table 3]. A significant decrease in AMP/ATP and (AMP + ADP)/ATP ratios (P = 0.03 and P = 0.01, respectively) was observed in PBMC from the no CR population, while a similar trend was noted in BMMC.
Comparison of the energetic status ratios AMP/ATP and (AMP + ADP)/ATP depending on the occurrence of CR
| PBMC | BMMC | |||||
| CR | No CR | P-value | CR | No CR | P-value | |
| Median | Median | Median | Median | |||
| AMP/ATP | 0.045 [0.01-1.71] | 0.027 [0.01-0.63] | 0.03 | 0.045 [0.01-1.38] | 0.030 [0.01-1.89] | 0.25 |
| (AMP + ADP)/ATP | 0.28 [0.08-1.88] | 0.22 [0.13-1.42] | 0.01 | 0.27 [0.09-1.90] | 0.22 [0.11-1.05] | 0.06 |
DISCUSSION
This prospective translational study evaluated the intracellular nucleotide pools in PBMC and BMMC from AML patients at diagnosis and investigated their association with response to frontline intensive chemotherapy. Most prior studies examining the relationship between nucleotide metabolism and the efficacy of cytarabine and/or anthracycline in AML have been conducted in vitro.
In our study, a substantial number of AML patients (n = 70) were included, with both BM and PB samples available for most. Analysis of the intracellular nucleotide pools in PBMC and BMMC did not reveal differences in nucleotide metabolism correlated with cytogenetic markers or the ELN classification. Previous metabolomic analyses of BM samples from AML patients reported alterations in redox balance, amino acid metabolism, and phospholipid metabolism depending on the presence of mutated genes [mainly nucleophosmin 1 (NPM1) and FLT3-ITD] and ELN classification groups[12]. However, potential modifications in nucleotide metabolism were not reported. To date, to our knowledge, no link between the presence of mutated genes and alterations of enzymes involved in nucleotide metabolism has been described.
Among the patients included, 74.3% achieved a morphological CR at BM recovery. This rate is consistent with previously reported values[2,3,13]. In this study, we focused specifically on primary resistance, defined as the absence of CR after frontline intensive chemotherapy (the “no CR population”). Despite recent advances in AML biology, the primary resistance rate to frontline intensive chemotherapy remains high, driven by unfavorable molecular and cellular mechanisms[1]. The cytotoxic activity of cytarabine requires uptake through human equilibrative nucleoside transporter 1 (hENT1) and subsequent phosphorylation into the triphosphate active metabolite by dCK and other kinases. Impaired activity at either step reduces intracellular accumulation of the active metabolite[4,7]. Conversely, increased activity of CDA, cN-II, and hydrolysis by SAMHD1 contributes to drug inactivation[4,7,14]. Additionally, alterations in nucleotide pools - particularly dNTPs, dCTP, and CTP - have been observed in cytarabine-resistant cells[15-17]. Among these factors, our work specifically focused on the cellular mechanisms involving nucleotides.
Our results did not reveal a global imbalance in intracellular nucleotide pools according to the occurrence of morphological CR [Figure 4]. However, specific modifications in certain nucleotide levels in PBMC and BMMC from patients who did not achieve CR were identified, suggesting a primary resistance mechanism linked to cellular metabolism.
Firstly, we observed increased GTP levels in BMMC from patients who did not achieve CR. GTP is a purine nucleotide essential for DNA and RNA synthesis, as well as for numerous enzymatic and signaling pathways. Purine metabolism has previously been associated with cytarabine sensitivity[18]. A study on seven AML cell lines with varying sensitivities to cytarabine and doxorubicin found higher levels of guanosine and guanine in resistant cell lines[18]. However, the mechanistic link between higher guanosine levels and chemosensitivity in AML remains unclear.
Secondly, higher UMP levels were observed in PBMC from patients in the no CR population. UMP phosphorylation into UDP is catalyzed by UMP/CMP kinase, an enzyme also involved in cytarabine anabolism, specifically in converting cytarabine monophosphate into cytarabine diphosphate[4]. Elevated UMP levels may indicate reduced phosphorylation by UMP/CMP kinase, potentially resulting in decreased activation of cytarabine. We therefore hypothesize lower UMP/CMP kinase activity in patients who did not achieve CR. This hypothesis is supported by prior work showing that modulation of UMP/CMP kinase through overexpression or downregulation impacts the anabolism of anticancer pyrimidine analogs[19]. Specifically, downregulation of UMP/CMP kinase reduced formation of triphosphate metabolites, including cytarabine, leading to decreased cellular sensitivity to these cytotoxic analogs[19].
Thirdly, we observed decreased AMP levels in PBMC and lower AMP/ATP and (AMP + ADP)/ATP ratios in both PBMC and BMMC from patients in the no CR population. These ratios are key indicators of cellular energy status and regulators of AMPK activity[20]. AMPK is a master regulator of cellular metabolism, activated by phosphorylation in response to increased AMP/ATP or (AMP + ADP)/ATP ratios due to reduced cellular energy. Once activated, AMPK promotes catabolic processes (e.g., glucose uptake, glycolysis, fatty acid oxidation, and autophagy) and inhibits anabolic processes (e.g., protein, lipid, and glycogen synthesis) to restore energy homeostasis[20]. AMPK is also activated by chemotherapeutic agents such as cytarabine and doxorubicin[8,21], and its activation has been associated with enhanced chemosensitivity in AML[8,22]. For instance, Ghiraldeli et al. demonstrated that AMPK-deficient AML cells exhibited increased resistance to cytarabine and doxorubicin. Moreover, low PRKAA1 expression (coding the α-subunit of AMPK) in AML patients was associated with significantly shorter survival. Conversely, AICAR, an AMP mimetic that activates AMPK, sensitized AML cells to doxorubicin[8]. Our findings suggest that in patients who failed to achieve CR, insufficient AMP/ATP ratios may lead to suboptimal AMPK activation, impairing the efficacy of frontline intensive chemotherapy. This link to AMPK is plausible, as modulation of AMPK using activators such as AICAR or metformin to enhance chemosensitivity has been described[8]. However, to our knowledge, this is the first study to propose a connection between intracellular nucleotide levels and AMPK-related mechanisms in an in vivo setting.
Previous studies have described associations between the intracellular nucleotide levels, especially dNTP levels and the cytarabine efficacy in vitro. The intracellular dNTP homeostasis is regulated by two antagonistic enzymes named RNR and SAMHD1, known to be involved in cytarabine resistance[5,15,16,23]. RNR promotes dNTP synthesis by catalyzing the reduction of ribonucleotides, thereby increasing intracellular dNTP concentrations. In contrast, SAMHD1 acts as a dNTPase, hydrolyzing dNTPs into deoxynucleosides and triphosphate, thus lowering their intracellular concentration. SAMHD1 also exerts its dNTPase activity on the metabolite cytarabine triphosphate, thus reducing cytarabine efficacy. The interplay between the two enzymes is important for the efficacy of cytarabine[5]. Over the last decades, it has been shown that inhibition of RNR led to reduced dNTP levels, increased cytarabine incorporation into DNA and enhanced cytotoxic effects[15,16]. More recently, Rudd et al. have demonstrated that the enhancement of cytarabine efficacy induced by RNR inhibitors implicates an indirect reduction of the activity of SAMHD1. This occurs because RNR inhibition causes a dNTP pool imbalance, specifically an inversion of the dCTP/dATP ratio. This altered ratio leads to a switch in the dNTP occupying SAMHD1’s allosteric site AS2. Since dCTP does not activate SAMHD1, cytarabine triphosphate accumulates, increasing its cytotoxic effect[5]. In addition, Grem et al. showed that reduced CTP and dCTP levels induced by an inhibition of the CTP synthase led to increased intracellular cytarabine anabolites levels and incorporation into DNA[17]. However, in our study, we did not observe a significant difference in intracellular dCTP, dGTP or CTP levels between CR and no CR populations. We were not able to compare the dCTP/dATP ratio between the two populations because dATP was not detected in both PBMC and BMMC samples. This discrepancy may come from differences between in vitro and in vivo conditions, including microenvironmental influences and tissue-level interactions. Notably, reported in vitro intracellular CTP and dCTP levels are approximately 10-fold higher than ours in vivo[17]. In other works, the link between the nucleotide metabolism and the frontline intensive chemotherapy efficacy has been established through mRNA expression analysis of enzymes of the nucleotide metabolism. Lower dCK and higher CDA and cN-II mRNA expression were associated with a lower efficacy of cytarabine or shorter overall survival and disease-free survival[4,7]. In the present work, we did not assess enzyme expression directly. While enzymatic activity can sometimes be indirectly estimated by calculating the ratio of product to substrate, this approach was not feasible here because we did not observe a signal for both substrate and product for each enzyme cited above.
In summary, our findings revealed specific modifications of some intracellular nucleotide levels, primarily involving purines and the energetic status of the cell, in patients who failed to achieve CR. These variations differed by sample type (PBMC vs. BMMC), suggesting metabolic heterogeneity between PB and BM compartments. Such differences may reflect the unique microenvironment contexts of PB and BM, including variations in nutrient availability that affect nucleotide synthesis[24].
The current study presents some limitations. The sample size of this study (n = 70 AML patients) may be considered relatively small; however, as noted above, this was a prospective pilot study, the first to explore the association between nucleotides and primary resistance to frontline AML chemotherapy using an in vivo approach. All patients received induction therapy with cytarabine and an anthracycline, although treatment protocols were not strictly identical (daunorubicin or idarubicin, or Vyxeos, gemtuzumab ozogamicin). This heterogeneity could represent a potential confounding factor; however, the type of anthracycline administered was not associated with occurrence of CR [Table 2]. Our study also contributes to the characterization of inter-individual variability in intracellular nucleotide concentrations. The wide range of values observed for each nucleotide [Supplementary Table 1] showed substantial variability across individuals, which was accounted for in the statistical analysis through the use of non-parametric tests. Given these limitations, the findings of this study require confirmation. A larger multicentred clinical trial, including a higher number of patients and combining intracellular nucleotide quantification, expression analyses of key enzymes, and cytogenetic and molecular profiling, is needed to validate these results and to further investigate the mechanistic processes proposed in our work.
In conclusion, this prospective pilot study provides in vivo data linking specific modifications in intracellular nucleotide levels to the efficacy of frontline intensive chemotherapy in AML. Notably, we identified increased levels of GTP and UMP, and reduced levels of AMP and impaired cellular energy status at the time of diagnosis of AML in patients who failed to achieve CR. These findings may suggest that both the intracellular levels of certain nucleotides and the cellular energy status could influence treatment response, potentially through mechanisms involving UMP/CMP kinase and AMPK activation, respectively. As the mechanistic hypotheses proposed in this pilot study rely on nucleotide measurements, future studies should combine these analyses with the assessment of enzyme expression to further investigate these mechanisms. Overall, this study provides a novel perspective on the role of nucleotide metabolism in the frontline intensive chemotherapy resistance in AML, especially through the cellular energy status.
DECLARATIONS
Authors’ contributions
Design of the study and methodology: Heiblig M, Dumontet C, Thomas X, Guitton J, Machon C
Investigation: Heiblig M, Plesa A, Perrial E, Machon C
Formal analysis: Dronne MA, Machon C
Writing the original draft: Heiblig M, Dronne MA, Machon C
Manuscript revision: Dumontet C, Thomas X, Guitton J
Supervision: Dumontet C
Availability of data and materials
The raw data supporting the conclusions of this article will be made available by the authors on request.
Financial support and sponsorship
None.
Conflicts of interest
All authors declared that there are no conflicts of interest.
Ethical approval and consent to participate
The study was conducted following ethical approval delivered by the French ethics committee (Comité de Protection des Personnes) on June 6, 2017 (No. 30/17_3). It was registered on ClinicalTrials.gov under the identifier NCT03234985. After receiving written information about the study and discussing any questions with the investigator, patients provided informed consent prior to enrolment.
Consent for publication
Not applicable.
Copyright
© The Author(s) 2026.
Supplementary Materials
REFERENCES
1. Gurnari C, Pagliuca S, Visconte V. Deciphering the therapeutic resistance in acute myeloid leukemia. Int J Mol Sci. 2020;21:8505.
2. Liu F, Wang H, Liu J, et al. A favorable inductive remission rate for decitabine combined with chemotherapy as a first course in < 60-year-old acute myeloid leukemia patients with myelodysplasia syndrome features. Cancer Med. 2019;8:5108-15.
3. Sobas MA, Turki AT, Ramiro AV, et al. Outcomes with intensive treatment for acute myeloid leukemia: an analysis of two decades of data from the HARMONY Alliance. Haematologica. 2025;110:1126-40.
4. Abraham A, Varatharajan S, Karathedath S, et al. RNA expression of genes involved in cytarabine metabolism and transport predicts cytarabine response in acute myeloid leukemia. Pharmacogenomics. 2015;16:877-90.
5. Rudd SG, Tsesmetzis N, Sanjiv K, et al. Ribonucleotide reductase inhibitors suppress SAMHD1 ara-CTPase activity enhancing cytarabine efficacy. EMBO Mol Med. 2020;12:e10419.
6. Yamauchi T, Negoro E, Kishi S, et al. Intracellular cytarabine triphosphate production correlates to deoxycytidine kinase/cytosolic 5’-nucleotidase II expression ratio in primary acute myeloid leukemia cells. Biochem Pharmacol. 2009;77:1780-6.
7. Galmarini CM, Thomas X, Graham K, et al. Deoxycytidine kinase and cN-II nucleotidase expression in blast cells predict survival in acute myeloid leukaemia patients treated with cytarabine. Br J Haematol. 2003;122:53-60.
8. Ghiraldeli L, Anderson R, Pladna K, Pardee TS. Adenosine monophosphate activated protein kinase (AMPK) enhances chemotherapy response in acute myeloid leukemia (AML). Cancer Lett. 2022;535:215659.
9. Döhner H, Wei AH, Appelbaum FR, et al. Diagnosis and management of AML in adults: 2022 recommendations from an international expert panel on behalf of the ELN. Blood. 2022;140:1345-77.
10. Ferrell PB Jr, Diggins KE, Polikowsky HG, Mohan SR, Seegmiller AC, Irish JM. High-dimensional analysis of acute myeloid leukemia reveals phenotypic changes in persistent cells during induction therapy. PLoS One. 2016;11:e0153207.
11. Machon C, Jordheim LP, Puy JY, Lefebvre I, Dumontet C, Guitton J. Fully validated assay for the quantification of endogenous nucleoside mono- and triphosphates using online extraction coupled with liquid chromatography-tandem mass spectrometry. Anal Bioanal Chem. 2014;406:2925-41.
12. Lo Presti C, Fauvelle F, Jacob MC, Mondet J, Mossuz P. The metabolic reprogramming in acute myeloid leukemia patients depends on their genotype and is a prognostic marker. Blood Adv. 2021;5:156-66.
13. Li YC, Shih YH, Chen TC, et al. Redefining remission induction chemotherapy ineligibility by early mortality in de novo acute myeloid leukemia. J Clin Med. 2021;10:5768.
14. Schneider C, Oellerich T, Baldauf HM, et al. SAMHD1 is a biomarker for cytarabine response and a therapeutic target in acute myeloid leukemia. Nat Med. 2017;23:250-5.
15. Chen P, Aimiuwu J, Xie Z, et al. Biochemical modulation of aracytidine (Ara-C) effects by GTI-2040, a ribonucleotide reductase inhibitor, in K562 human leukemia cells. AAPS J. 2011;13:131-40.
16. Iwasaki H, Huang P, Keating MJ, Plunkett W. Differential incorporation of ara-C, gemcitabine, and fludarabine into replicating and repairing DNA in proliferating human leukemia cells. Blood. 1997;90:270-8.
17. Grem JL, Allegra CJ. Enhancement of the toxicity and DNA incorporation of arabinosyl-5-azacytosine and 1-beta-D-arabinofuranosylcytosine by cyclopentenyl cytosine. Cancer Res. 1990;50:7279-84.
18. Stockard B, Bhise N, Shin M, et al. Cellular metabolomics profiles associated with drug chemosensitivity in AML. Front Oncol. 2021;11:678008.
19. Liou JY, Lai HR, Hsu CH, et al. Modulation of human UMP/CMP kinase affects activation and cellular sensitivity of deoxycytidine analogs. Biochem Pharmacol. 2010;79:381-8.
21. Ji C, Yang B, Yang YL, et al. Exogenous cell-permeable C6 ceramide sensitizes multiple cancer cell lines to Doxorubicin-induced apoptosis by promoting AMPK activation and mTORC1 inhibition. Oncogene. 2010;29:6557-68.
22. Sujobert P, Poulain L, Paubelle E, et al. Co-activation of AMPK and mTORC1 induces cytotoxicity in acute myeloid leukemia. Cell Rep. 2015;11:1446-57.
23. Zhang X, Jia A, You J, et al. Purine metabolites regulate leukemic cell sensitivity toward cytarabine. Haematologica. 2025;110:1170-6.
Cite This Article
How to Cite
Download Citation
Export Citation File:
Type of Import
Tips on Downloading Citation
Citation Manager File Format
Type of Import
Direct Import: When the Direct Import option is selected (the default state), a dialogue box will give you the option to Save or Open the downloaded citation data. Choosing Open will either launch your citation manager or give you a choice of applications with which to use the metadata. The Save option saves the file locally for later use.
Indirect Import: When the Indirect Import option is selected, the metadata is displayed and may be copied and pasted as needed.
About This Article
Copyright

Data & Comments
Data
0


Comments
Comments must be written in English. Spam, offensive content, impersonation, and private information will not be permitted. If any comment is reported and identified as inappropriate content by OAE staff, the comment will be removed without notice. If you have any queries or need any help, please contact us at [email protected].