
fig4
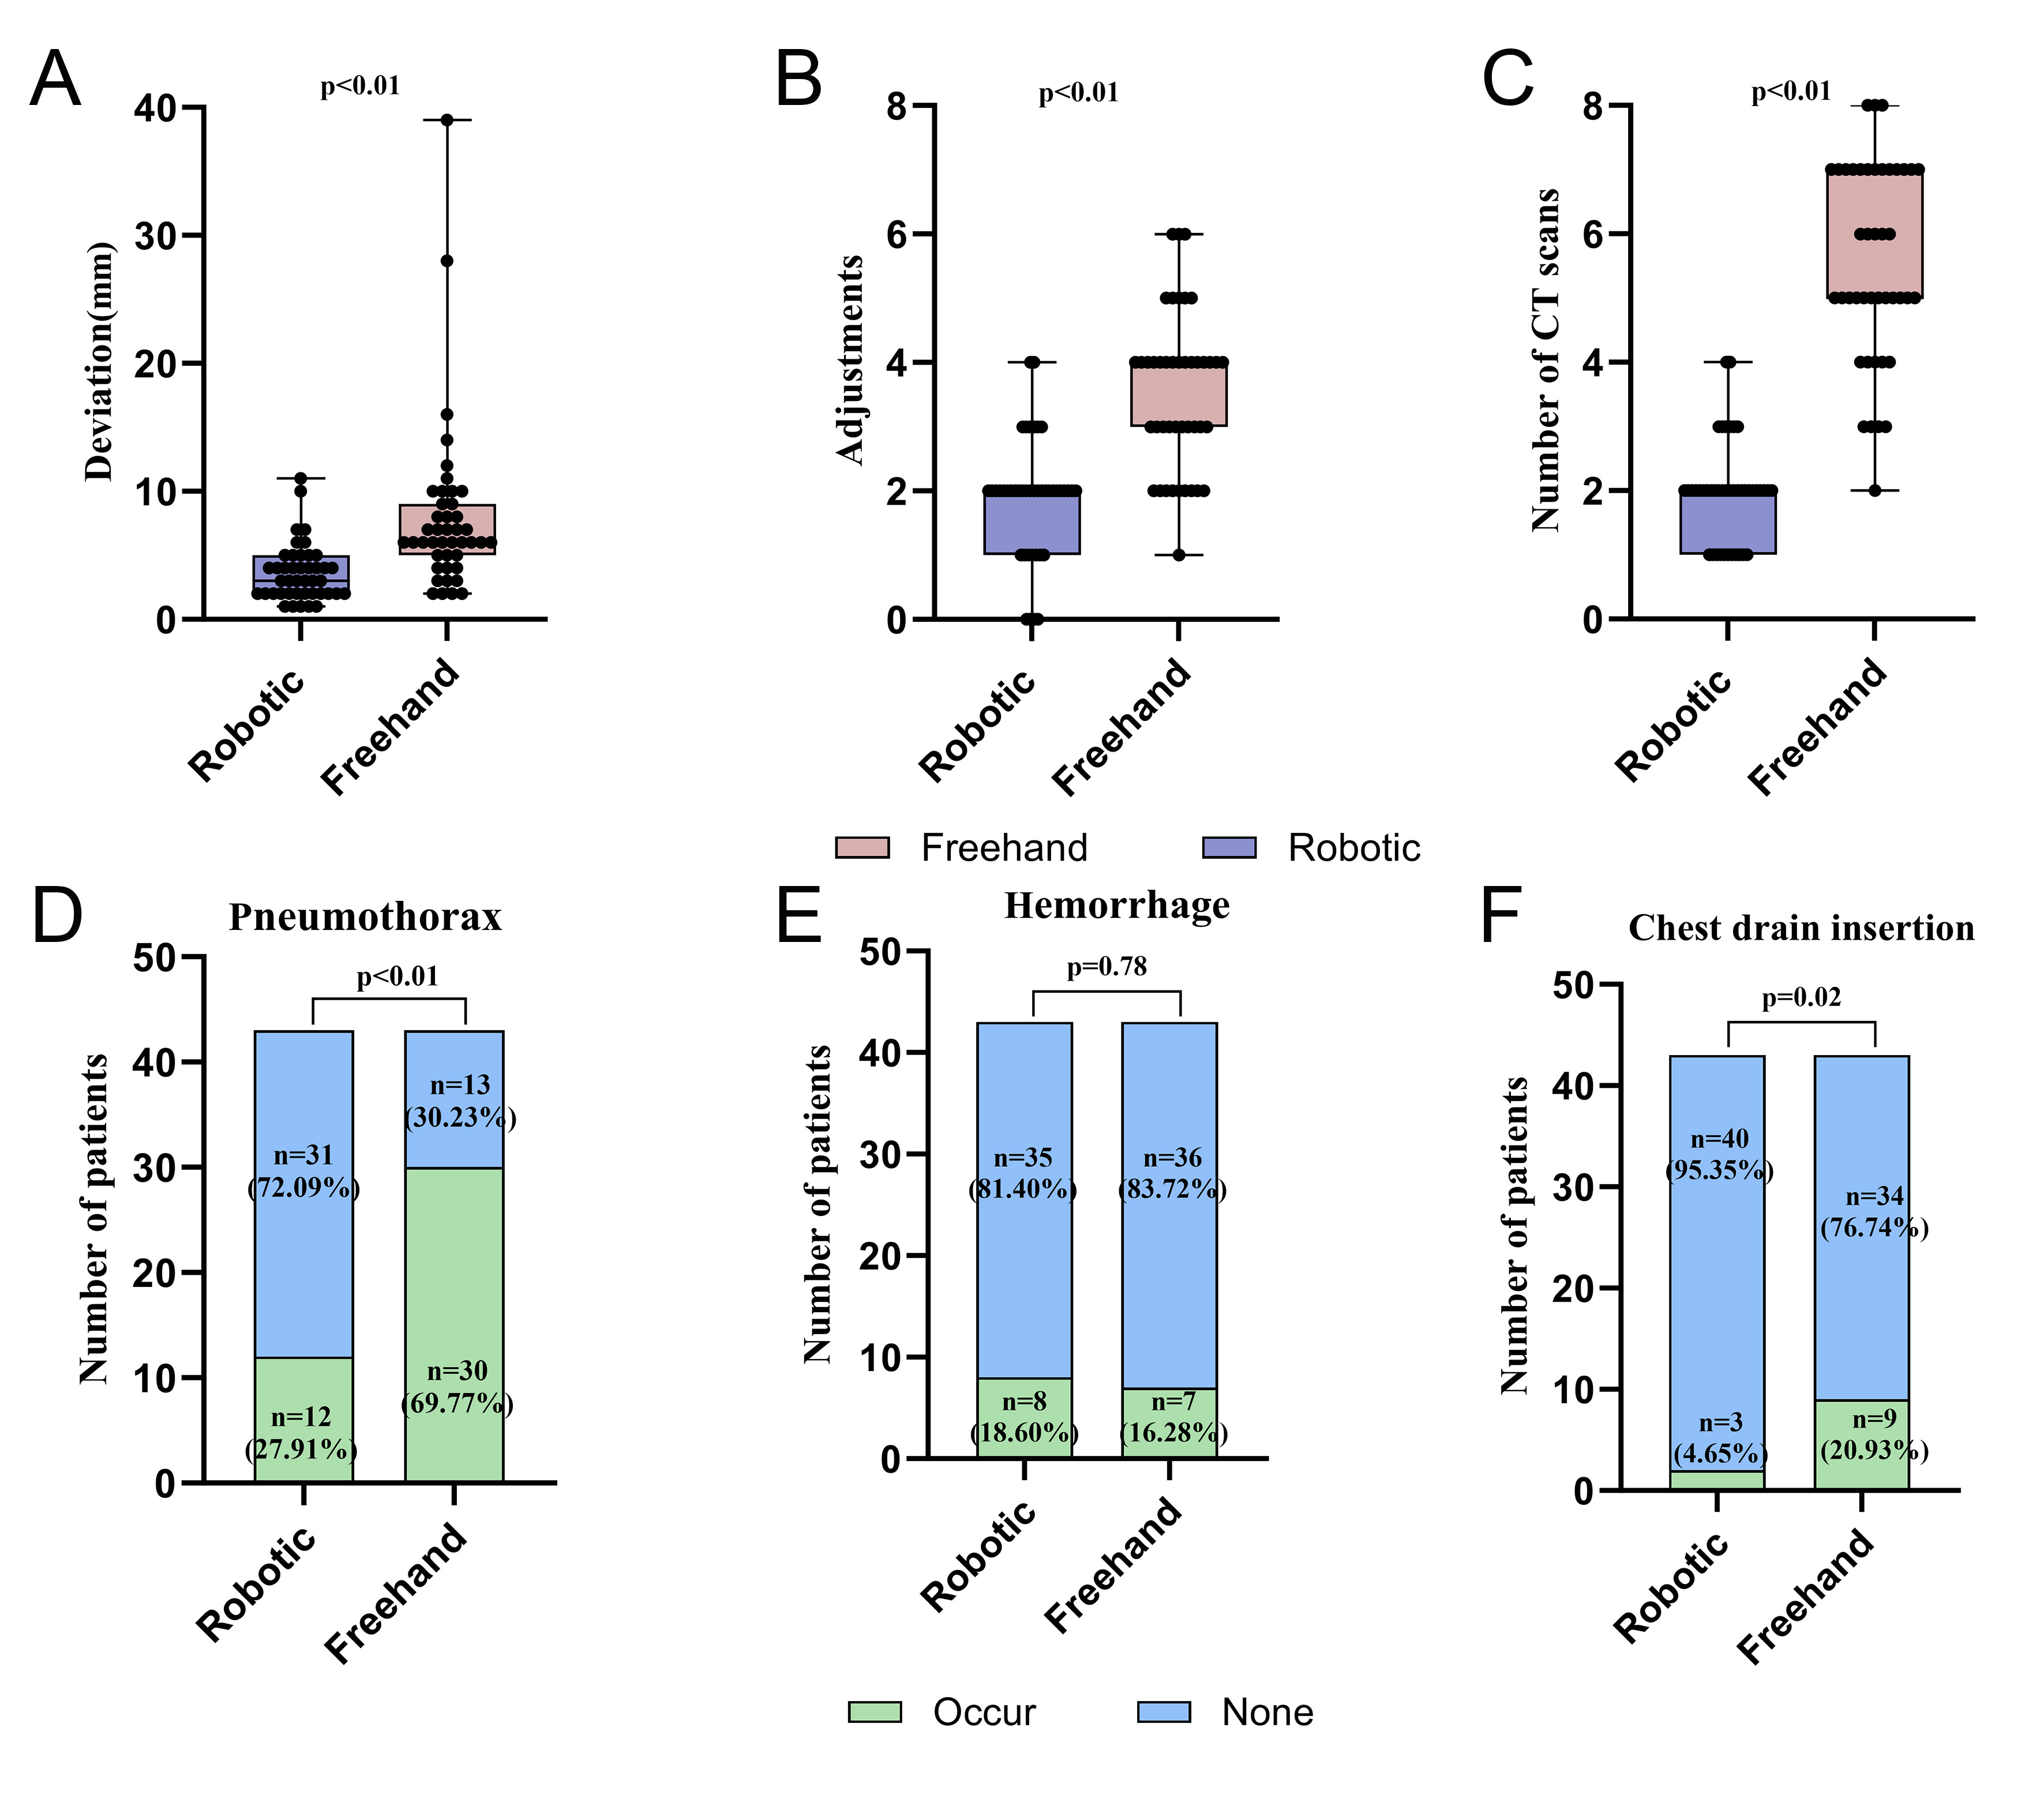
Figure 4. Efficiency comparison of robotic-assisted vs. freehand puncture for CT-guided MWA after PSM. (A) Puncture deviation; (B) Number of CT scans; (C) Number of needle adjustments; (D) Pneumothorax; (E) Hemorrhage; (F) Chest drain insertion. For (A)-(C), data are presented as median [IQR], and P values were calculated using the Mann-Whitney U test; scatter plots represent individual values. For (D)-(F), data are presented as incidence rates, and P values were calculated using the chi-square test or Fisher’s exact test as appropriate; bars display exact numerical proportions within each group. IQR: Interquartile ranges; MWA: microwave ablation; CT: computed tomography.