
fig2
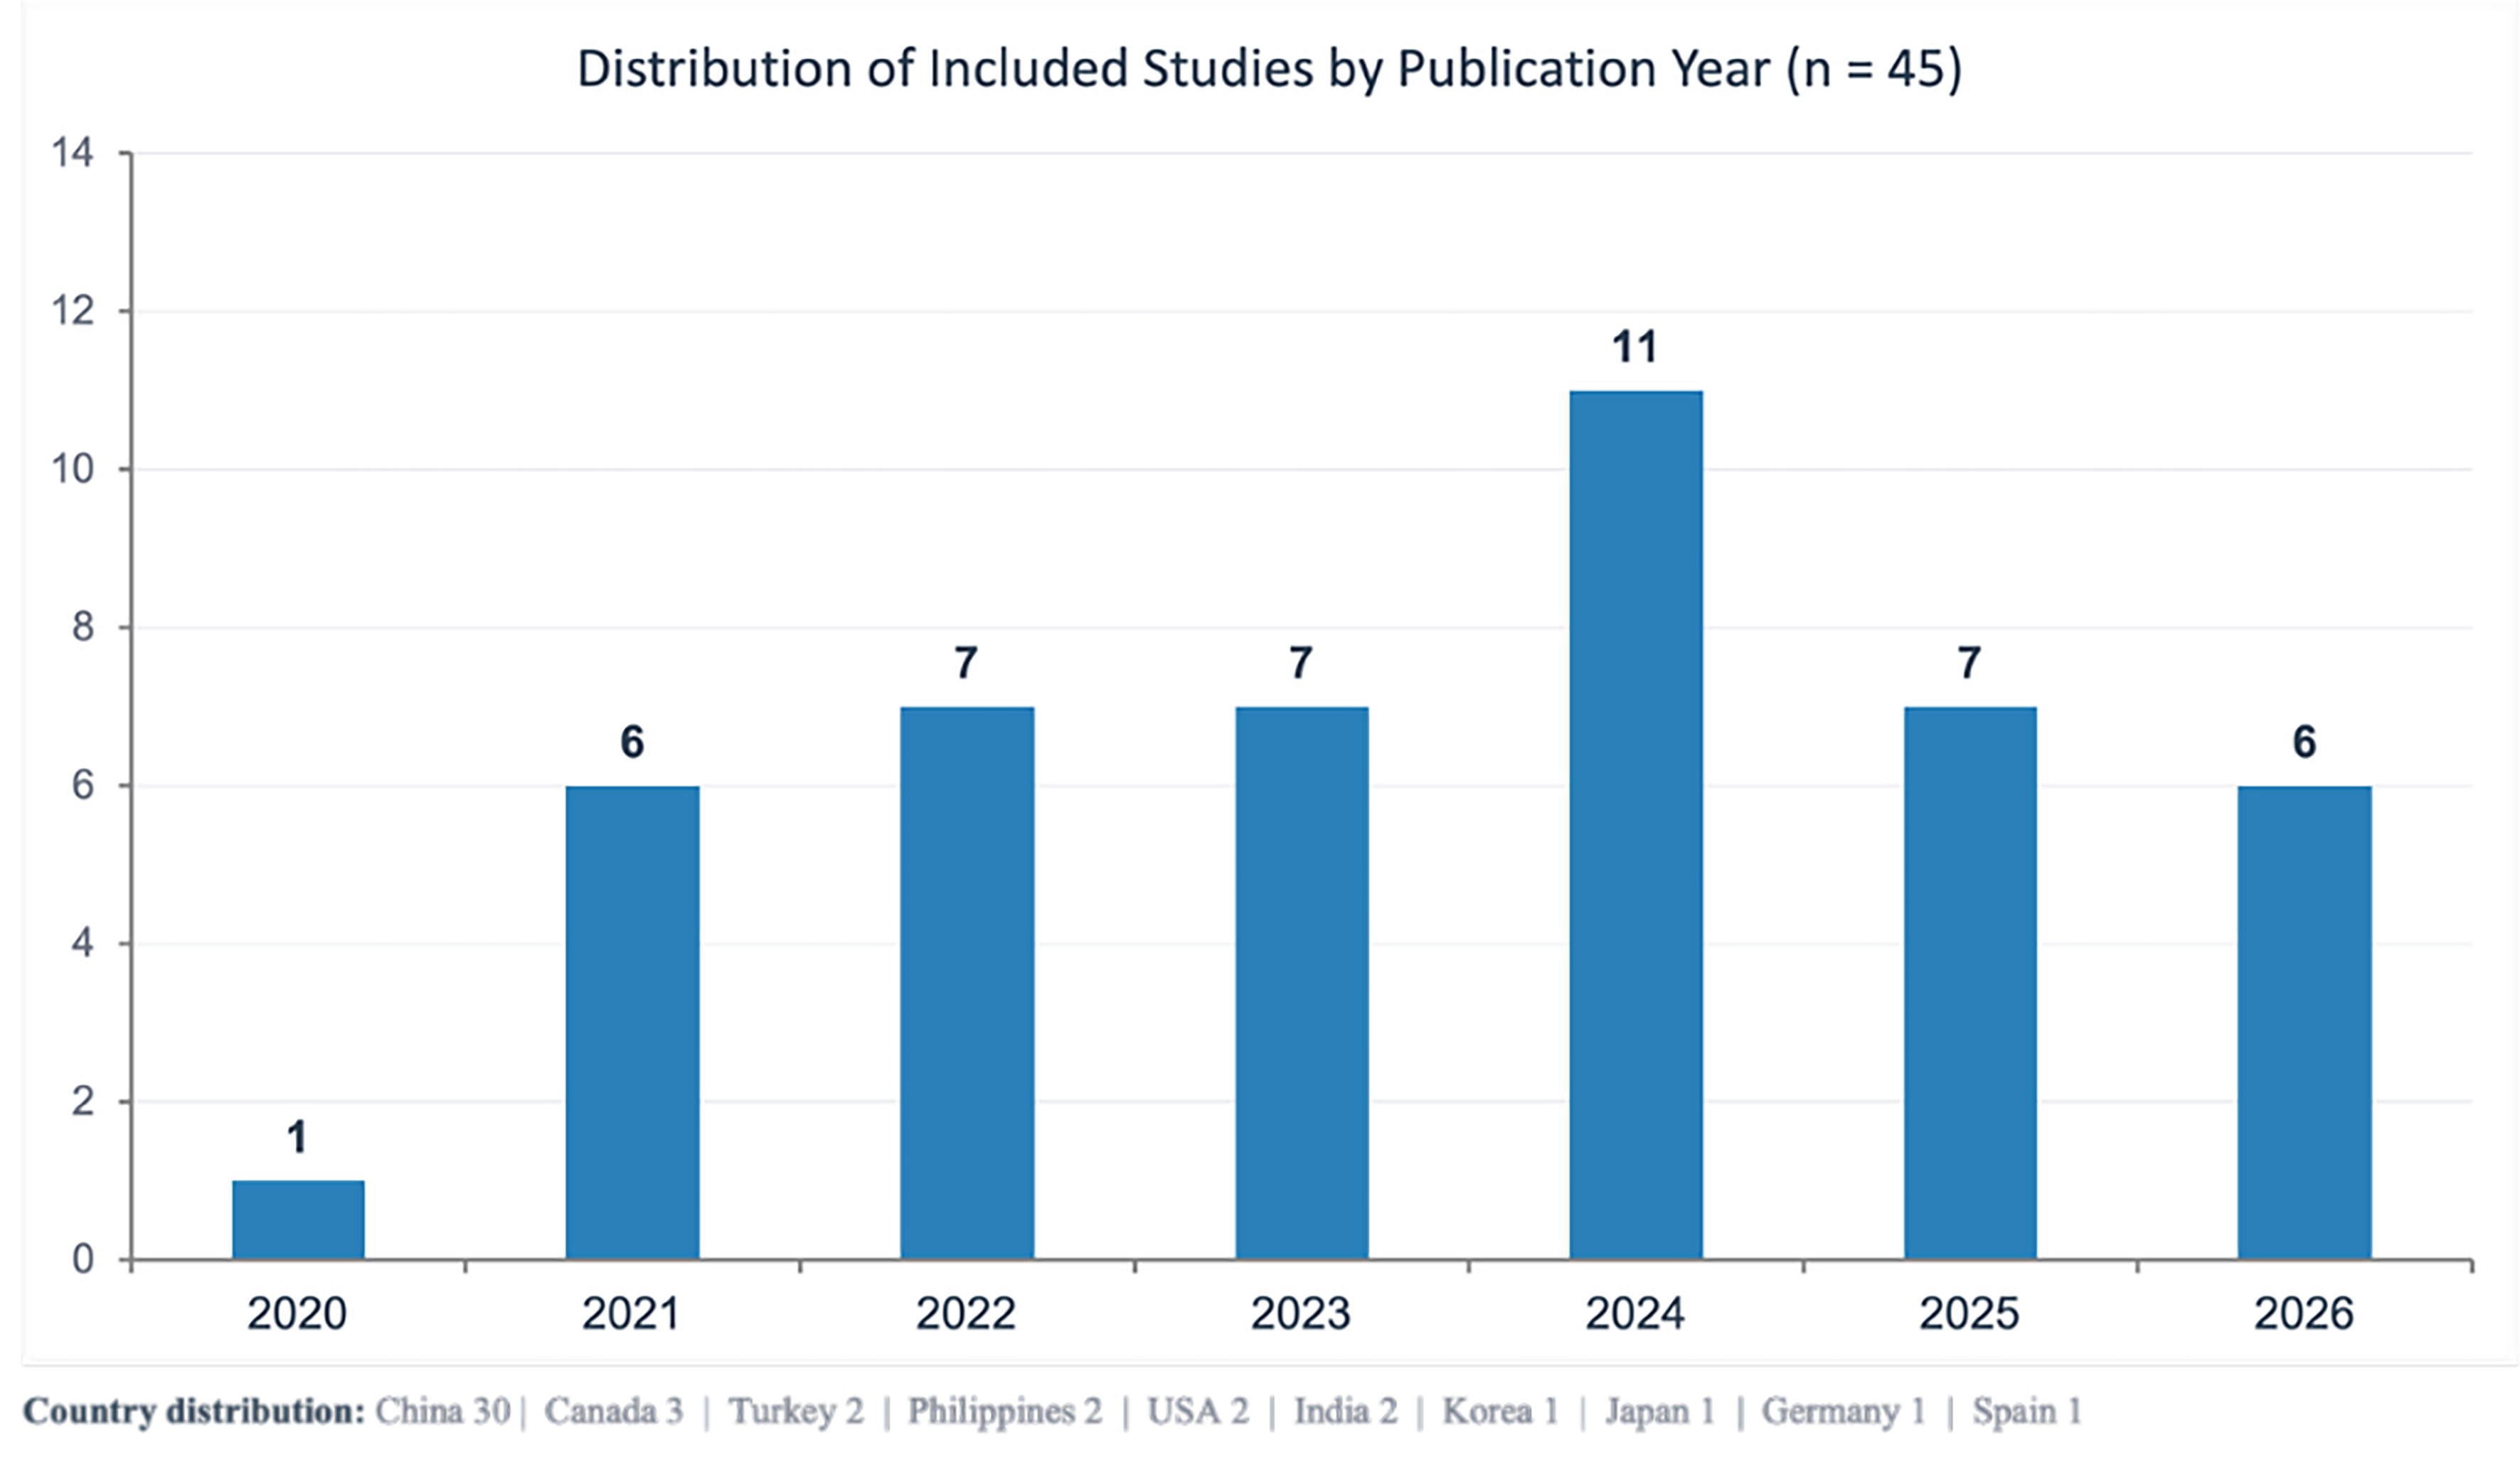
Figure 2. Distribution of included studies by publication year. Bar chart showing the number of included studies (n = 45) published each year from 2020 to 2026. The country distribution of the included studies is provided at the bottom.
Figure 2. Distribution of included studies by publication year. Bar chart showing the number of included studies (n = 45) published each year from 2020 to 2026. The country distribution of the included studies is provided at the bottom.


All published articles will be preserved here permanently:
https://www.portico.org/publishers/oae/ All published articles will be preserved here permanently:
https://www.portico.org/publishers/oae/