
fig3
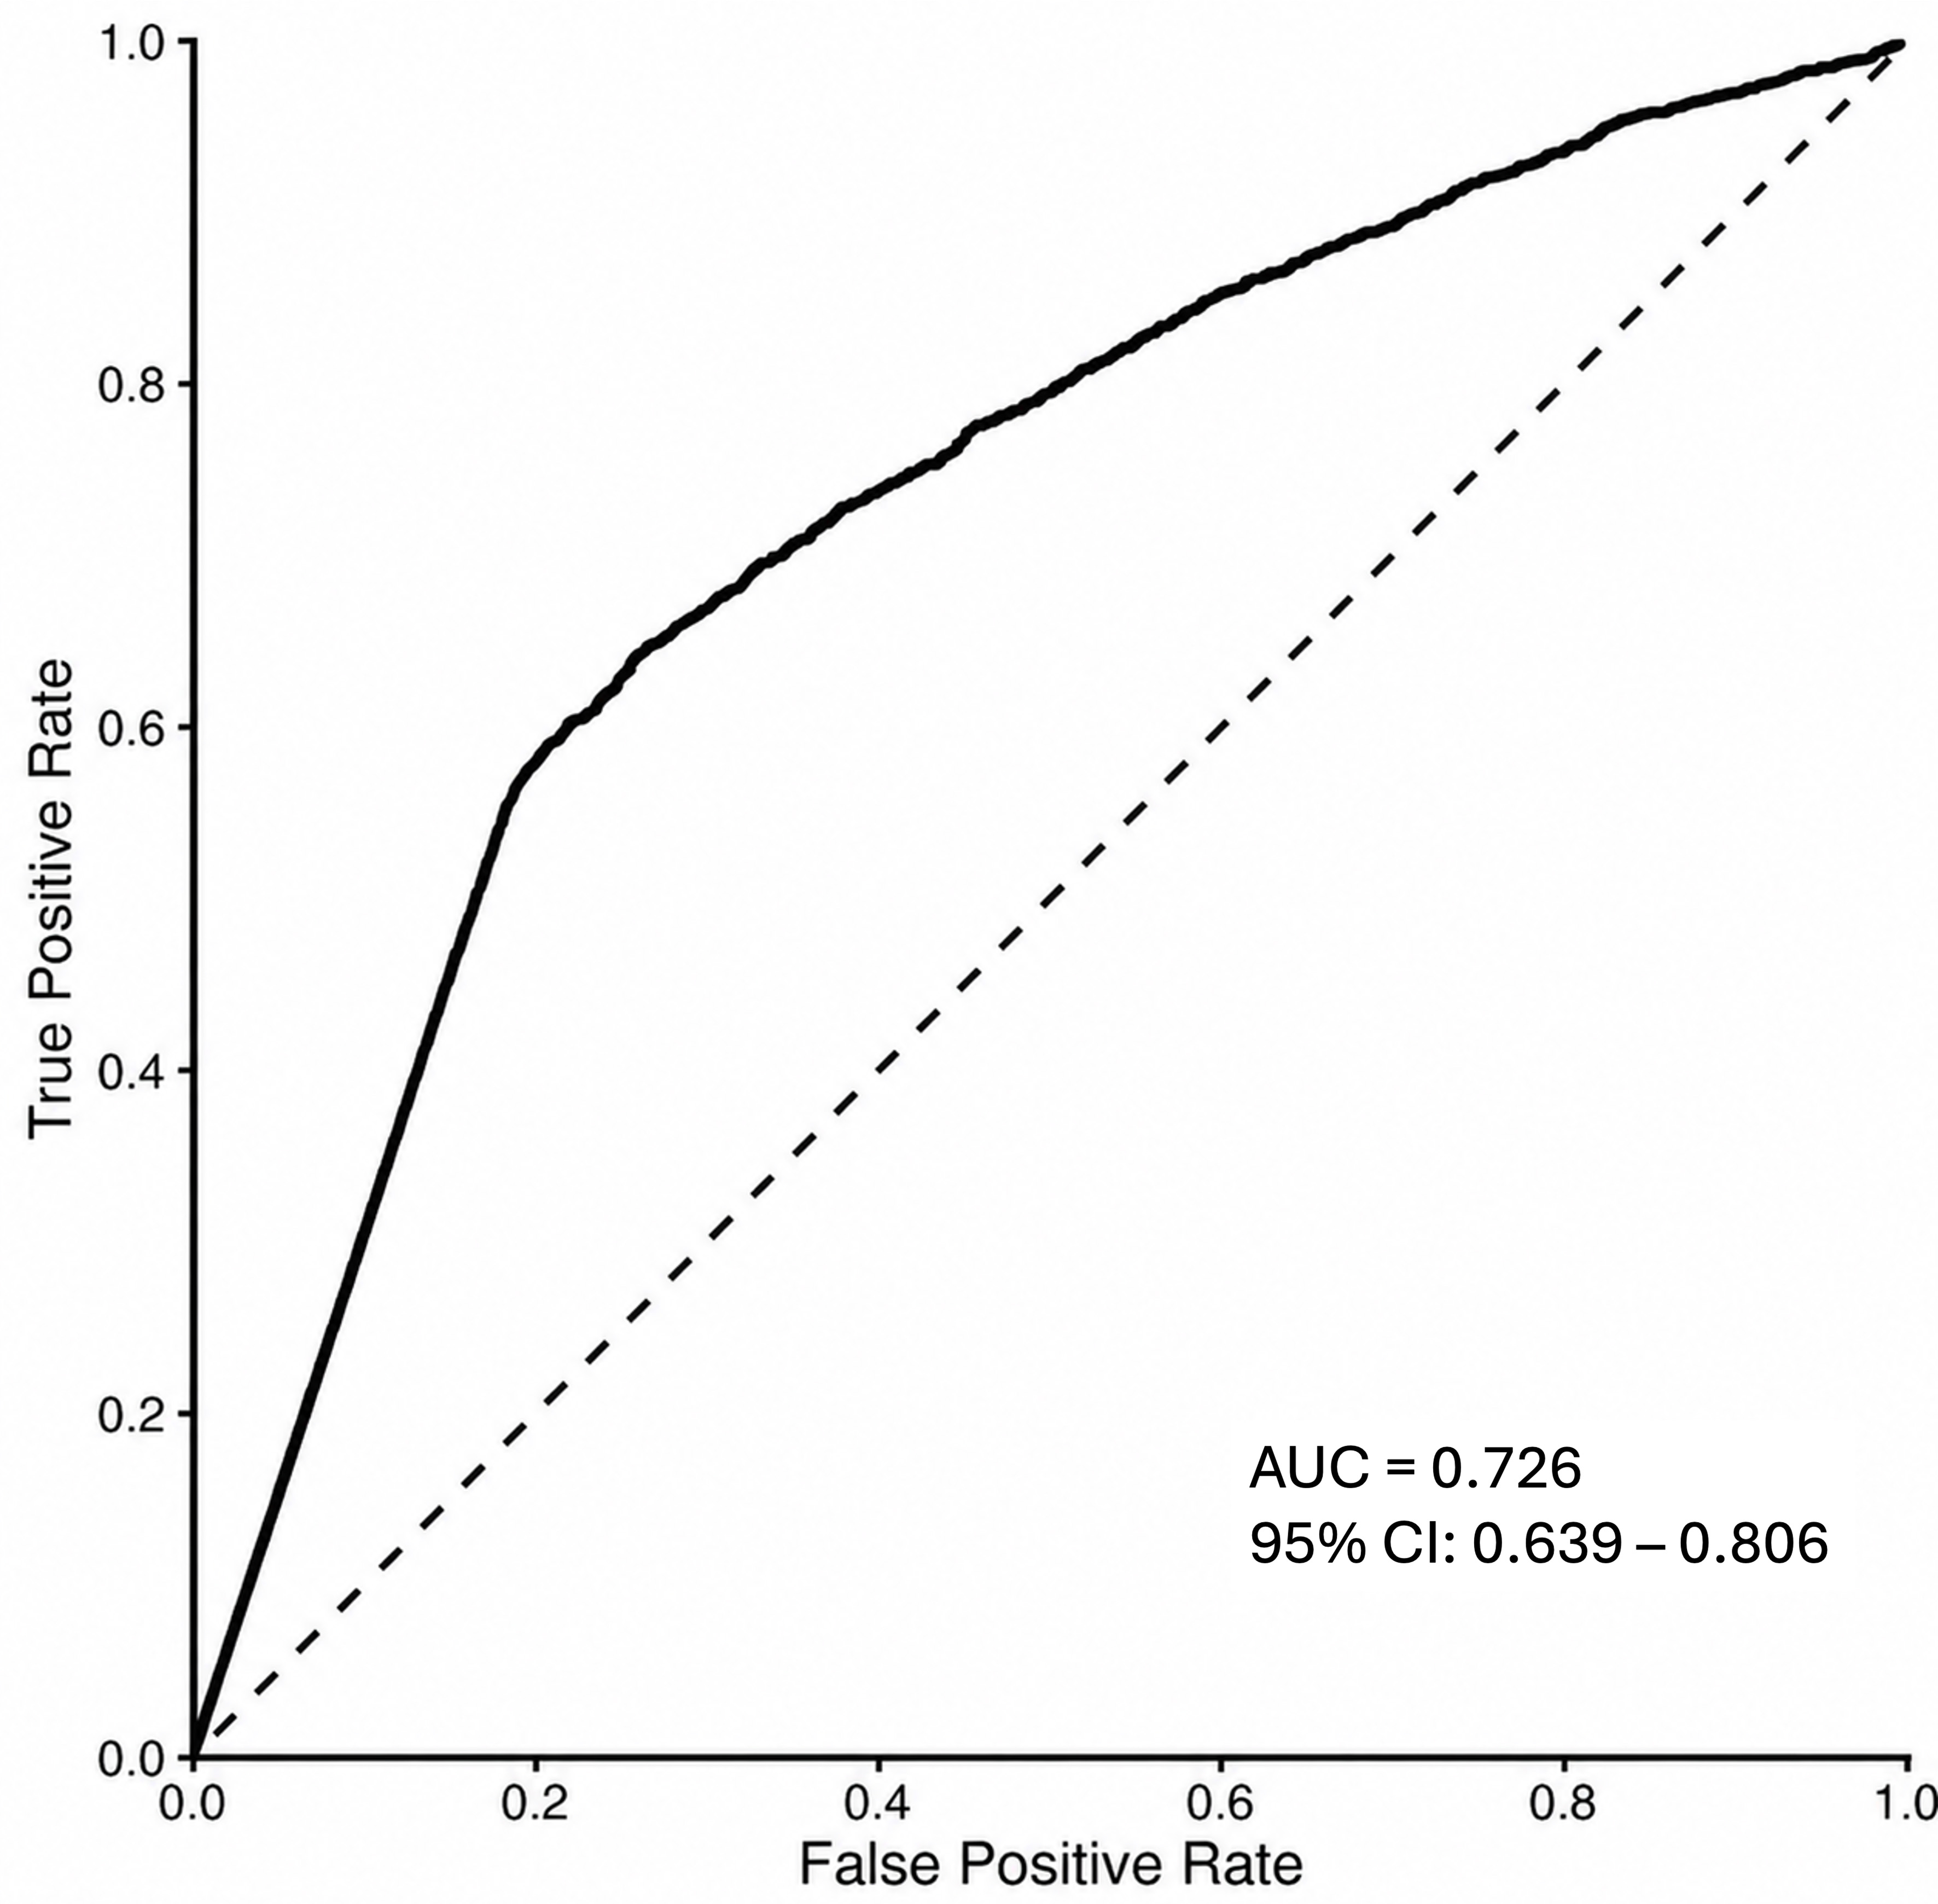
Figure 3. Pooled OOF ROC curve based on 6,984 frame-level predictions from 92 patients across the 10 folds of the patient-stratified cross-validation. The pooled frame-level AUC was 0.726 (95%CI: 0.639-0.806). Each prediction was generated while the corresponding patient was part of the held-out test fold. AUC: Area under the curve; OOF: out-of-fold; ROC: receiver operating characteristic.