


Gd-EOB-DTPA-enhanced MRI radiological and deep learning radiomics models for predicting dual-phenotype hepatocellular carcinoma and patient prognosis
 0
0  ,
, Abstract
Aim: To develop a deep learning radiomics (DLR) model based on Gd-EOB-DTPA- enhanced magnetic resonance imaging for preoperative prediction of dual-phenotype hepatocellular carcinoma (DPHCC) and patient prognosis.
Methods: This study included 331 patients from two centers: 228 in the training cohort (center I, 93 DPHCC, 135 non-DPHCC) and 103 in the external validation cohort (center II, 47 DPHCC, 56 non-DPHCC). Conventional radiological features were analyzed to build a radiological model. In total, 1,316 radiomics features and 768 deep learning (DL) features were extracted from the volumes of interest in arterial phase (AP), portal venous phase (PP), and hepatobiliary phase images, respectively. Three machine learning classifiers were applied to develop radiomics, DL, and DLR models using single-phase and combined-phase (CP) data for DPHCC prediction. Recurrence-free survival (RFS) was assessed by the Kaplan-Meier method.
Results: In the external validation cohort, rim AP hyperenhancement and non-smooth tumor margins were independent predictors of DPHCC (both P < 0.05), yielding a radiological model with an area under the curve (AUC) of 0.607 [95% confidence interval (CI), 0.511-0.704]. Among radiomics and DL models, the PP-DLR model achieved the highest discrimination (AUC: 0.805; 95%CI, 0.722-0.887), outperforming the radiological model, PP-Radiomics (AUC: 0.714; 95%CI, 0.615-0.813), CP-Radiomics (AUC: 0.639; 95%CI, 0.532-0.746), and CP-DLR models (AUC: 0.650; 95%CI, 0.543-0.758) (all P < 0.05). Patients classified as DPHCC by the PP-DLR model had significantly shorter median RFS than those classified as non-DPHCC (P < 0.05).
Conclusion: The PP-DLR model, which integrates radiomics and DL features, may aid in the preoperative prediction of DPHCC. DPHCC may be associated with poorer postoperative outcomes.
Keywords
INTRODUCTION
WHO (World Health Organization) recognizes three principal entities within primary liver cancer: hepatocellular carcinoma (HCC), intrahepatic cholangiocarcinoma (ICCA), and combined hepatocellular-cholangiocarcinoma[1]. Among these, HCC is the predominant form and the third leading cause of cancer mortality globally[2]. Histologically, HCC originates from hepatic parenchymal cells and characteristically expresses hepatocyte-specific biomarkers such as Hepatocyte Paraffin-1 (HepPar-1). ICCA, in contrast, arises from biliary epithelial cells and tests positive for cholangiocyte-associated markers, including cytokeratin 19 (CK19) and cytokeratin 7 (CK7)[3].
In clinical practice, HCC has been found to be heterogeneous in pathobiological patterns[4]. A distinct subtype, dual-phenotype hepatocellular carcinoma (DPHCC), has attracted increasing attention[5]. DPHCC displays the typical morphological appearance of HCC but coexpresses both hepatocyte and cholangiocyte markers in some tumor cells[6,7]. CK19 expression, commonly used as a marker of biliary differentiation, is an important molecular feature of DPHCC and has been associated with drug resistance and sensitivity[8,9]. Because of its dual biological features, DPHCC shows biphenotypic expression of both hepatic and biliary markers. CK19 overexpression correlates with enhanced tumor aggressiveness and metastatic potential[10,11], and HCC expressing cholangiocyte markers carries a substantially higher risk of recurrence and metastasis than monophenotypic HCC. Currently, DPHCC can only be diagnosed by postoperative immunohistochemical examination[6]. Because DPHCC and non-DPHCC share overlapping imaging findings and clinical profiles, differentiation based on imaging alone is challenging[12]. Reliable, non-invasive preoperative approaches to identify this aggressive subtype are therefore needed.
Gadolinium-ethoxybenzyl-diethylenetriamine pentaacetic acid (Gd-EOB-DTPA)-enhanced magnetic resonance imaging (MRI) is widely used for evaluating hepatobiliary lesions[13]. Several studies have attempted to predict DPHCC using preoperative imaging. Radiological features such as persistent enhancement and targetoid appearance on diffusion-weighted imaging (DWI) have been reported as potentially useful for identifying DPHCC[14]. Although quantitative radiomics features have been applied to DPHCC prediction, there is still no clear standard for preoperative imaging diagnosis. Thus, stronger evidence and more objective methods are needed.
Over the past decades, quantitative and qualitative imaging analyses have been increasingly applied in oncology. Radiomics and deep learning (DL) have shown value in characterizing HCC subtypes and predicting survival outcomes[15]. Recent advances in DL extend beyond the convolutional neural network (CNN) framework to capture long-range spatial dependencies. For instance, a multistage CNN framework has been successfully applied to MRI-based diagnosis of Alzheimer’s disease[16]. Compared with conventional CNNs, which analyze local image regions, the 3D Swin Transformer can integrate volumetric information from the entire tumor, capturing more comprehensive imaging features of tumor heterogeneity. Deep learning radiomics (DLR), which combines radiomics features with DL-derived representations, has demonstrated clinical value in assessing tumor progression and prognosis[17]. To our knowledge, DLR based on Gd-EOB-DTPA-enhanced MRI has not been investigated for preoperative prediction of DPHCC or for evaluating its prognostic implications.
This study aimed to develop a DLR model based on Gd-EOB-DTPA-enhanced MRI to distinguish DPHCC from non-DPHCC preoperatively and to evaluate its prognostic value.
METHODS
Participants
This retrospective study was approved by the institutional review boards of The First Affiliated Hospital of Soochow University (Approval No. 2024-431) and Nantong Third People’s Hospital (EK 2023025), and the requirement for informed consent was waived. A total of 331 HCC patients were included. The training cohort comprised 228 patients from center I (January 2020 to February 2024: 93 DPHCC and 135 non-DPHCC patients). The external validation cohort consisted of 103 patients from center II (January 2019 to July 2023: 47 DPHCC and 56 non-DPHCC patients).
Inclusion criteria were: (1) Gd-EOB-DTPA-enhanced MRI examination within two weeks before surgery, and (2) pathologically and immunohistochemically confirmed DPHCC or non-DPHCC [Figures 1 and 2]. Exclusion criteria were: (1) any history of anti-tumor therapy prior to surgery, (2) suboptimal image quality precluding reliable interpretation, or (3) incomplete clinical or pathological data. For patients with multiple lesions, only the largest one was analyzed.
Figure 1. Representative MRI images with corresponding histopathological findings from a DPHCC case. (A) T2WI image showing slightly heterogeneous high signal intensity; (B) DWI image (b = 800 s/mm2) showing marginal ring-like high signal intensity; (C) Arterial phase image showing marginal circular enhancement with intratumoral vascularity and central low signal intensity; (D) Portal venous phase image showing persistent peripheral enhancement; (E) Hepatobiliary phase image showing low signal intensity; (F) Immunohistochemical staining (original magnification 100×) showing CK19 (+). MRI: Magnetic resonance imaging; DPHCC: dual-phenotype hepatocellular carcinoma; T2WI: T2-weighted imaging; DWI: diffusion-weighted imaging; CK19: cytokeratin 19.
Figure 2. Representative MRI images with corresponding histopathological findings from a non-DPHCC case. (A) T2WI image showing slightly inhomogeneous high signal intensity; (B) DWI image (b = 800 s/mm2) showing high signal mass; (C) Arterial phase image showing moderate inhomogeneous enhancement; (D) Portal venous phase image showing mild decreased enhancement; (E) Hepatobiliary phase image showing low signal intensity; (F) Immunohistochemical staining (original magnification 100×) showing CK19 (-). MRI: Magnetic resonance imaging; DPHCC: dual-phenotype hepatocellular carcinoma; T2WI: T2-weighted imaging; DWI: diffusion-weighted imaging; CK19: cytokeratin 19.
All baseline clinical characteristics were collected from medical records, including age, gender, cirrhosis, tumor diameter, tumor number, hepatitis B virus (HBV) status, alpha-fetoprotein (AFP), alanine aminotransferase (ALT), aspartate aminotransferase (AST), and gamma-glutamyl transferase (GGT).
Histopathology and Immunohistochemistry
Two experienced pathologists independently reviewed and evaluated all available histological samples. DPHCC pathological diagnostic criteria were as follows: (1) immunohistochemically, at least one hepatocyte marker (such as HepPar-1) showed strong positive expression in more than 15% of the tumor cells, mainly in a diffuse distribution; (2) at least one cholangiocyte marker (such as CK19) and at least one hepatocyte marker were coexpressed in more than 15% of the tumor cells; (3) patients were excluded from the DPHCC group if the tumor contained any independent HCC or ICCA component (regardless of the presence of a transition zone) or if tumor cells did not simultaneously express both HCC and ICCA markers. The 15% cutoff for cholangiocyte marker positivity was adopted from the original definition of Lu et al. [5], this threshold was considered to balance sensitivity and specificity for identifying tumors with dual-phenotype features.
Postoperative follow-up
After curative resection, all patients underwent regular surveillance for HCC recurrence. This included serum AFP measurement, liver function tests, and abdominal imaging (ultrasound, contrast-enhanced CT or MRI) within the first postoperative month and subsequently at 3 to 6 month intervals. Recurrence-free survival (RFS) was defined as the interval from the date of surgery to the date of tumor recurrence, death from any cause, or last follow-up. The censored follow-up date was February 2024. For patients lost to follow-up, survival time was calculated from the date of surgery to the date of last available follow-up.
MR imaging acquisition
Abdominal MRI was performed using a Siemens Magnetom Skyra 3.0-T MRI scanner (Siemens Healthcare, Munich, Germany) and a Philips Achieva 3.0-T MRI scanner (Philips Healthcare, Best, The Netherlands) with a 16-channel phased-array coil. Patients were placed supine, and the scan covered the region from the diaphragmatic dome to the inferior hepatic edge. Detailed scanning sequences and parameters are provided in the Supplementary Materials. For dynamic imaging, Gd-EOB-DTPA (Bayer, Berlin, Germany) was administered via an antecubital vein (0.1 mL/kg body weight), followed by 20 mL of 0.9% saline at 1 mL/s. The images in arterial phase (AP), portal venous phase (PP) and hepatobiliary phase (HBP) were acquired by performing three-dimensional volume interpolated breath-hold examination (3D VIBE) fat suppression T1WI at 20-30 s, 60-70 s, and 20 min after Gd-EOB-DTPA administration, respectively.
Volume of interest identification and segmentation
Tumor regions were manually segmented on AP, PP, and HBP images using the ITK-SNAP platform (www.itksnap.org). All segmentations were performed by a radiologist (3 years of experience) and verified by a senior radiologist (13 years of experience). Interobserver reproducibility was assessed in a randomly selected subset of 30 patients. Two radiologists independently delineated volumes of interest (VOIs) covering the entire tumor manually. Each lesion was carefully examined across all phases to accurately define its boundaries and avoid adjacent non-tumor tissue. The VOIs delineated by the senior radiologist were used for subsequent analysis.
Radiological feature analysis and model construction
All MRI images were interpreted independently by two radiologists with 10 and 13 years of abdominal MRI experience, respectively, who were blinded to histopathology results and other clinical information. Disagreements were resolved by joint review to reach a consensus.
The following radiological features were evaluated according to the definitions in LI-RADS v2018[18]: (a) rim arterial phase hyperenhancement (rim APHE); (b) non-rim arterial phase hyperenhancement (non-rim APHE); (c) peripheral washout; (d) non-peripheral washout; (e) enhancing capsule; (f) tumor margins (0, smooth margins; 1, non-smooth margins); (g) intratumoral hemorrhage; (h) intratumoral fat; (i) necrosis; (j) peritumoral enhancement in the AP; (k) intratumoral vascularity; (l) delayed enhancement; (m) hepatobiliary phase hypointensity; (n) peritumoral hypointensity in HBP; (o) T2-weighted imaging (T2WI) mild-moderate hyperintensity; (p) targetoid diffusion restriction.
Univariate logistic regression analysis was conducted within the training cohort to screen for statistically significant variables (P < 0.05). Significant variables were entered into a multivariate logistic regression analysis using the forward likelihood ratio method to identify independent predictors, which were then used to construct the radiological prediction model for DPHCC.
Radiomics and DL feature extraction and selection
Radiomics features (first-order statistics, shape, and texture) were extracted from each VOI using the Pyradiomics package (https://pyradiomics.readthedocs.io/en/latest/). Radiomics analysis was performed with the open-source FeAture Explorer (FAE) software (https://github.com/salan668/FAE), which supported the complete workflow, including feature extraction, feature matrix preprocessing, model development, and visualization.
For DL feature extraction, 3D tumor-region images were cropped based on the VOIs. A 3D Swin Transformer (swin3d_s, PyTorch 2.5.1) was initialized with Kinetics-400 pre-trained weights and fine-tuned on our 3D MRI data using a partial strategy: only the final stage (Stage 4), the PatchMerging layer, the LayerNorm layer, and the classification head were updated. These deeper layers were responsible for capturing task-specific high-level semantic information and were therefore the most beneficial for adaptation to the target domain. For all subsequent deep feature extraction, the resulting fine-tuned weights were used after removing the classification head, with the fine-tuned backbone serving as the feature extractor. To ensure compatibility with the model input requirements, all images were resized to a uniform dimension. Detailed training parameters and the complete fine-tuning code are provided in the Supplementary Materials and on GitHub (https://github.com/doctoryuxing/DPHCC-Swin3d-classification.git).
Feature selection and model building were performed in FAE. To reduce overfitting and improve model robustness, we applied the following feature selection procedure. Initially, Z-score standardization was performed on the feature matrix by subtracting the respective means and scaling with the corresponding standard deviations. Subsequently, we implemented Pearson correlation analysis for feature selection. Pairwise coefficients between features were computed, with a threshold larger than 0.80 triggering random elimination of one feature from correlated pairs. Lastly, RFE (recursive feature elimination) was used to rank the remaining features according to their predictive ability. The feature number range was set from 1 to 30.
Radiomics, DL, DLR model construction and validation
Based on the selected features, three machine learning classifiers implemented in FAE software, namely logistic regression (LR), logistic regression-least absolute shrinkage and selection operator (LR-Lasso), and support vector machine (SVM), were used for model construction. Radiomics and DL models were built using radiomics and DL features, respectively. The DLR models incorporated both the radiomics and DL features. In total, 36 models were built based on AP, PP, HBP, and combined-phase (CP) images. Model performance was evaluated using 10-fold cross-validation in the training cohort. The study workflow is shown in Figure 3.
Figure 3. Flowchart of the proposed study design. The workflow includes image segmentation, radiological feature analysis, radiomics and deep learning feature extraction and selection, and model development. AP: Arterial phase; PP: portal venous phase; HBP: hepatobiliary phase; rim APHE: rim arterial phase hyperenhancement; 3D: three-dimensional; CAM: class activation mapping.
Statistical analysis
Data processing was performed in R (v4.3.2; https://www.r-project.org/) and SPSS 27.0. Continuous variables were reported as the mean ± standard deviation or median with IQR (interquartile range), while categorical variables were expressed as counts and percentages. Continuous variables were analyzed using either the independent t-test or Mann-Whitney U test based on distribution normality, categorical characteristics were compared with Pearson’s chi-square test. Normality was assessed with the Shapiro-Wilk test. Interobserver agreement for feature extraction was evaluated using the intraclass correlation coefficient (ICC) and categorized as poor (< 0.5), moderate (0.5-0.79), or excellent (≥ 0.8).
Feature correlations were visualized with coefficient matrix heatmaps generated by “ggcorrplot”. Model discrimination was assessed by receiver operating characteristic (ROC) analysis, with AUC values compared by the DeLong test. To assess feature selection stability and overfitting risk, we performed bootstrap resampling (500 iterations) on the training cohort, repeating the entire feature selection pipeline and calculating selection frequency for each feature. Survival probabilities were estimated by the Kaplan-Meier method and compared with the log-rank test. A two-sided P value < 0.05 was considered statistically significant.
RESULTS
Baseline clinical characteristics of patients
The clinical characteristics of patients are presented in Table 1. In the training and external validation cohorts, 40.79% (93/228) and 45.63% (47/103) of patients were confirmed to have DPHCC, respectively [Figure 4]. No statistically significant differences in baseline characteristics were found between the two cohorts except for tumor diameter (P < 0.001). Given that no significant differences were observed in age, sex, cirrhosis, HBV status, ALT, AST, GGT, AFP, tumor diameter, or number between the DPHCC and non-DPHCC subgroups within the training cohort (all P > 0.05), these variables were excluded from the diagnostic model construction.
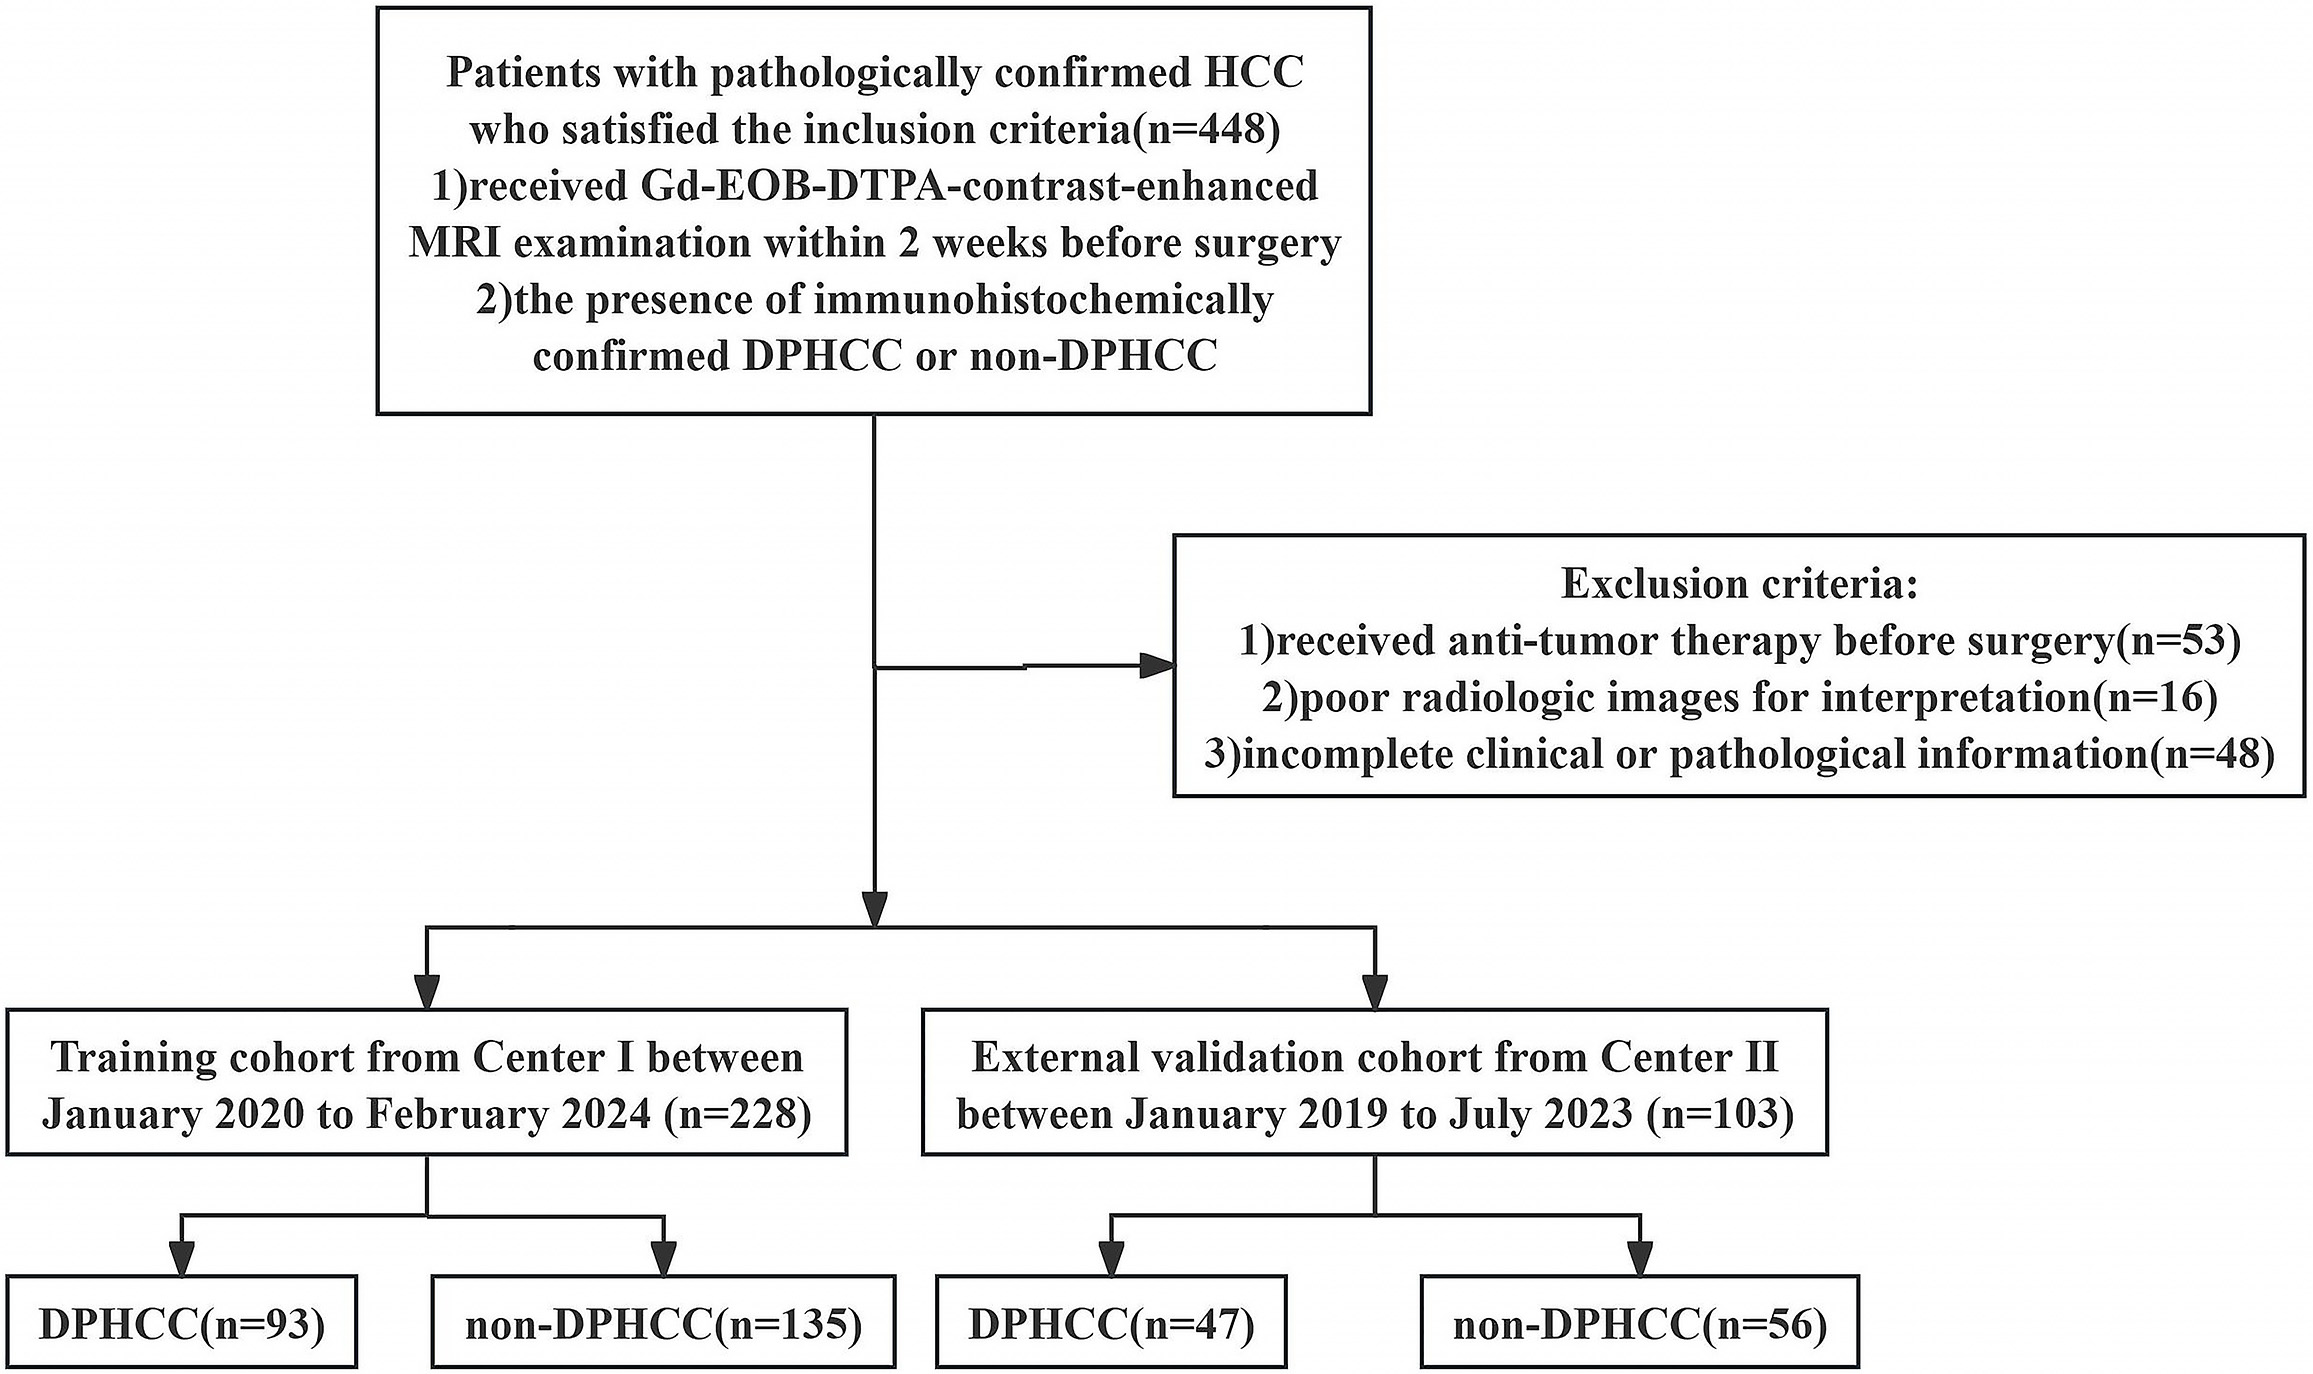
Figure 4. Flowchart shows the patient selection process. HCC: Hepatocellular carcinoma; DPHCC: dual-phenotype hepatocellular carcinoma.
Clinical characteristics of the patients in training and external validation cohorts
| Characteristics | Training cohort | External validation cohort | P value | |||
| non-DPHCC | DPHCC | Total | P value | |||
| Age (years) | 61.0 ± 9.8 | 58.7 ± 10.1 | 60.1 ± 10.0 | 0.092 | 58.2 ± 9.5 | 0.097 |
| Sex (male/female) | 101/34 | 71/22 | 172/56 | 0.792 | 77/26 | 0.894 |
| Tumor number | 0.770 | 0.094 | ||||
| 1 | 86(63.7) | 61(65.6) | 147(64.5) | 76(73.8) | ||
| ≥ 2 | 49(36.3) | 32(34.4) | 81(35.5) | 27(26.2) | ||
| Diameter (cm) | 5.2(2.6,7.7) | 3.8(2.9,6.6) | 4.5(2.7,7.2) | 0.117 | 2.7(1.9,4.5) | < 0.001 |
| AFP (μg/L) | 0.915 | 0.655 | ||||
| ≤ 100 | 92(68.1) | 64(68.8) | 156(68.4) | 73(70.9) | ||
| > 100 | 43(31.9) | 29(31.2) | 72(31.6) | 30(29.1) | ||
| HBV | 0.235 | 0.163 | ||||
| No | 57(42.2) | 32(34.4) | 89(39.0) | 32(31.1) | ||
| Yes | 78(57.8) | 61(65.6) | 139(61.0) | 71(68.9) | ||
| ALT (U/L) | 0.627 | 0.101 | ||||
| ≤ 50 | 115(85.2) | 77(82.8) | 192(84.2) | 79(76.7) | ||
| > 50 | 20(14.8) | 16(17.2) | 36(15.8) | 24(23.3) | ||
| AST (U/L) | 0.608 | 0.076 | ||||
| ≤ 40 | 99(73.3) | 71(76.3) | 170(74.6) | 67(65.0) | ||
| > 40 | 36(26.7) | 22(23.7) | 58(25.4) | 36(35.0) | ||
| GGT (U/L) | 0.675 | 0.444 | ||||
| ≤ 60 | 79(58.5) | 57(61.3) | 136(59.6) | 66(64.1) | ||
| > 60 | 56(41.5) | 36(38.7) | 92(40.4) | 37(35.9) | ||
| Cirrhosis | 0.492 | 0.871 | ||||
| No | 84(62.2) | 62(66.7) | 146(64.0) | 65(63.1) | ||
| Yes | 51(37.8) | 31(33.3) | 82(36.0) | 38(36.9) | ||
Radiological model construction
Radiological characteristics are shown in Table 2. The training and external validation cohorts showed good agreement for all features, with no statistically significant differences (all P > 0.05). In the training cohort, univariate analysis showed that the DPHCC subgroup had higher frequencies of rim APHE (38.7% vs. 5.2%, P < 0.001), peripheral washout (14.0% vs. 3.0%, P = 0.002), and non-smooth tumor margins (50.5% vs. 24.4%, P < 0.001) than the non-DPHCC subgroup. Conversely, non-rim APHE was more common in the non-DPHCC subgroup (88.1% vs. 54.8%, P < 0.001).
Comparison of radiological characteristics of DPHCC and non-DPHCC patients between training and external validation cohorts
| Characteristics | Training cohort | External validation cohort | P value | ||||
| non-DPHCC | DPHCC | P value | non-DPHCC | DPHCC | P value | ||
| Rim APHE | < 0.001 | 0.010 | 0.464 | ||||
| Absent | 128(94.8) | 57(61.3) | 52(92.9) | 35(74.5) | |||
| Present | 7(5.2) | 36(38.7) | 4(7.1) | 12(25.5) | |||
| non-rim APHE | < 0.001 | 0.153 | 0.970 | ||||
| Absent | 16(11.9) | 42(45.2) | 11(19.6) | 15(31.9) | |||
| Present | 119(88.1) | 51(54.8) | 45(80.4) | 32(68.1) | |||
| Peripheral washout | 0.002 | 0.015 | 0.130 | ||||
| Absent | 131(97.0) | 80(86.0) | 53(94.6) | 37(78.7) | |||
| Present | 4(3.0) | 13(14.0) | 3(5.4) | 10(21.3) | |||
| non-peripheral washout | 0.060 | 0.152 | 0.086 | ||||
| Absent | 43(31.9) | 41(44.1) | 12(21.4) | 16(34.0) | |||
| Present | 92(68.1) | 52(55.9) | 44(78.6) | 31(66.0) | |||
| Enhancing capsule | 0.599 | 0.140 | 0.599 | ||||
| Absent | 62(45.9) | 46(49.5) | 32(57.1) | 20(42.6) | |||
| Present | 73(54.1) | 47(50.5) | 24(42.9) | 27(57.4) | |||
| Tumor margins | < 0.001 | 0.218 | 0.373 | ||||
| smooth | 102(75.6) | 46(49.5) | 42(75.0) | 30(63.8) | |||
| non-smooth | 33(24.4) | 47(50.5) | 14(25.0) | 17(36.2) | |||
| Intratumoral hemorrhage | 0.079 | 0.363 | 0.203 | ||||
| Absent | 107(79.3) | 82(88.2) | 48(85.7) | 43(91.5) | |||
| Present | 28(20.7) | 11(11.8) | 8(14.3) | 4(8.5) | |||
| Intratumoral fat | 0.515 | 0.736 | 0.186 | ||||
| Absent | 104(77.0) | 75(80.6) | 41(73.2) | 33(70.2) | |||
| Present | 31(23.0) | 18(19.4) | 15(26.8) | 14(29.8) | |||
| Necrosis | 0.449 | 0.314 | 0.127 | ||||
| Absent | 73(54.1) | 55(59.1) | 34(60.7) | 33(70.2) | |||
| Present | 62(45.9) | 38(40.9) | 22(39.3) | 14(29.8) | |||
| Peritumoral enhancement in the arterial phase | 0.288 | 0.897 | 0.950 | ||||
| Absent | 116(85.9) | 75(80.6) | 47(83.9) | 39(83.0) | |||
| Present | 19(14.1) | 18(19.4) | 9(16.1) | 8(17.0) | |||
| Intratumoral vascularity | 0.142 | 0.314 | 0.069 | ||||
| Absent | 68(50.4) | 56(60.2) | 34(60.7) | 33(70.2) | |||
| Present | 67(49.6) | 37(39.8) | 22(39.3) | 14(29.8) | |||
| Delayed enhancement | 0.475 | 0.153 | 0.079 | ||||
| Absent | 96(71.1) | 62(66.7) | 47(83.9) | 34(72.3) | |||
| Present | 39(28.9) | 31(33.3) | 9(16.1) | 13(27.7) | |||
| Hepatobiliary phase hypointensity | 0.581 | 0.508 | 0.212 | ||||
| Absent | 13(9.6) | 7(7.5) | 2(3.6) | 3(6.4) | |||
| Present | 122(90.4) | 86(92.5) | 54(96.4) | 44(93.6) | |||
| Peritumoral hypointensity in HBP | 0.997 | 0.968 | 0.056 | ||||
| Absent | 106(78.5) | 73(78.5) | 49(87.5) | 41(87.2) | |||
| Present | 29(21.5) | 20(21.5) | 7(12.5) | 6(12.8) | |||
| T2WI mild-moderate hyperintensity | 0.993 | 0.353 | 0.093 | ||||
| Absent | 32(23.7) | 22(23.7) | 7(12.5) | 9(19.1) | |||
| Present | 103(76.3) | 71(76.3) | 49(87.5) | 38(80.9) | |||
| Targetoid diffusion restriction | 0.505 | 0.103 | 0.133 | ||||
| Absent | 129(95.6) | 87(93.5) | 53(94.6) | 40(85.1) | |||
| Present | 6(4.4) | 6(6.5) | 3(5.4) | 7(14.9) | |||
All variables significant in univariate analysis were entered into multivariable logistic regression. After adjustment, rim APHE [odds ratio (OR): 4.72, 95% confidence interval (CI): 1.15-19.31] and non-smooth tumor margins (OR: 1.95, 95%CI: 1.01-3.73) remained predictors for DPHCC [Table 3]. In the training cohort, the AUC, sensitivity, and specificity of the radiological model were 0.718 (95%CI, 0.653-0.782), 67.7%, and 67.4%, respectively; in the external validation cohort, the AUC, sensitivity, and specificity of the model were 0.607 (95%CI, 0.511-0.704), 25.5%, and 92.9%, respectively. The ROC curves are shown in Figure 5A and B.
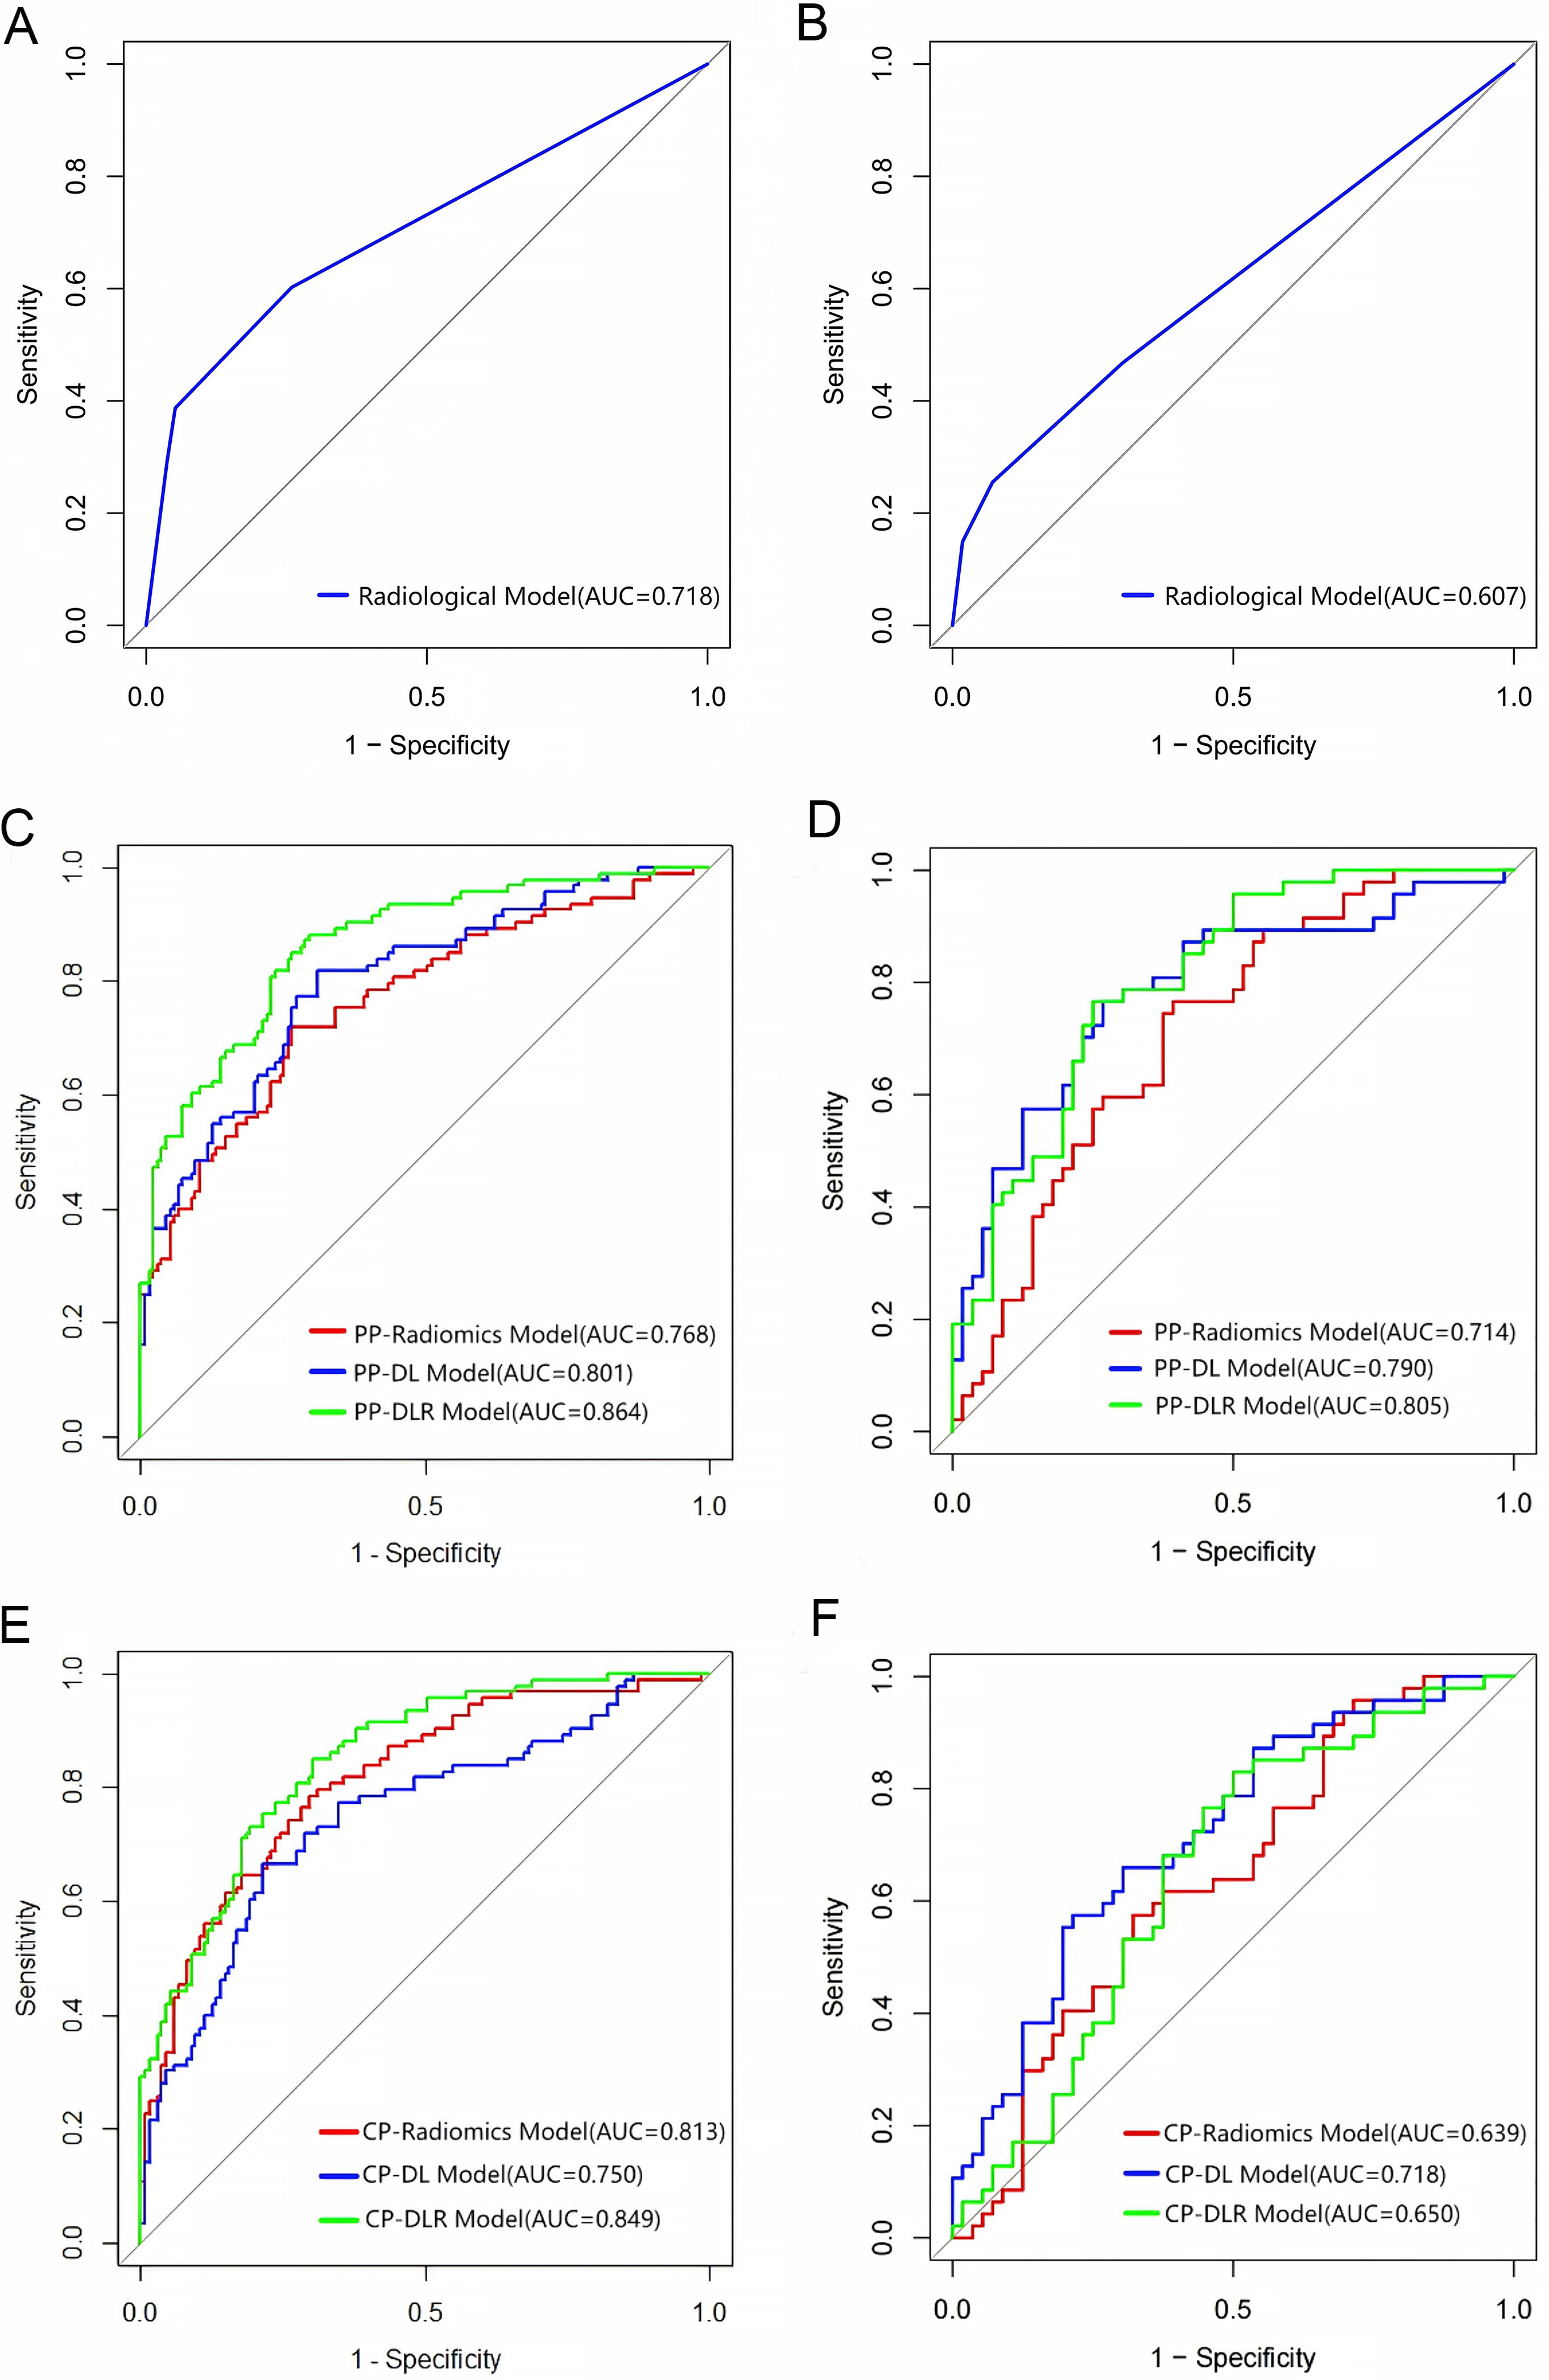
Figure 5. Performance of the DPHCC prediction models in the training and external validation cohorts. (A and B) ROC curves of radiological models; (C and D) ROC curves of radiomics, DL, and DLR models in PP; (E and F) ROC curves of radiomics, DL, and DLR models in CP. DPHCC: Dual-phenotype hepatocellular carcinoma; ROC: receiver operating characteristic; DL: deep learning; DLR: deep learning radiomics; PP: portal venous phase; CP: combined phase; AUC: area under the curve.
Univariate and multivariate logistic regression analysis for radiological characteristics of DPHCC
| Parameter | Univariate analysis | Multivariate analysis | ||
| OR (95%CI) | P value | OR (95%CI) | P value | |
| Rim APHE | 11.549 (4.851-27.536) | < 0.001 | 4.717(1.153-19.308) | 0.031 |
| non-rim APHE | 0.163 (0.084-0.317) | < 0.001 | ||
| Peripheral washout | 5.322 (1.677-16.887) | 0.005 | ||
| Tumor margins | 3.158 (1.795-5.558) | < 0.001 | 1.945(1.013-3.734) | 0.046 |
Feature extraction and selection
A total of 1,316 radiomics features and 768 DL features were extracted from each VOI per phase. The interobserver ICC was ≥ 0.8, 0.5-0.79, and < 0.5 for 88%, 8%, and 4% of the extracted features, respectively. The mean ICC for VOI delineation was 0.86, indicating satisfactory repeatability. The selected features were suitable for building DPHCC prediction models [Figure 5C-F]. To improve interpretability, we applied class activation mapping (CAM) to visualize the model’s decision patterns and highlight the regions it prioritized. As shown in Figure 6, the concentrated red zones overlapping with blue regions indicated heightened activation, reflecting focused computational attention. Low correlation coefficients in the heatmaps [Figure 7A-D] further supported feature feasibility. The numbers of features selected from each phase and the combined phase are listed in Supplementary Table 1.
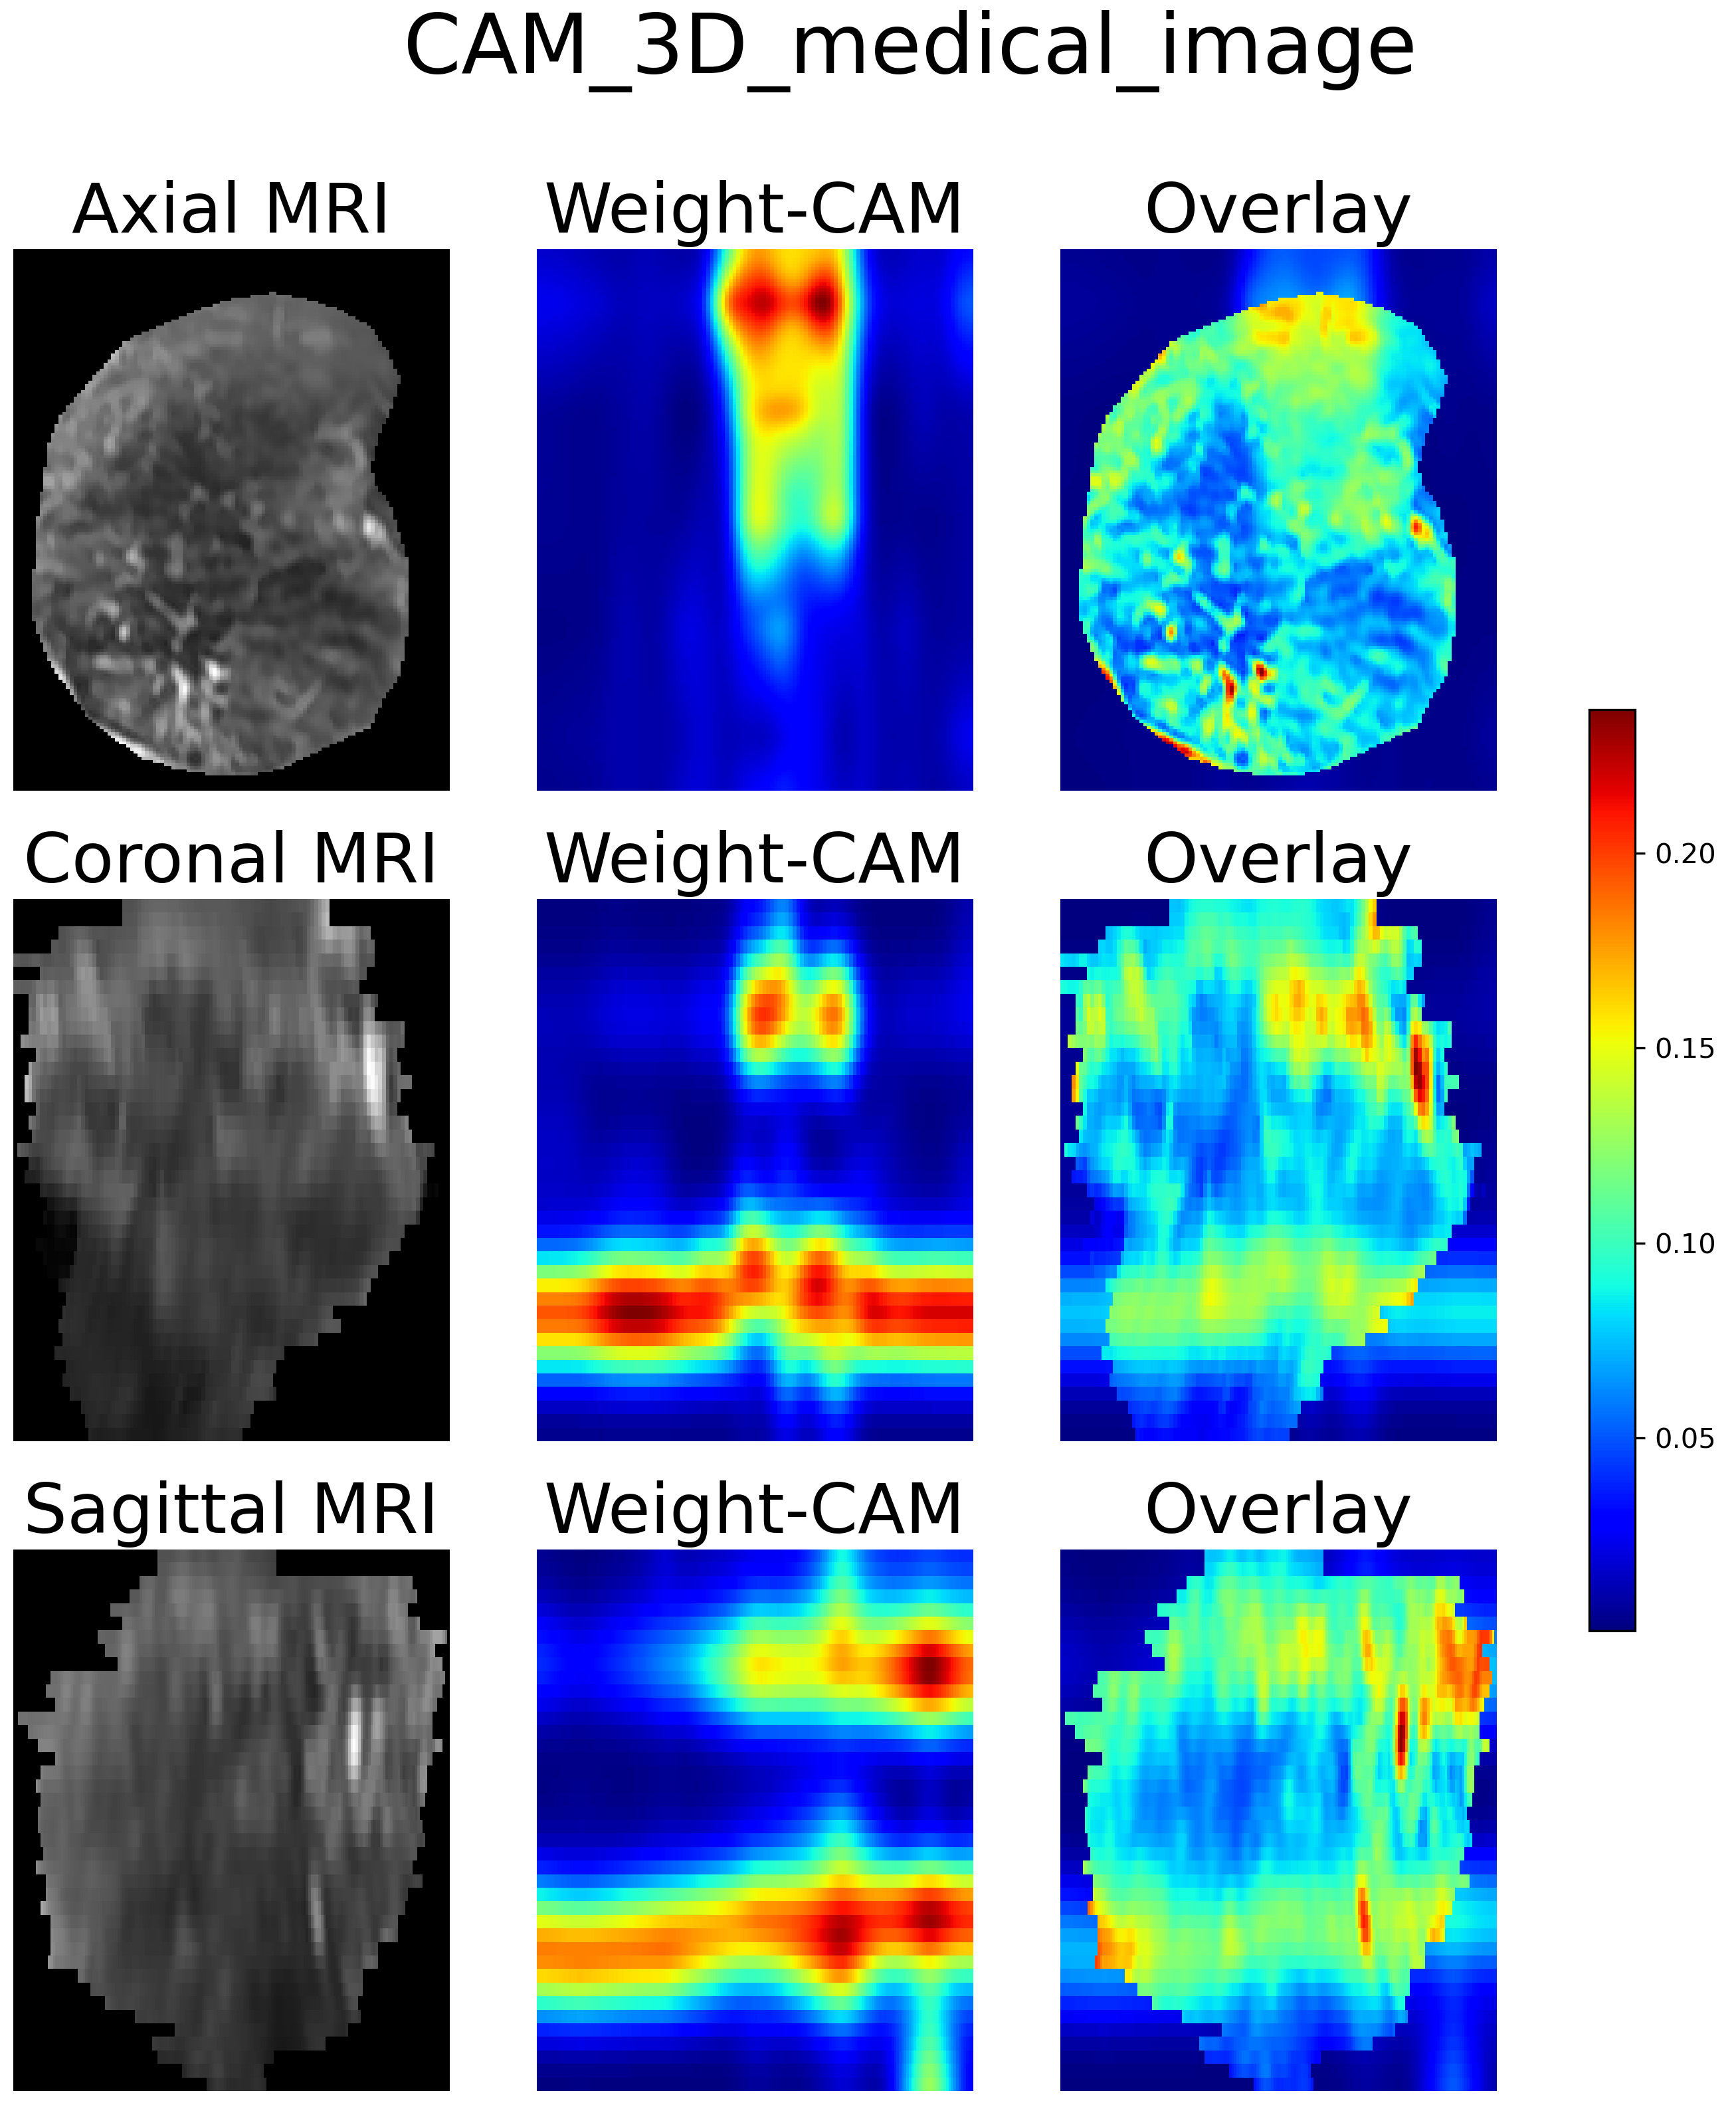
Figure 6. Class activation mapping (CAM) heatmaps of the 3D Swin Transformer. The axial, coronal, and sagittal heatmaps highlight discriminative regions that support the model’s decision-making rationale. 3D: Three-dimensional; MRI: magnetic resonance imaging; CAM: class activation mapping.
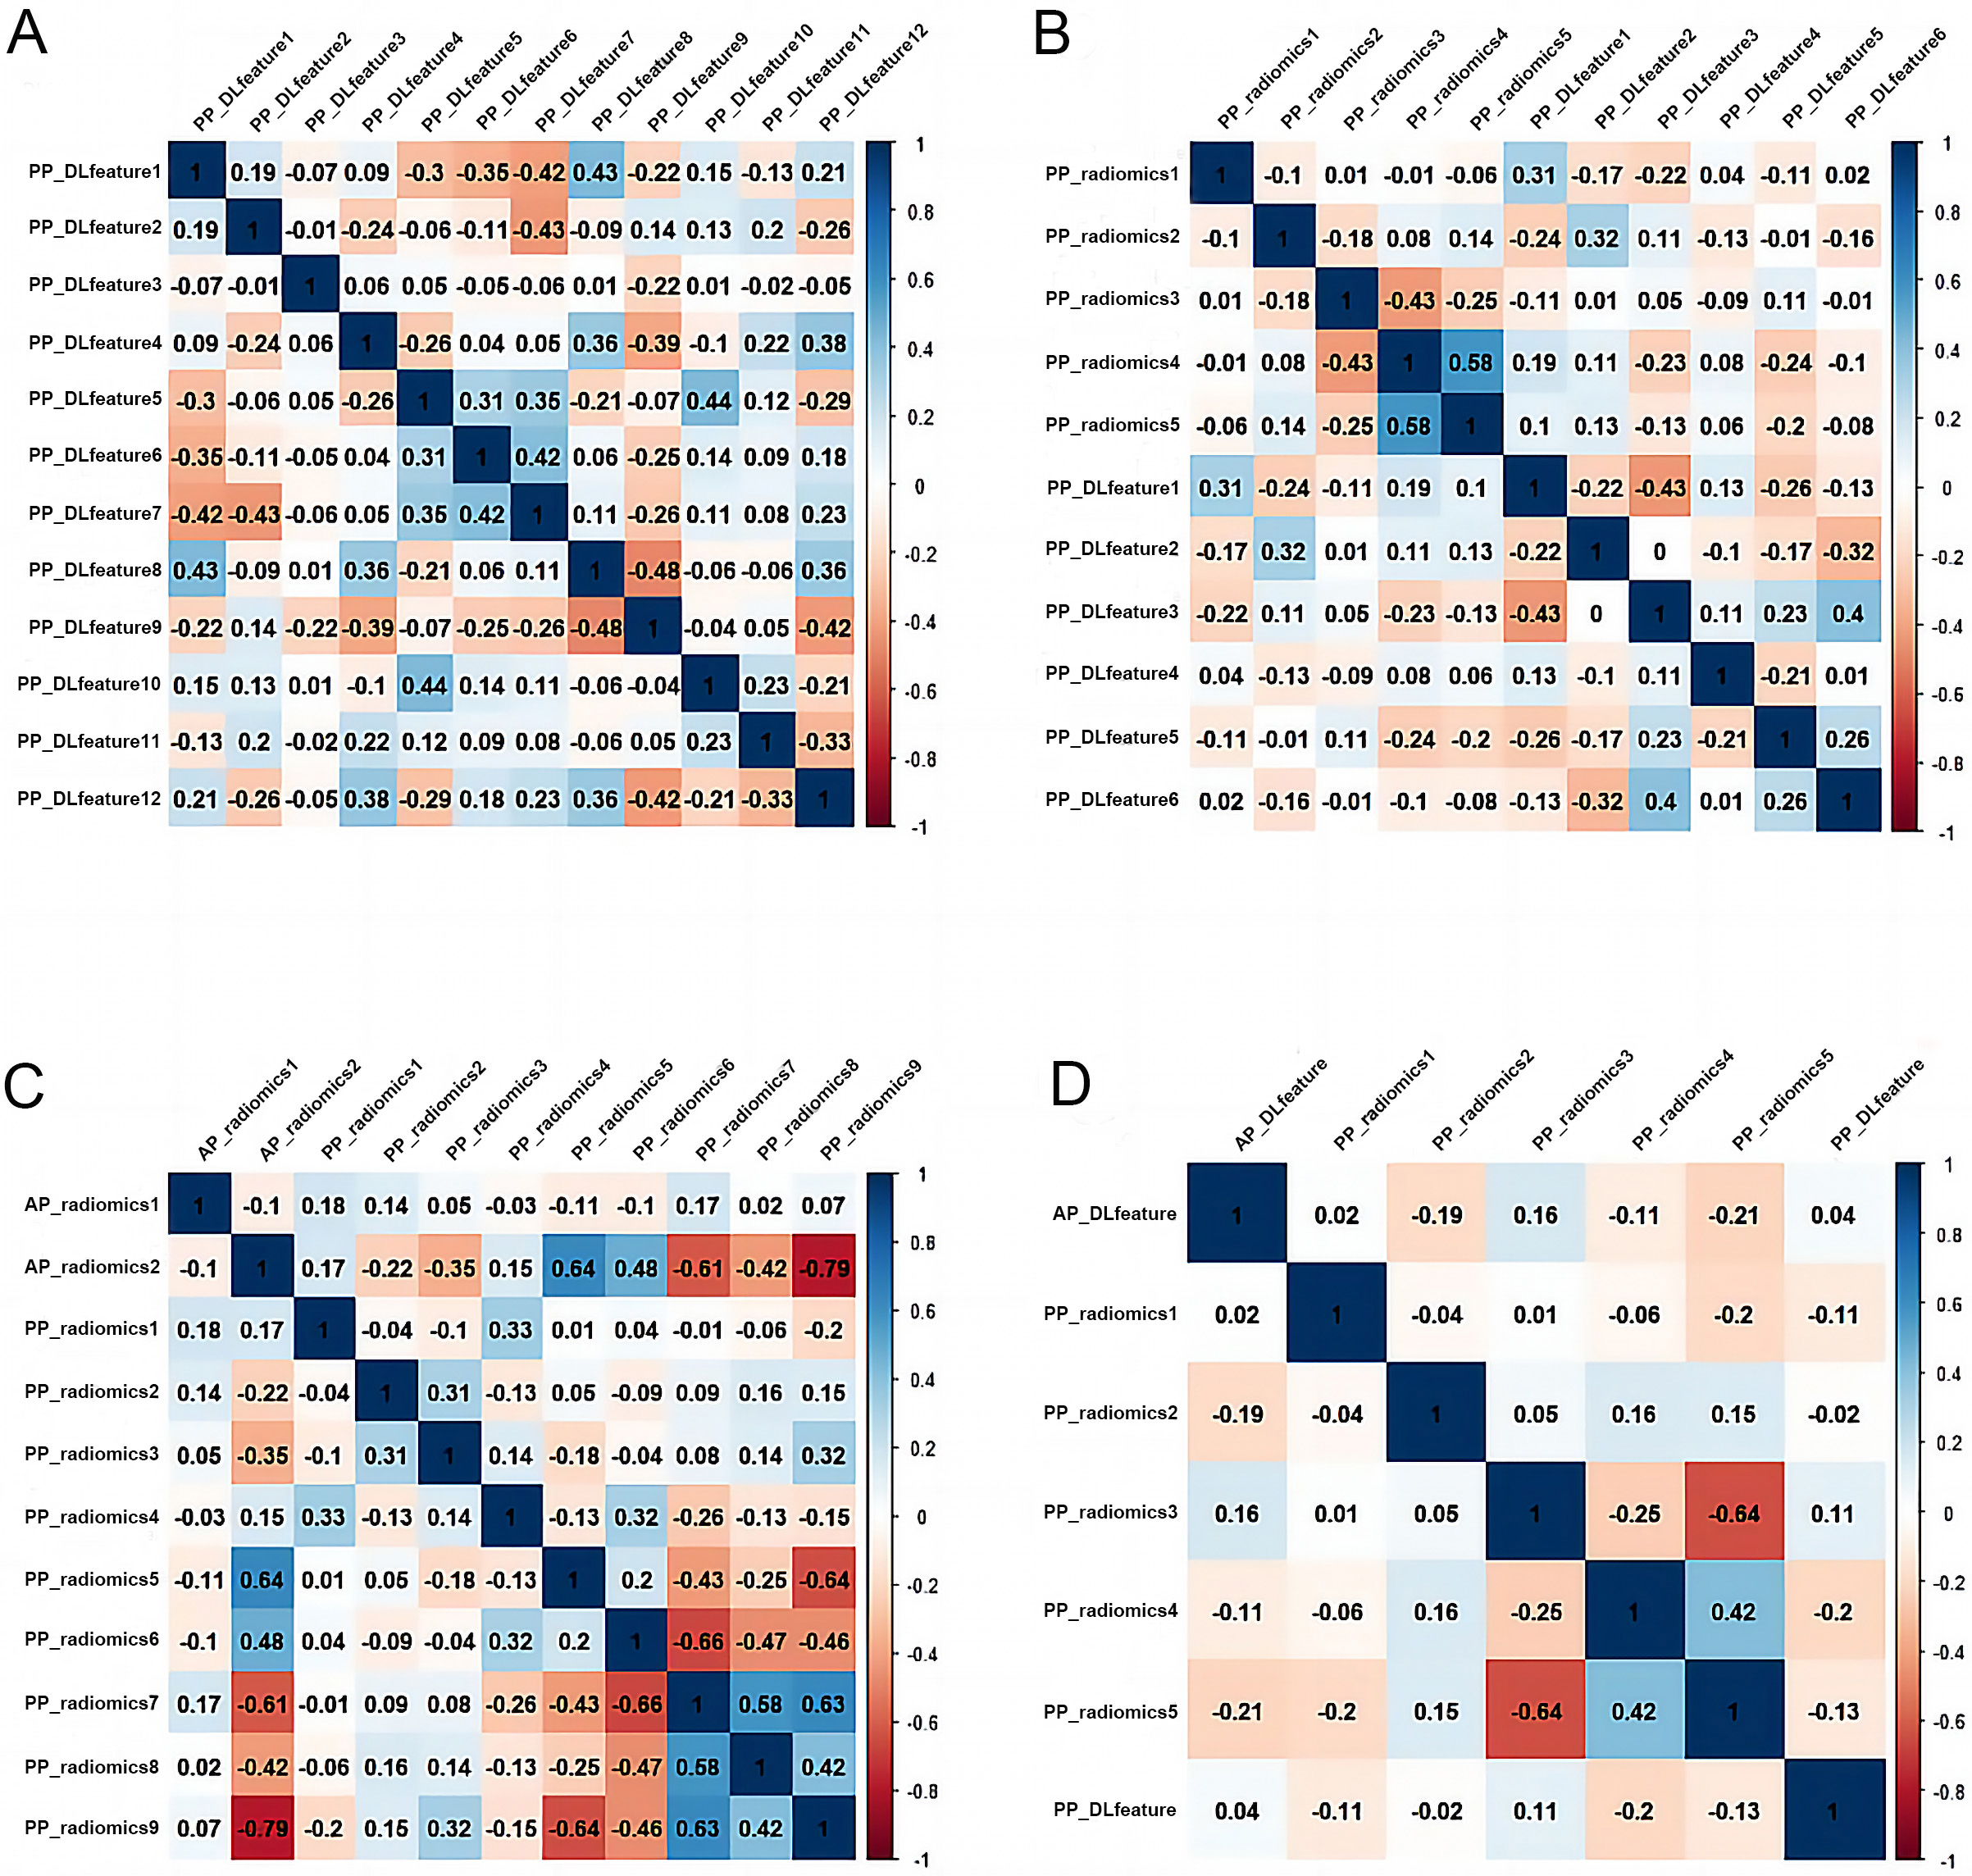
Figure 7. Correlation heatmaps of selected features. (A) Correlation matrix heatmap of the 12 selected features in the PP-DL model; (B) Correlation matrix heatmap of the 11 selected features in the PP-DLR model; (C) Correlation matrix heatmap of the 11 selected features in the CP-radiomics model; (D) Correlation matrix heatmap of the 7 selected features in the CP-DLR model. PP: Portal venous phase; DL: deep learning; DLR: deep learning radiomics; CP: combined phase. PP: Portal venous phase; DL: deep learning; DLR: deep learning radiomics.
Construction of radiomics, DL and DLR models
LR, LR-Lasso, and SVM classifiers were used to build radiomics, DL, and DLR models. As summarized in Table 4, LR-Lasso performed slightly better overall and was therefore selected for subsequent analyses. The models based on AP and HBP showed unsatisfactory performance in the external validation cohort (AUCs < 0.7), indicating poor diagnostic capability and reproducibility. To reduce redundancy and simplify the models, we therefore focused on the PP and CP models for detailed evaluation. The selected input features are presented in Supplementary Table 2.
Performance of radiomics, DL and DLR models in training and external validation cohorts
| Models | Training cohort (n = 228) | External validation cohort (n = 103) | ||||
| AUC (95%CI) | Sensitivity (%) | Specificity (%) | AUC (95%CI) | Sensitivity (%) | Specificity (%) | |
| AP-Radiomics | ||||||
| LR | 0.836(0.784-0.889) | 77.42 | 76.30 | 0.623(0.515-0.732) | 57.45 | 66.07 |
| LR-Lasso | 0.834(0.781-0.887) | 76.34 | 76.30 | 0.602(0.492-0.712) | 70.21 | 48.21 |
| SVM | 0.836(0.781-0.891) | 84.95 | 76.30 | 0.622(0.512-0.732) | 55.32 | 69.64 |
| AP-DL | ||||||
| LR | 0.807(0.749-0.865) | 84.95 | 62.96 | 0.487(0.372-0.602) | 40.43 | 67.86 |
| LR-Lasso | 0.807(0.750-0.865) | 84.95 | 63.70 | 0.472(0.372-0.602) | 27.66 | 78.57 |
| SVM | 0.802(0.743-0.861) | 82.80 | 64.44 | 0.455(0.341-0.569) | 12.77 | 96.43 |
| AP-DLR | ||||||
| LR | 0.873(0.826-0.919) | 83.87 | 80.00 | 0.527(0.414-0.640) | 95.74 | 16.07 |
| LR-Lasso | 0.869(0.822-0.916) | 81.72 | 80.00 | 0.527(0.414-0.639) | 100.00 | 10.71 |
| SVM | 0.869(0.821-0.917) | 70.97 | 88.89 | 0.525(0.412-0.638) | 95.74 | 16.07 |
| PP-Radiomics | ||||||
| LR | 0.768(0.704-0.831) | 70.97 | 73.33 | 0.715(0.617-0.814) | 76.60 | 60.71 |
| LR-Lasso | 0.768(0.704-0.831) | 72.04 | 73.33 | 0.714(0.615-0.813) | 76.60 | 60.71 |
| SVM | 0.764(0.701-0.828) | 68.82 | 74.07 | 0.715(0.617-0.814) | 91.49 | 42.86 |
| PP-DL | ||||||
| LR | 0.801(0.743-0.860) | 77.42 | 72.59 | 0.786(0.695-0.876) | 78.72 | 71.43 |
| LR-Lasso | 0.801(0.743-0.859) | 81.72 | 68.89 | 0.790(0.700-0.880) | 76.60 | 73.21 |
| SVM | 0.801(0.742-0.860) | 81.72 | 66.67 | 0.785(0.694-0.876) | 74.47 | 75.00 |
| PP-DLR | ||||||
| LR | 0.864(0.816-0.911) | 82.80 | 75.56 | 0.805(0.730-0.893) | 76.60 | 76.79 |
| LR-Lasso | 0.864(0.816-0.911) | 88.17 | 70.37 | 0.805(0.722-0.887) | 76.60 | 75.00 |
| SVM | 0.864(0.816-0.913) | 82.80 | 76.30 | 0.788(0.702-0.875) | 74.47 | 76.79 |
| HBP-Radiomics | ||||||
| LR | 0.693(0.625-0.762) | 67.74 | 61.48 | 0.559(0.447-0.672) | 78.72 | 37.50 |
| LR-Lasso | 0.694(0.625-0.762) | 68.82 | 60.74 | 0.560(0.448-0.672) | 78.72 | 37.50 |
| SVM | 0.696(0.628-0.764) | 73.12 | 59.26 | 0.546(0.434-0.659) | 68.09 | 51.79 |
| HBP-DL | ||||||
| LR | 0.778(0.717-0.839) | 78.49 | 65.93 | 0.610(0.497-0.723) | 55.32 | 73.21 |
| LR-Lasso | 0.777(0.716-0.839) | 78.49 | 65.93 | 0.608(0.495-0.721) | 46.81 | 80.36 |
| SVM | 0.771(0.707-0.834) | 64.52 | 79.26 | 0.601(0.489-0.714) | 44.68 | 78.57 |
| HBP-DLR | ||||||
| LR | 0.701(0.631-0.770) | 54.84 | 77.78 | 0.535(0.420-0.650) | 27.66 | 87.50 |
| LR-Lasso | 0.700(0.631-0.769) | 54.84 | 76.30 | 0.534(0.419-0.649) | 27.66 | 87.50 |
| SVM | 0.700(0.630-0.769) | 52.69 | 77.04 | 0.525(0.409-0.641) | 53.19 | 64.29 |
| CP-Radiomics | ||||||
| LR | 0.813(0.757-0.870) | 78.49 | 70.37 | 0.638(0.531-0.745) | 95.74 | 28.57 |
| LR-Lasso | 0.813(0.757-0.870) | 78.49 | 70.37 | 0.639(0.532-0.746) | 57.45 | 67.86 |
| SVM | 0.807(0.749-0.865) | 77.42 | 71.11 | 0.608(0.499-0.717) | 53.19 | 67.86 |
| CP-DL | ||||||
| LR | 0.750(0.684-0.816) | 66.67 | 77.78 | 0.717(0.618-0.816) | 55.32 | 80.36 |
| LR-Lasso | 0.750(0.684-0.816) | 66.67 | 78.52 | 0.718(0.620-0.817) | 57.45 | 78.57 |
| SVM | 0.751(0.685-0.816) | 66.67 | 78.52 | 0.719(0.620-0.817) | 57.45 | 78.57 |
| CP-DLR | ||||||
| LR | 0.849(0.801-0.898) | 75.27 | 80.00 | 0.649(0.542-0.757) | 82.98 | 50.00 |
| LR-Lasso | 0.849(0.800-0.898) | 84.95 | 69.63 | 0.650(0.543-0.758) | 82.98 | 50.00 |
| SVM | 0.849(0.800-0.898) | 75.27 | 79.26 | 0.675(0.570-0.779) | 78.72 | 57.14 |
Bootstrap stability analysis confirmed that most of the 11 selected features were consistently identified; three features showed high selection frequencies > 70% and six exceeded 25% [Supplementary Table 3], indicating that the core predictive feature set was robust to sampling variability. Although the stability of the low-frequency features was suboptimal, the model as a whole was reliable for risk stratification.
Predictive model evaluation
The PP-DLR model achieved the highest predictive performance in both cohorts. In the training cohort, the AUC was 0.864 (95%CI, 0.816-0.911), sensitivity 88.17%, and specificity 70.37%. In the external validation cohort, the AUC was 0.805 (95%CI, 0.722-0.887), sensitivity 76.60%, and specificity 75.00%. The PP-DL model ranked second, with an AUC of 0.801 (95%CI, 0.743-0.859) in the training cohort and an AUC of 0.790 (95%CI, 0.700-0.880) in the external validation cohort. In the external validation cohort, the PP-DLR model showed a significantly higher AUC value than the PP-Radiomics model (P = 0.026), no significant difference was observed between the PP-DL and PP-DLR models (P = 0.784).
Among the CP models, the CP-Radiomics and CP-DLR models had lower AUCs than the CP-DL model, but the differences were not significant (P = 0.281 and 0.219, respectively). The AUC of the CP-DL model was 0.750 (95%CI, 0.684-0.816) in the training cohort and 0.718 (95%CI, 0.620-0.817) in the external validation cohort.
According to the DeLong test, the AUC of the PP-DLR model was significantly higher than those of the CP-Radiomics and CP-DLR models (both P < 0.05). The PP-DLR model had a higher AUC value than the CP-DL model, although the difference was not statistically significant (P = 0.149). The radiological model had significantly lower AUC than those of the PP-DLR and PP-DL models (all P < 0.05), but was comparable to the remaining models (all P > 0.05) [Table 5].
Comparison of the constructed models in the external validation cohort
| Models | AUC | P value |
| PP-DLR vs. PP-DL | 0.805 vs. 0.790 | 0.784 |
| PP-DLR vs. PP-Radiomics | 0.805 vs. 0.714 | 0.026 |
| PP-DL vs. PP-Radiomics | 0.790 vs. 0.714 | 0.279 |
| CP-DLR vs. CP-DL | 0.650 vs. 0.718 | 0.219 |
| CP-DLR vs. CP-Radiomics | 0.650 vs. 0.639 | 0.838 |
| CP-DL vs. CP-Radiomics | 0.718 vs. 0.639 | 0.281 |
| PP-DLR vs. CP-DLR | 0.805 vs. 0.650 | < 0.001 |
| PP-DL vs. CP-DL | 0.790 vs. 0.718 | 0.198 |
| PP-Radiomics vs. CP-Radiomics | 0.714 vs. 0.718 | 0.150 |
| PP-DLR vs. CP-Radiomics | 0.805 vs. 0.639 | 0.002 |
| PP-DLR vs. CP-DL | 0.805 vs. 0.718 | 0.149 |
| PP-DLR vs. Radiological model | 0.805 vs. 0.607 | 0.003 |
| PP-DL vs. Radiological model | 0.790 vs. 0.607 | 0.007 |
| PP-Radiomics vs. Radiological model | 0.714 vs. 0.607 | 0.131 |
| CP-DLR vs. Radiological model | 0.650 vs. 0.607 | 0.559 |
| CP-DL vs. Radiological model | 0.718 vs. 0.607 | 0.116 |
| CP-Radiomics vs. Radiological model | 0.639 vs. 0.607 | 0.671 |
Given the significant difference in tumor diameter between the training and external validation cohorts, a subgroup analysis was performed accordingly. The results showed that tumor diameter had a limited impact on the performance of the PP-DLR model in the external validation cohort (≤ 3 cm: AUC, 0.800 [95%CI: 0.671-0.929]; > 3 cm: AUC, 0.821 [95%CI: 0.709-0.933]; P = 0.805).
Predictors of survival
As of 28 February 2024, 215 of 228 patients (94.3%) in the training cohort and all 103 patients (100.0%) in the external validation cohort had completed RFS follow-up; 13 patients in the training cohort were lost to follow-up. In both cohorts, DPHCC revealed poorer PFS and earlier recurrence compared with non-DPHCC (both P < 0.05).
In the training cohort, the median RFS was 16.0 (95%CI, 13.6-not evaluable) months for histologically confirmed DPHCC patients and 34.6 (95%CI, 23.8-not evaluable) months for histologically confirmed non-DPHCC patients (P = 0.036) [Figure 8A]. Similarly, the median RFS was 13.9 (95%CI, 11.2-not evaluable) months for patients classified as DPHCC by the PP-DLR model and 35.0 (95%CI, 24.0-not evaluable) months for those classified as non-DPHCC in the training cohort (P < 0.001) [Figure 8B].
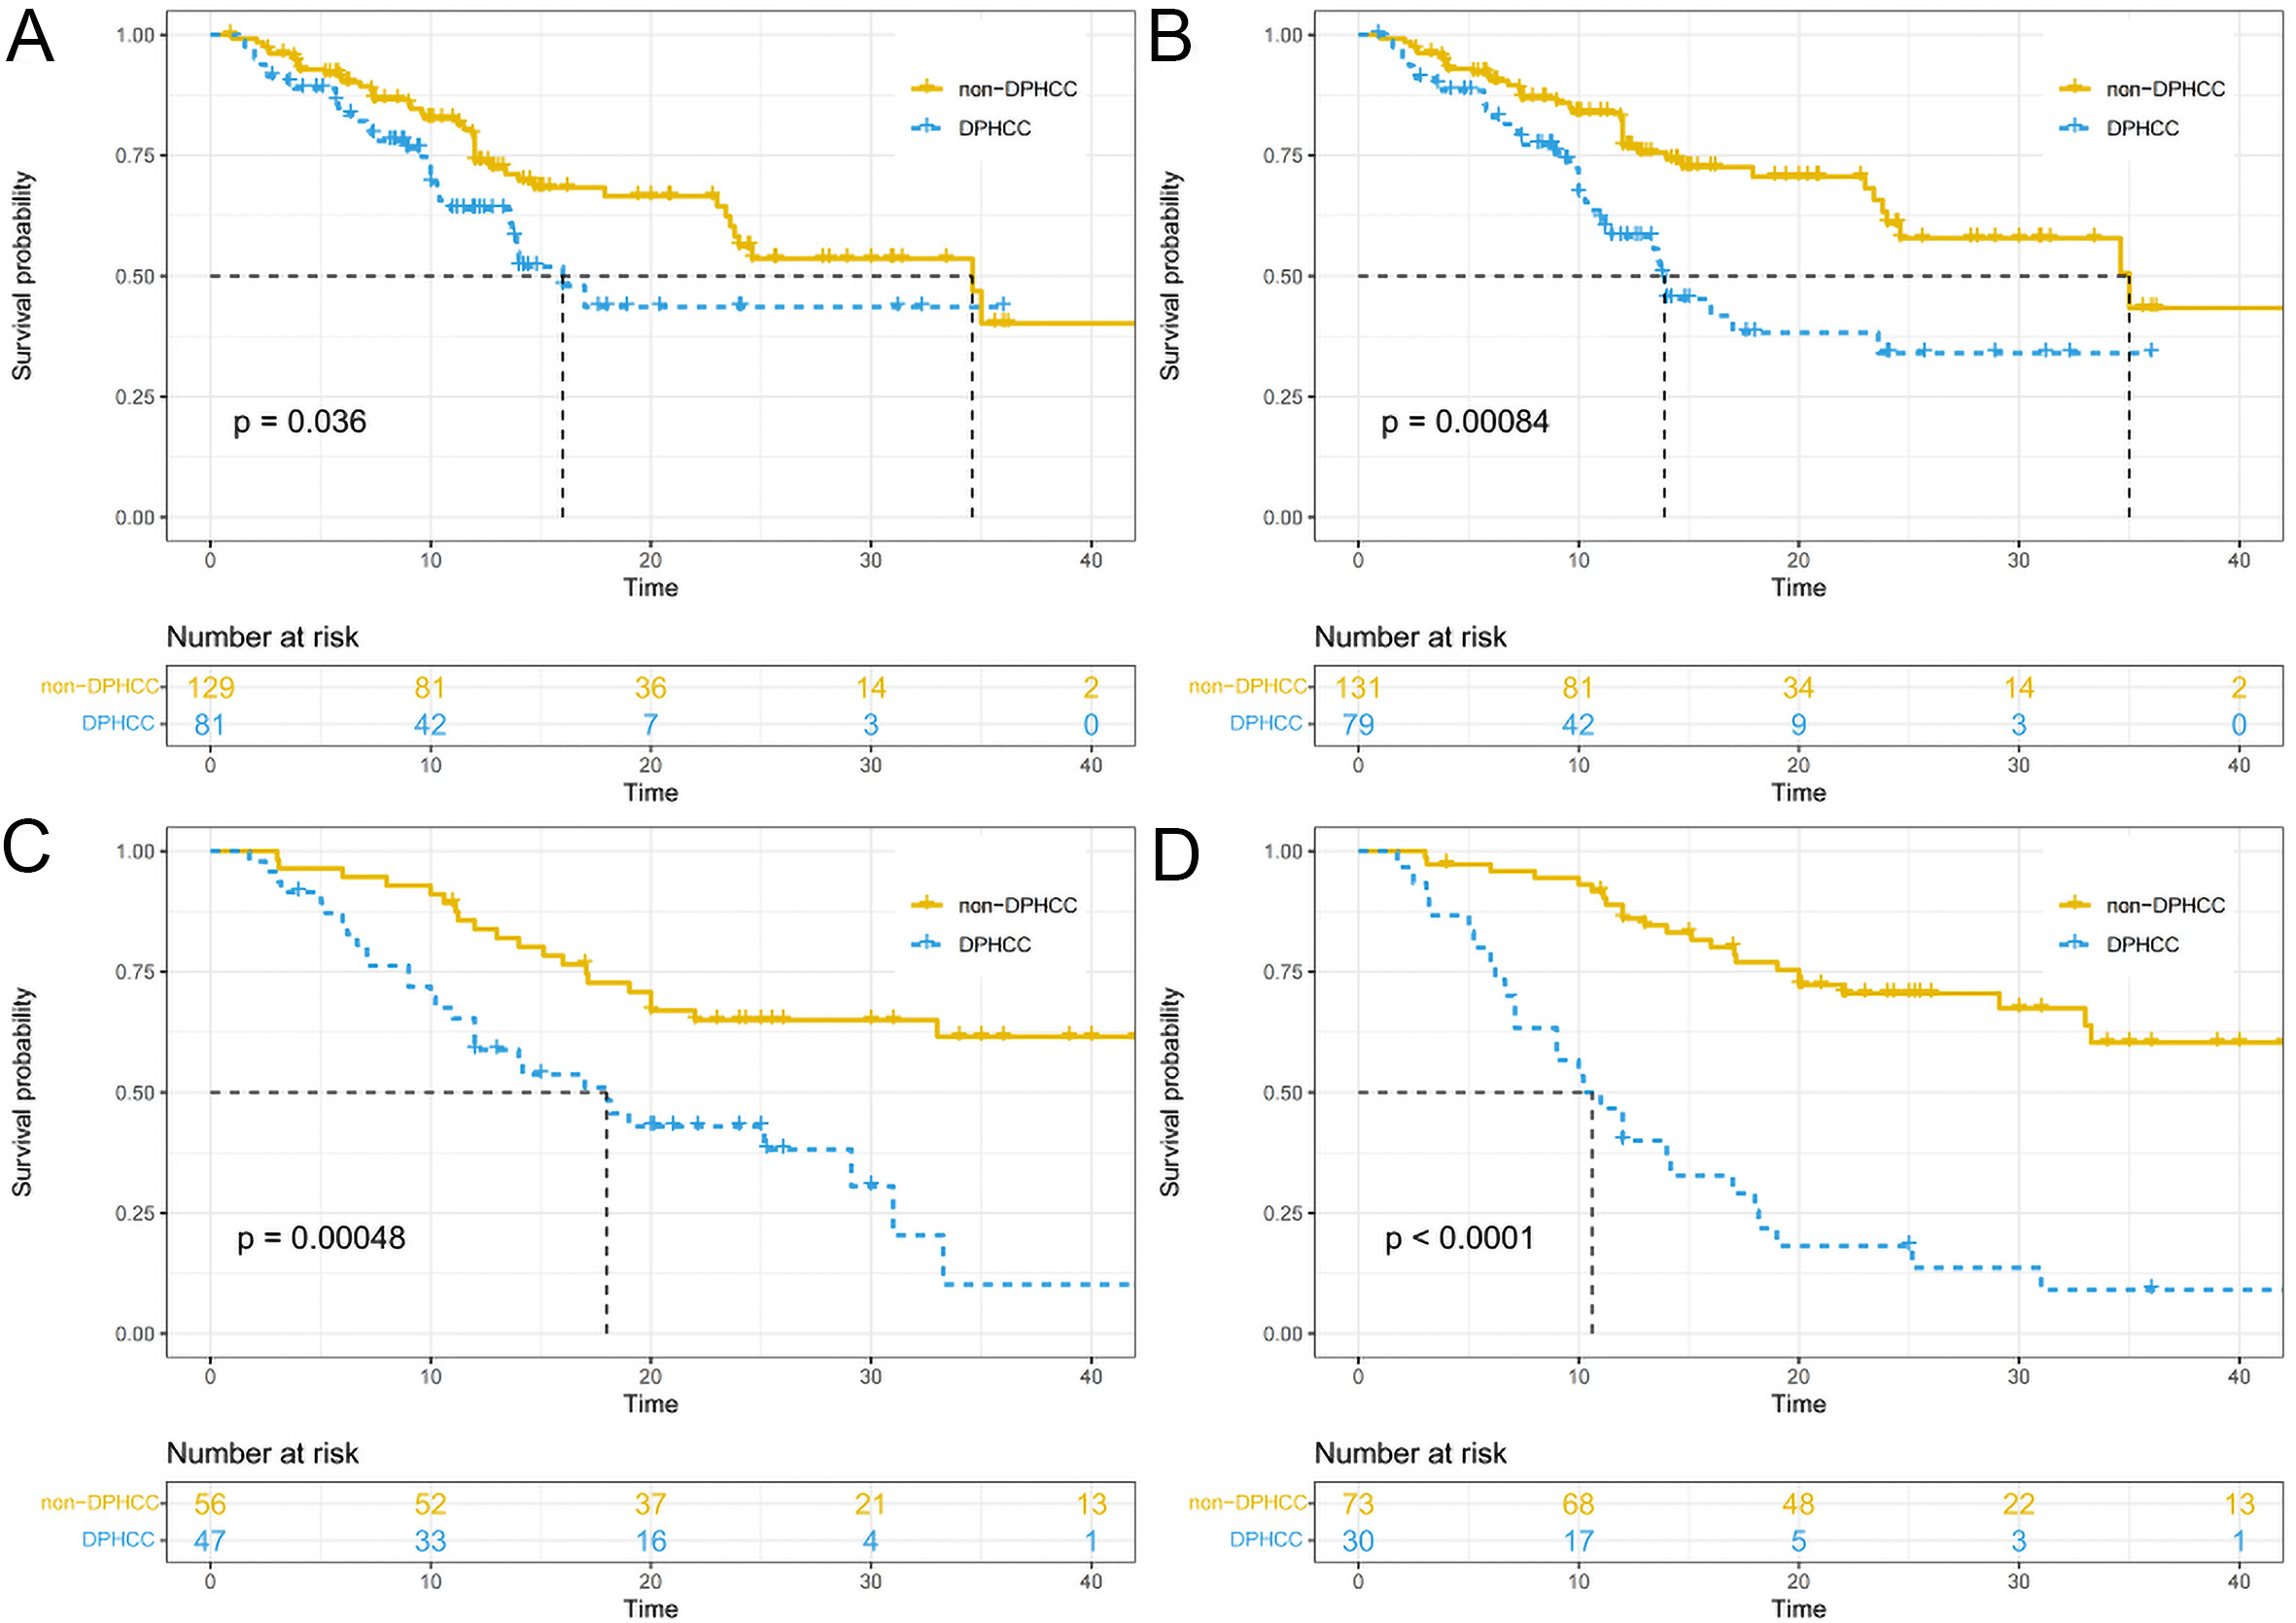
Figure 8. Recurrence-free survival curves stratified by histological diagnosis and PP-DLR-predicted DPHCC status in the training cohort (A and B) and external validation cohort (C and D). Curves were estimated using the Kaplan-Meier method and compared using the log-rank test. PP: Portal venous phase; DLR: deep learning radiomics; DPHCC: Dual-phenotype hepatocellular carcinoma.
In the external validation cohort, the median RFS was 18.0 (95%CI, 12.0-not evaluable) months for histologically confirmed DPHCC and not evaluable (95%CI, 33.0-not evaluable) for histologically confirmed non-DPHCC (P < 0.001) [Figure 8C]; the median RFS was 10.6 (95%CI, 7.1-18.0) months for patients classified as DPHCC by the PP-DLR model and not evaluable (95%CI, 33.3-not evaluable) for those classified as non-DPHCC (P < 0.001) [Figure 8D].
DISCUSSION
As evidence increasingly links DPHCC to aggressive biological behavior and poor prognosis, noninvasive approaches to identify this subtype preoperatively are needed. In this study, we developed and externally validated preoperative models for DPHCC using conventional radiological, radiomics, DL, and DLR approaches based on Gd-EOB-DTPA-enhanced MRI. Our results showed that the PP-DLR model demonstrated higher predictive ability than the other constructed models.
Clinically, previous studies have reported that AFP level and HBV infection are risk factors for DPHCC[19]. However, in our study, no clinical factors were found to be significantly associated with DPHCC. These discrepancies may reflect population heterogeneity and the different tumor-marker cutoffs used across studies. HBV positivity was numerically higher in the DPHCC subgroup, although this difference was not statistically significant.
Because HCC is highly heterogeneous, some lesions may lack the typical wash-in and wash-out enhancement pattern and instead exhibit atypical imaging features, posing a diagnostic challenge. Previous studies have shown that features such as rim APHE, persistent dynamic enhancement pattern, and targetoid diffusion restriction are independent variables for diagnosing DPHCC[14]. Similarly, in our study, multivariate analysis identified rim APHE and non-smooth tumor margins as independent predictors of DPHCC. Rim APHE, a key feature for predicting ICCA, likely reflects central fibrosis and peripheral cellular proliferation[20]. CK19-positive HCC often presents with central necrosis and peripheral invasive spread, and dual-phenotype tumors with biliary differentiation may therefore show ICCA-like imaging patterns. We also observed that DPHCC more frequently had irregular margins. This may reflect poor differentiation and infiltrative growth, which are often associated with microvascular invasion (MVI)[21]. However, subjective interpretation of radiological features remains a limitation.
Computational image-analysis methods, including radiomics and DL, can extract multidimensional quantitative biomarkers from medical images. These methods provide standardized, quantitative protocols that complement subjective visual assessment. Previous radiomics-based diagnostic models for DPHCC have shown promising results. Huang et al. achieved good performance by combining multiphase features with an ensemble of classifiers[22], and Wu et al. reported a combined AP and PP radiomics model with an AUC > 0.9[19]. In our study, however, radiomics models alone showed suboptimal predictive performance, possibly because of the limited cohort size and lack of cross-institutional validation. The relatively lower AUCs also suggested that radiomics features should be combined with more stable complementary features.
Compared with radiomics, DL can automatically learn high-level image features that capture both morphological signatures and subtle imaging patterns related to tumor biology. Our DLR model was designed to integrate multiphase radiomics features with DL-derived representations, combining their complementary information.
Conventional CNNs analyze images through local receptive fields, which may limit their ability to integrate information across the entire tumor volume[23]. The 3D Swin Transformer used in this study addressed this limitation through a shifted-window design that enabled the model to relate distant spatial regions within the tumor from multiphase MRI[24-26]. Swin Transformer models have been applied to predict MVI on preoperative MRI and CT[27,28] and to classify adverse prostate cancer pathology on biparametric MRI[29], supporting their utility in extracting clinically relevant imaging features of tumor heterogeneity.
Medical image analysis is shifting from task-specific models toward foundation models[30]. Our use of a fine-tuned 3D Swin Transformer as a feature extractor represents a transitional strategy. While task-specific models remain useful for focused clinical questions, foundation models pre-trained on massive medical imaging datasets may offer improved generalizability. Future studies could explore fine-tuning such foundation models on liver MRI to improve predictive performance and reduce dependence on handcrafted features.
DLR models have shown improved performance over radiomics or DL alone by integrating complementary feature sets. Li et al. reported a DLR model differentiating primary from metastatic lung cancer with an AUC of 0.913[31], and Yang et al. constructed a DLR model that discriminated low- from high-grade meningiomas better than either radiomics or DL alone[32]. In our study, the PP-DLR model showed the best performance, combining 5 radiomics features and 6 DL features. Low correlation coefficients indicated that they provided complementary information. The radiomics features were all texture features reflecting intratumor heterogeneity through measures such as energy and entropy, while the DL features provided volumetric spatial information complementary to the texture-based radiomics features. Although bootstrap analysis confirmed the stability of the core feature set, some features showed lower selection frequencies, likely due to collinearity among candidate features and the moderate sample size. The good external validation performance supports the feasibility of this DLR approach. Future studies with larger, multicenter cohorts are needed to further improve feature reproducibility.
DPHCC may show CK19 expression, reflecting biliary differentiation. This biological trait may be associated with intratumoral fibrous stroma that delays contrast clearance[33]. DPHCC therefore maintains stronger enhancement relative to the adjacent liver on PP imaging, often with persistent enhancement rather than washout. This sustained enhancement on PP images may increase the contrast between DPHCC and background liver, facilitating feature-based discrimination. This may explain why the PP-based model outperformed models based on other phases in our external validation cohort.
The prevalence of DPHCC in our cohorts was higher than that reported in most previous studies. Several factors may explain this. First, our cohorts were drawn from two centers with a high proportion of patients undergoing surgery for HCC, which may enrich for more aggressive tumor phenotypes. Second, DPHCC incidence varies geographically; both centers are located in regions with relatively high HCC prevalence, including the Nantong area. Third, Gd-EOB-DTPA-enhanced MRI may have been preferentially performed in patients with atypical HCC features, further enriching for DPHCC. These factors should be considered when interpreting the DPHCC proportion in our population. Importantly, a model’s positive predictive value declines with decreasing prevalence, limiting its utility as a stand-alone confirmatory test. Therefore, the PP-DLR model should be considered a risk-stratification tool to complement, not replace, conventional clinical and pathological assessment. Its utility in lower-prevalence settings requires further validation in prospective multicenter studies with standardized diagnostic criteria.
Previous studies have shown that HCC expressing biliary markers is highly aggressive and proliferative, often indicating a poor prognosis[34]. We similarly found that DPHCC patients had a higher risk of postoperative recurrence and mortality, highlighting the need for more intensive surveillance and management in this subtype. Given the significantly poorer RFS associated with DPHCC, surgeons may utilize model-based predictions to justify closer follow-up, earlier postoperative imaging, and multidisciplinary discussions about adjuvant therapy. In its current form, the PP-DLR model is not intended to directly trigger invasive or high-risk interventions; rather, it provides a noninvasive tool for preoperative risk stratification to identify patients who may benefit from intensified postoperative monitoring. Although the model showed encouraging discrimination in a high-prevalence cohort, its clinical utility in lower-prevalence settings requires further validation. Integrating model predictions with conventional clinical and pathological factors remains essential for informed clinical decision-making.
Limitations
First, the retrospective design introduced inherent selection bias. Second, tumor sizes differed significantly between the training and external validation cohorts. Although subgroup analysis suggested that tumor size had a limited effect on model robustness, these findings are preliminary and need to be validated. Third, the moderate stability of some selected features and the high DPHCC prevalence in our cohort limit generalizability. External validation in larger, multicenter cohorts is needed before clinical translation.
Conclusion
The PP-DLR model may aid in the preoperative identification of DPHCC. DPHCC is associated with poorer recurrence-free survival, and preoperative identification of this subtype may help inform postoperative surveillance strategies.
DECLARATIONS
Authors’ contributions
Made substantial contributions to conception and design of the study and performed data analysis and interpretation: Sun H, Wu Q, Hu J
Writing of the original draft: Sun H
Acquisition, analysis of data and investigation: Zhang T, Du M, Wang X
Provided administrative, technical, and material support: Yang Y, Hu C, Yu Y
All authors read and approved the final manuscript.
Availability of data and materials
The datasets generated and analyzed during the current study are not publicly available because patients’ privacy information may be compromised, but are available from the corresponding author upon reasonable request.
AI and AI-assisted tools statement
During the preparation of this manuscript, the AI tool DeepSeek (version R1, released 2025-01-20) was used solely for language editing. The tool did not influence the study design, data collection, analysis, interpretation, or the scientific content of the work. All authors take full responsibility for the accuracy, integrity, and final content of the manuscript.
Financial support and sponsorship
This work was supported by the Suzhou Science and Technology Plan Project (No. SKY2023146); Suzhou Basic Research Pilot Project (No. SSD2024083); and Boxi Clinical Research Project of The First Affiliated Hospital of Suzhou University (No. BXLC2025001).
Conflicts of interest
All authors declared that there are no conflicts of interest.
Ethical approval and consent to participate
The authors are accountable for all aspects of the work in ensuring that questions related to the accuracy or integrity of any part of the work are appropriately investigated and resolved. The study was conducted in accordance with the Declaration of Helsinki and its subsequent amendments.
The institutional Ethics Review Board of The First Affiliated Hospital of Soochow University (Approval No. 2024-431) and Nantong Third People’s Hospital (EK 2023025) approved this retrospective study and waived the requirement for written informed consent.
Consent for publication
Not applicable.
Copyright
© The Author(s) 2026.
Supplementary Materials
REFERENCES
1. Kim TH, Kim H, Joo I, Lee JM. Combined hepatocellular-cholangiocarcinoma: changes in the 2019 world health organization histological classification system and potential impact on imaging-based diagnosis. Korean J Radiol. 2020;21:1115.
2. Siegel RL, Miller KD, Wagle NS, Jemal A. Cancer statistics, 2023. CA Cancer J Clin. 2023;73:17-48.
3. Stroescu C, Herlea V, Dragnea A, et al. The diagnostic value of cytokeratins and carcinoembryonic antigen immunostaining in differentiating hepatocellular carcinomas from intrahepatic cholangiocarcinomas. J Gastrointestin Liver Dis. 2006;15:9-14.
4. Lin DC, Mayakonda A, Dinh HQ, et al. Genomic and epigenomic heterogeneity of hepatocellular carcinoma. Cancer Res. 2017;77:2255-65.
5. Lu XY, Xi T, Lau WY, et al. Hepatocellular carcinoma expressing cholangiocyte phenotype is a novel subtype with highly aggressive behavior. Ann Surg Oncol. 2011;18:2210-7.
6. Cong WM, Bu H, Chen J, et al. Practice guidelines for the pathological diagnosis of primary liver cancer: 2015 update. World J Gastroenterol. 2016;22:9279.
7. Wang Y, Wang X, Huang X, et al. Integrated Genomic and Transcriptomic Analysis reveals key genes for predicting dual-phenotype Hepatocellular Carcinoma Prognosis. J. Cancer. 2021;12:2993-3010.
8. Takano M, Shimada K, Fujii T, et al. Keratin 19 as a key molecule in progression of human hepatocellular carcinomas through invasion and angiogenesis. BMC Cancer. 2016;16:903.
9. Kawai T, Yasuchika K, Ishii T, et al. Keratin 19, a cancer stem cell marker in human hepatocellular carcinoma. Clin Cancer Res. 2015;21:3081-91.
10. Lee JI. Prognosis of hepatocellular carcinoma expressing cytokeratin 19: comparison with other liver cancers. World J Gastroenterol. 2012;18:4751.
11. Govaere O, Komuta M, Berkers J, et al. Keratin 19: a key role player in the invasion of human hepatocellular carcinomas. Gut. 2014;63:674-85.
12. Liu MT, Zhang JY, Xu L, et al. A multivariate model based on gadoxetic acid-enhanced MRI using Li-RADS v2018 and other imaging features for preoperative prediction of dual‑phenotype hepatocellular carcinoma. Radiol med. 2023;128:1333-46.
13. Chen S, Feng S, Wei J, et al. Pretreatment prediction of immunoscore in hepatocellular cancer: a radiomics-based clinical model based on Gd-EOB-DTPA-enhanced MRI imaging. Eur Radiol. 2019;29:4177-87.
14. Gu HX, Huang XS, Xu JX, Zhu P, Xu JF, Fan SF. Diagnostic value of MRI features in dual-phenotype hepatocellular carcinoma: a preliminary study. J Digit Imaging. 2023;36:2554-66.
15. Feng Z, Li H, Liu Q, et al. CT radiomics to predict macrotrabecular-massive subtype and immune status in hepatocellular carcinoma. Radiology. 2023;307:e221291.
16. Ali MU, Kim KS, Khalid M, Farrash M, Zafar A, Lee SW. Enhancing Alzheimer’s disease diagnosis and staging: a multistage CNN framework using MRI. Front. Psychiatry. 2024;15:1395563.
17. Li M, Fan Y, You H, et al. Dual-energy CT deep learning radiomics to predict macrotrabecular-massive hepatocellular carcinoma. Radiology. 2023;308:e230255.
18. Chernyak V, Fowler KJ, Kamaya A, et al. Liver Imaging Reporting and Data System (LI-RADS) version 2018: imaging of hepatocellular carcinoma in at-risk patients. Radiology. 2018;289:816-30.
19. Wu Q, Yu YX, Zhang T, et al. Preoperative diagnosis of dual-phenotype hepatocellular carcinoma using enhanced MRI radiomics models. J Magn Reson Imaging. 2022;57:1185-96.
20. Rhee H, Kim H, Park YN. Clinico-radio-pathological and molecular features of hepatocellular carcinomas with keratin 19 expression. Liver Cancer. 2020;9:663-81.
21. Fatourou E, Koskinas J, Karandrea D, et al. Keratin 19 protein expression is an independent predictor of survival in human hepatocellular carcinoma. Eur J Gastroenterol Hepatol. 2015;27:1094-102.
22. Huang X, Long L, Wei J, et al. Radiomics for diagnosis of dual-phenotype hepatocellular carcinoma using Gd-EOB-DTPA-enhanced MRI and patient prognosis. J Cancer Res Clin Oncol. 2019;145:2995-3003.
23. Cai Y, Long Y, Han Z, et al. Swin Unet3D: a three-dimensional medical image segmentation network combining vision transformer and convolution. BMC Med Inform Decis Mak. 2023;23:33.
24. Wu M, Qian Y, Liao X, Wang Q, Heng PA. Hepatic vessel segmentation based on 3D swin-transformer with inductive biased multi-head self-attention. BMC Med Imaging. 2023;23:91.
25. Shamshad F, Khan S, Zamir SW, et al. Transformers in medical imaging: a survey. Med Image Anal. 2023;88:102802.
26. Liu Z, Lin Y, Cao Y, et al. Swin transformer: hierarchical vision transformer using shifted windows. In: 2021 IEEE/CVF International Conference on Computer Vision (ICCV); 2021 Oct 10-17; Montreal, Canada. IEEE; 2021. pp. 9992-10002.
27. He X, Xu Y, Zhou C, et al. Prediction of microvascular invasion and pathological differentiation of hepatocellular carcinoma based on a deep learning model. Eur J Radiol. 2024;172:111348.
28. Wang W, Wang Y, Song D, et al. A Transformer-Based microvascular invasion classifier enhances prognostic stratification in HCC following radiofrequency ablation. Liver Int. 2024;44:894-906.
29. Zhao L, Bao J, Wang X, et al. Detecting adverse pathology of prostate cancer with a deep learning approach based on a 3D swin-transformer Model and biparametric MRI: a multicenter retrospective study. J Magn Reson Imaging. 2023;59:2101-12.
30. Ali MU, Zafar A, Kim S, Kim KS, Lee SW. From task-specific to foundation models: a paradigm shift in medical vision-language analysis. Comput Sci Rev. 2026;59:100831.
31. Li L, Zhou X, Cui W, et al. Combining radiomics and deep learning features of intra-tumoral and peri-tumoral regions for the classification of breast cancer lung metastasis and primary lung cancer with low-dose CT. J Cancer Res Clin Oncol. 2023;149:15469-78.
32. Yang L, Xu P, Zhang Y, et al. A deep learning radiomics model may help to improve the prediction performance of preoperative grading in meningioma. Neuroradiology. 2022;64:1373-82.
33. Kim H, Choi GH, Na DC, et al. Human hepatocellular carcinomas with “Stemness”-related marker expression: keratin 19 expression and a poor prognosis. Hepatology. 2011;54:1707-17.
Cite This Article
How to Cite
Download Citation
Export Citation File:
Type of Import
Tips on Downloading Citation
Citation Manager File Format
Type of Import
Direct Import: When the Direct Import option is selected (the default state), a dialogue box will give you the option to Save or Open the downloaded citation data. Choosing Open will either launch your citation manager or give you a choice of applications with which to use the metadata. The Save option saves the file locally for later use.
Indirect Import: When the Indirect Import option is selected, the metadata is displayed and may be copied and pasted as needed.
About This Article
Copyright

Data & Comments
Data
0


Comments
Comments must be written in English. Spam, offensive content, impersonation, and private information will not be permitted. If any comment is reported and identified as inappropriate content by OAE staff, the comment will be removed without notice. If you have any queries or need any help, please contact us at [email protected].