
fig4
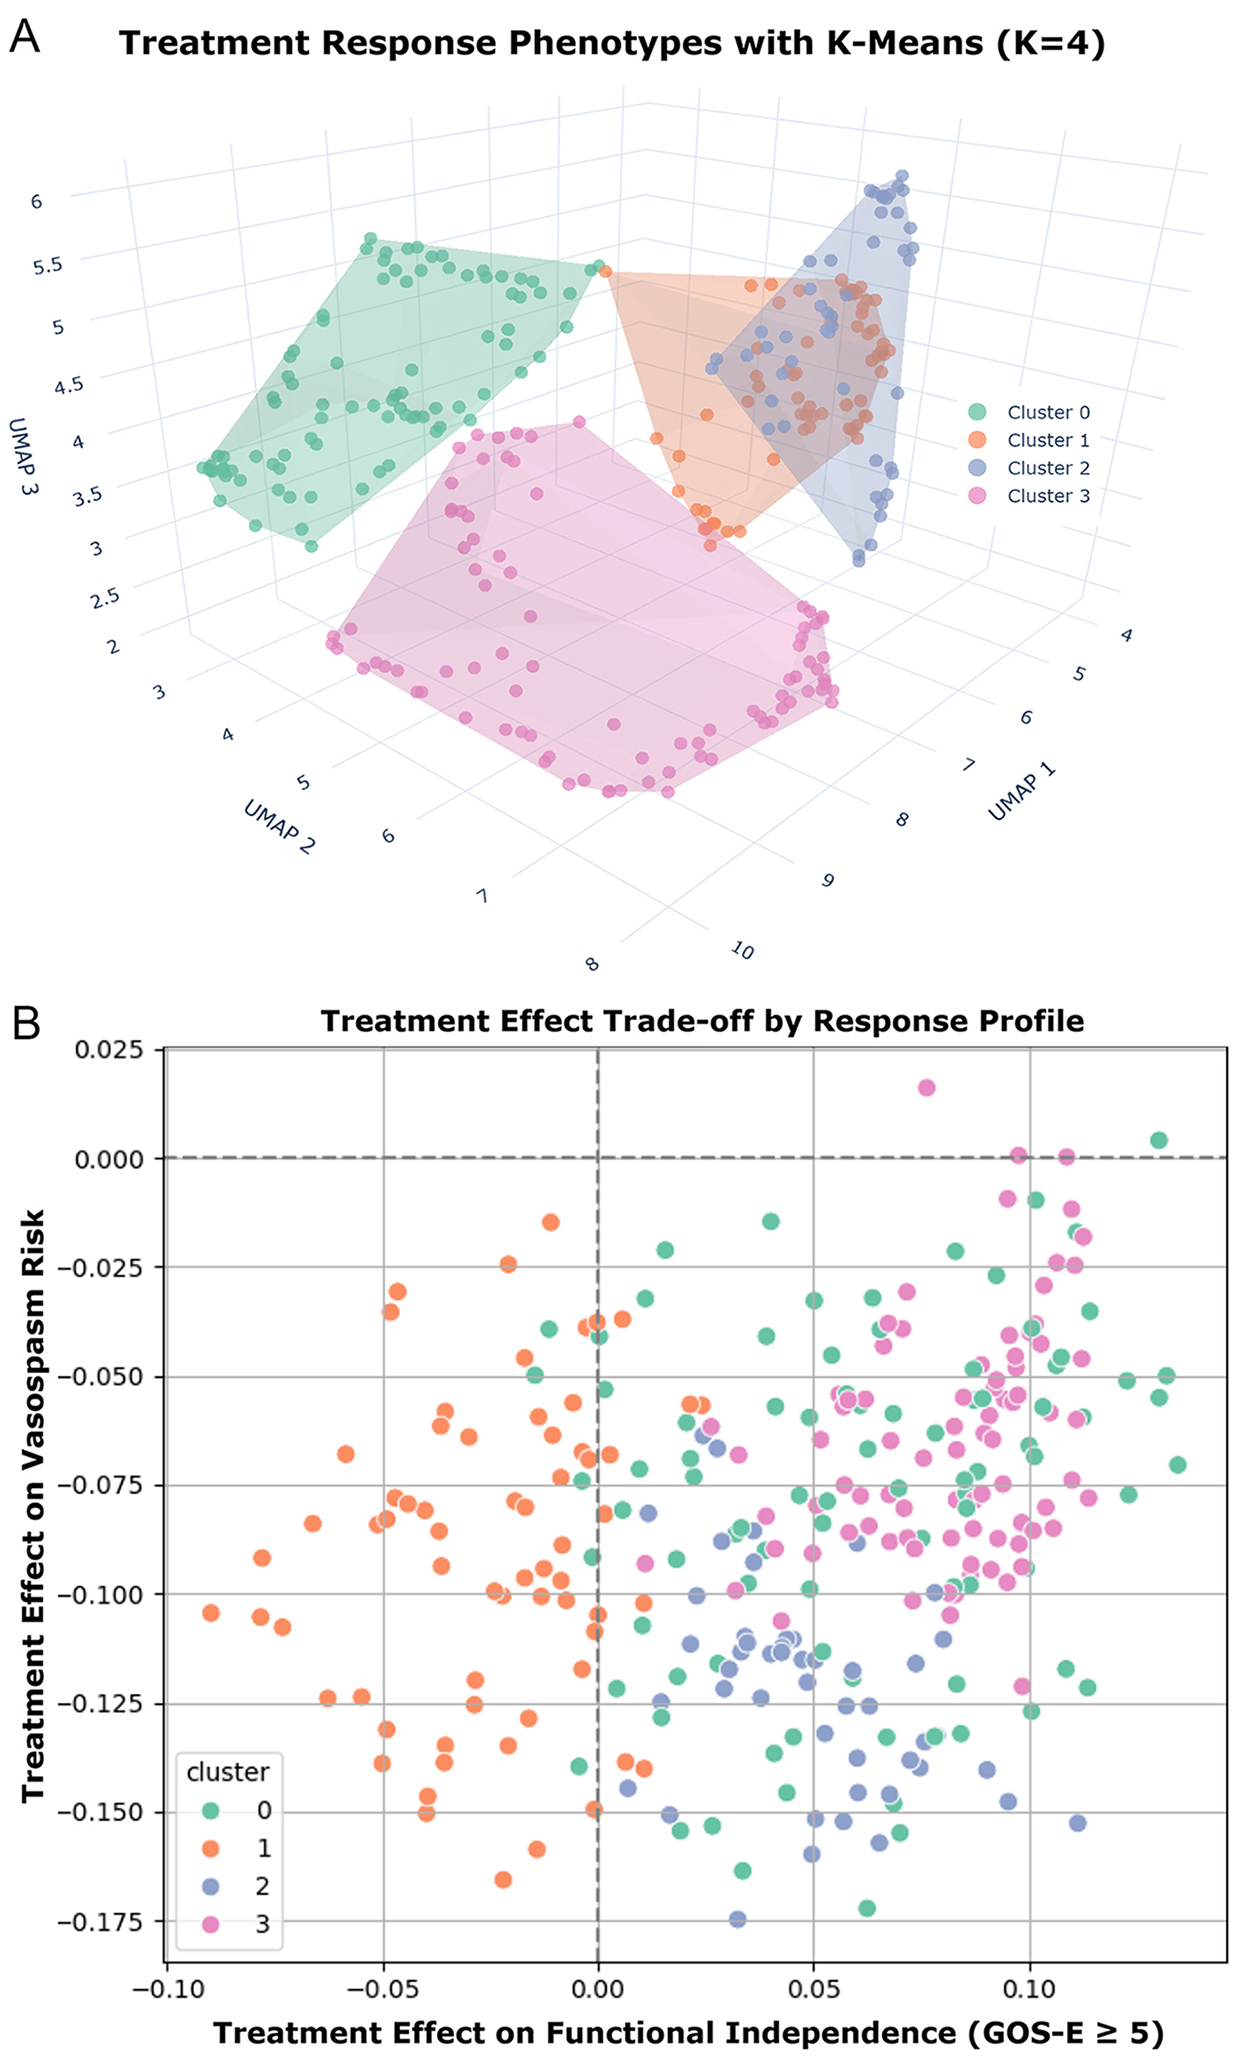
Figure 4. Clustering and trade-off analysis of treatment response phenotypes using CATEs across outcomes. (A) Clustering of patients based on their CATE vectors for all six outcomes, visualized in a UMAP-reduced space, revealed four distinct treatment response phenotypes (K-Means, K = 4); (B) Trade-off plot showing the relationship between the estimated treatment effect of prophylactic LD on vasospasm risk (y-axis) and six-month functional independence (GOS-E ≥ 5, x-axis). Each point represents an individual patient, colored by cluster membership. Cluster 1 demonstrated consistent vasospasm reduction without improvements in functional outcome, while Cluster 3 exhibited favorable trade-offs across both dimensions. Clusters 0 and 2 demonstrated a similar trade-off profile as Cluster 3, albeit with greater heterogeneity. CATEs: Conditional average treatment effects; CATE: conditional average treatment effect; UMAP: Uniform Manifold Approximation and Projection; LD: lumbar drainage; GOS-E: Glasgow Outcome Scale-Extended.