
fig4
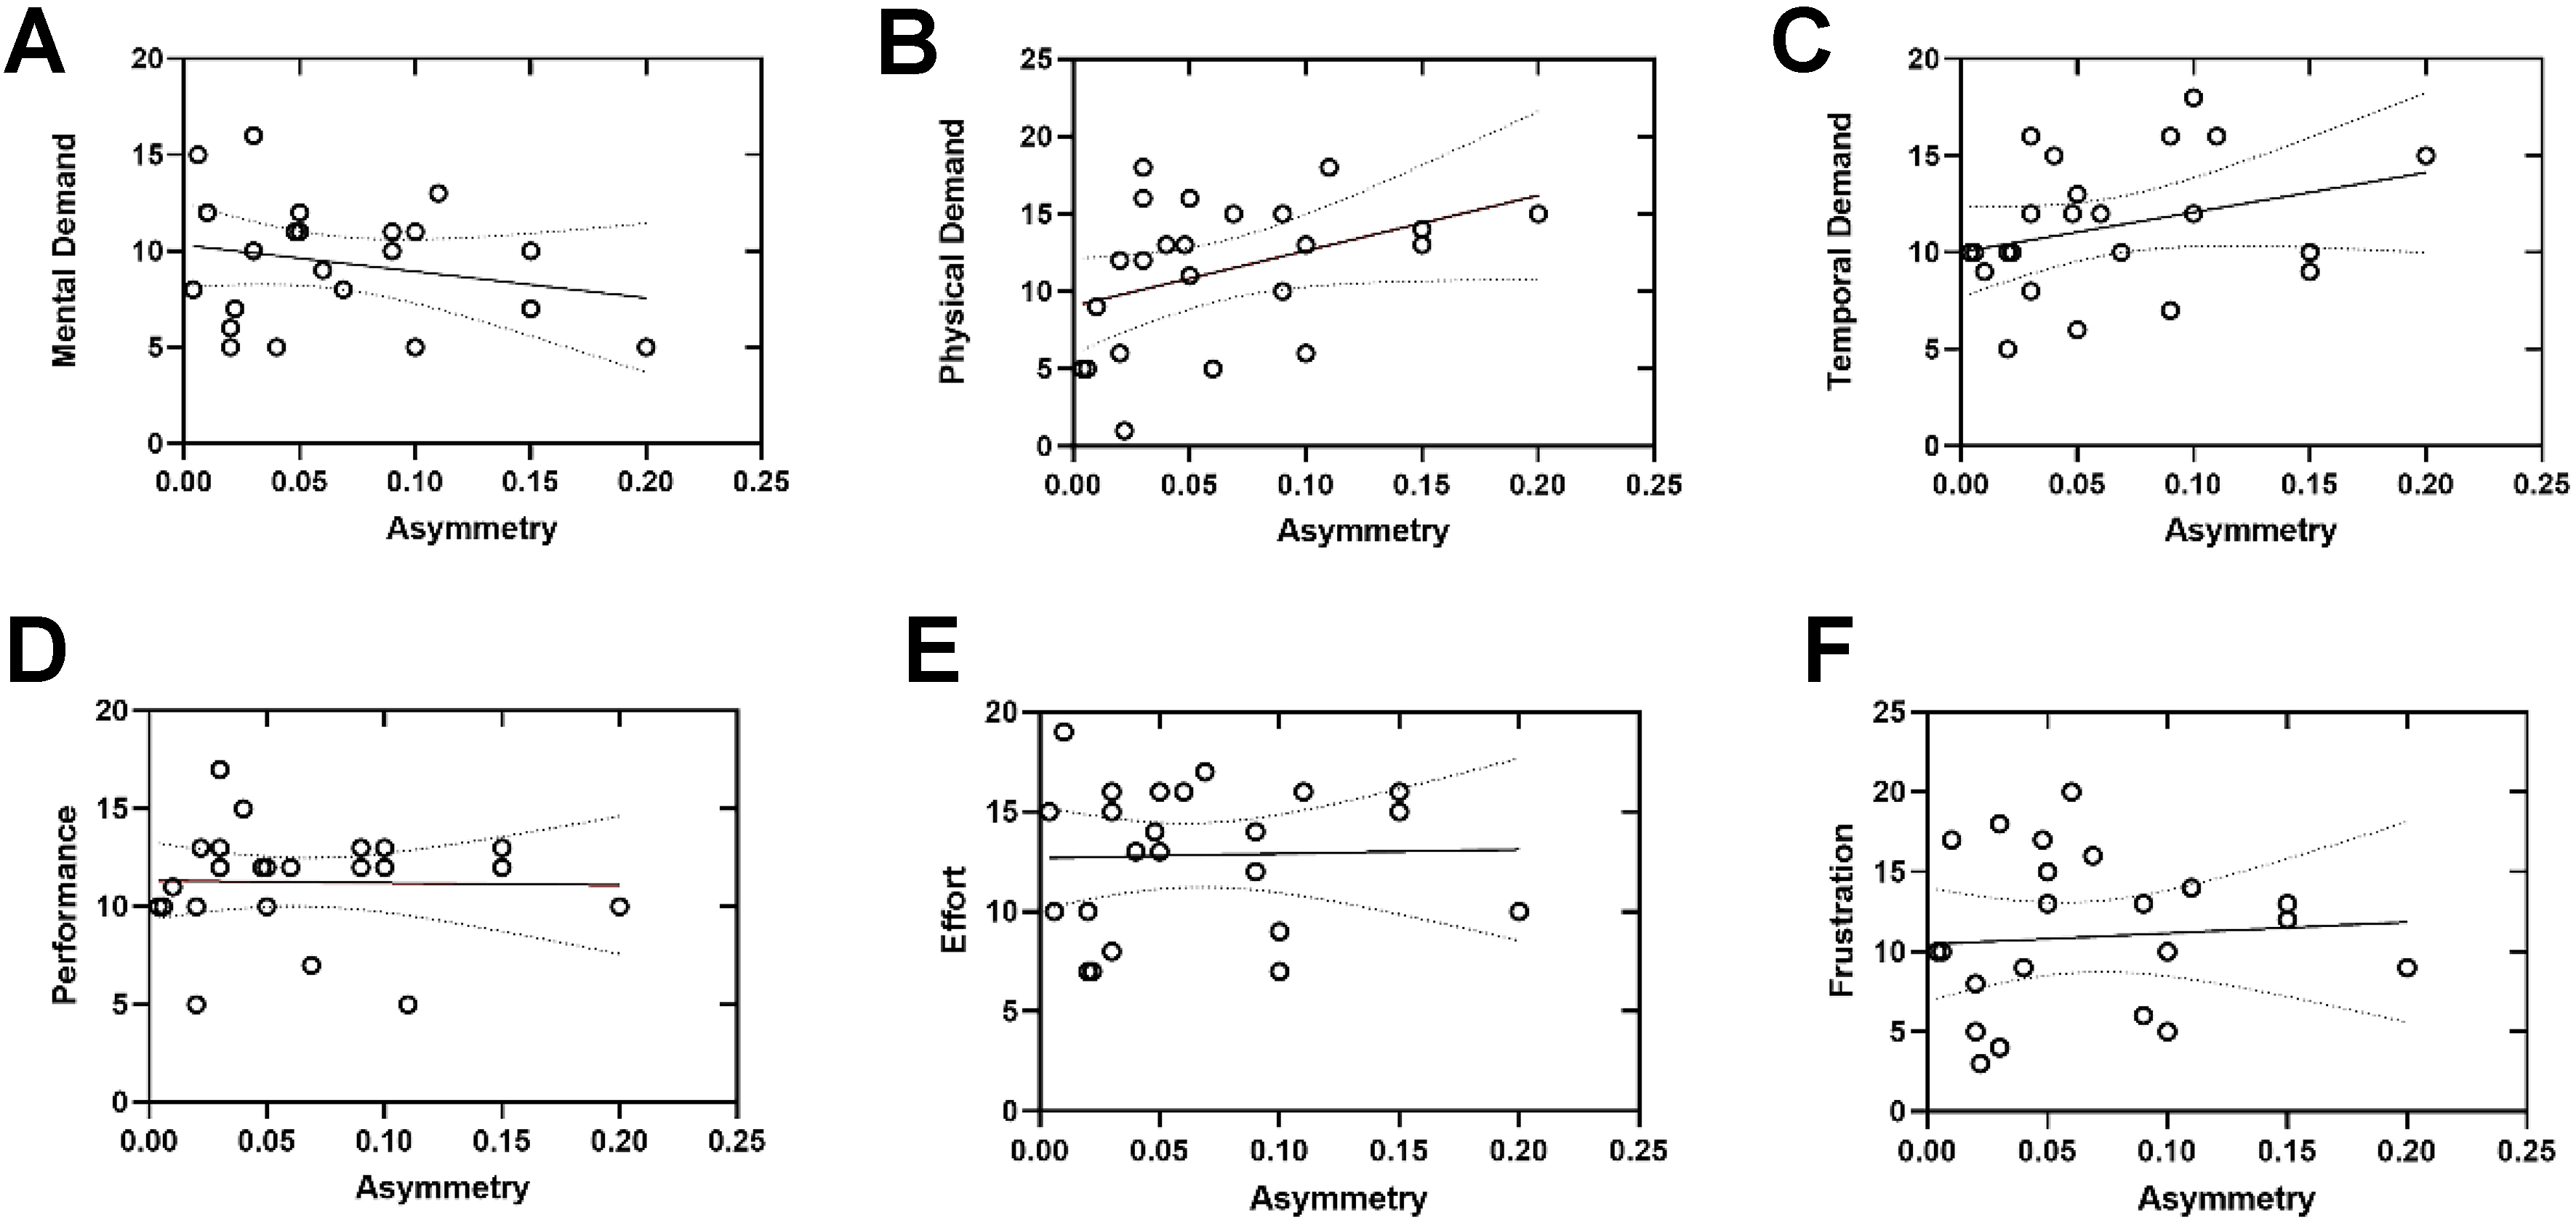
Figure 4. Simple linear regression analyses examining the relationships between the asymmetry index (x-axis, dimensionless) and NASA-TLX subscale scores [y-axis; (A) Mental demand; (B) Physical demand; (C) Temporal demand; (D) Performance; (E) Effort; (F) Frustration]. Each circle represents an individual participant. Solid lines indicate the fitted linear regression models, and dashed lines represent the 95% confidence intervals. Statistical significance was assessed using linear regression analysis, with significance defined as P < 0.05. NASA-TLX: National Aeronautics and Space Administration Task Load Index.