
fig1
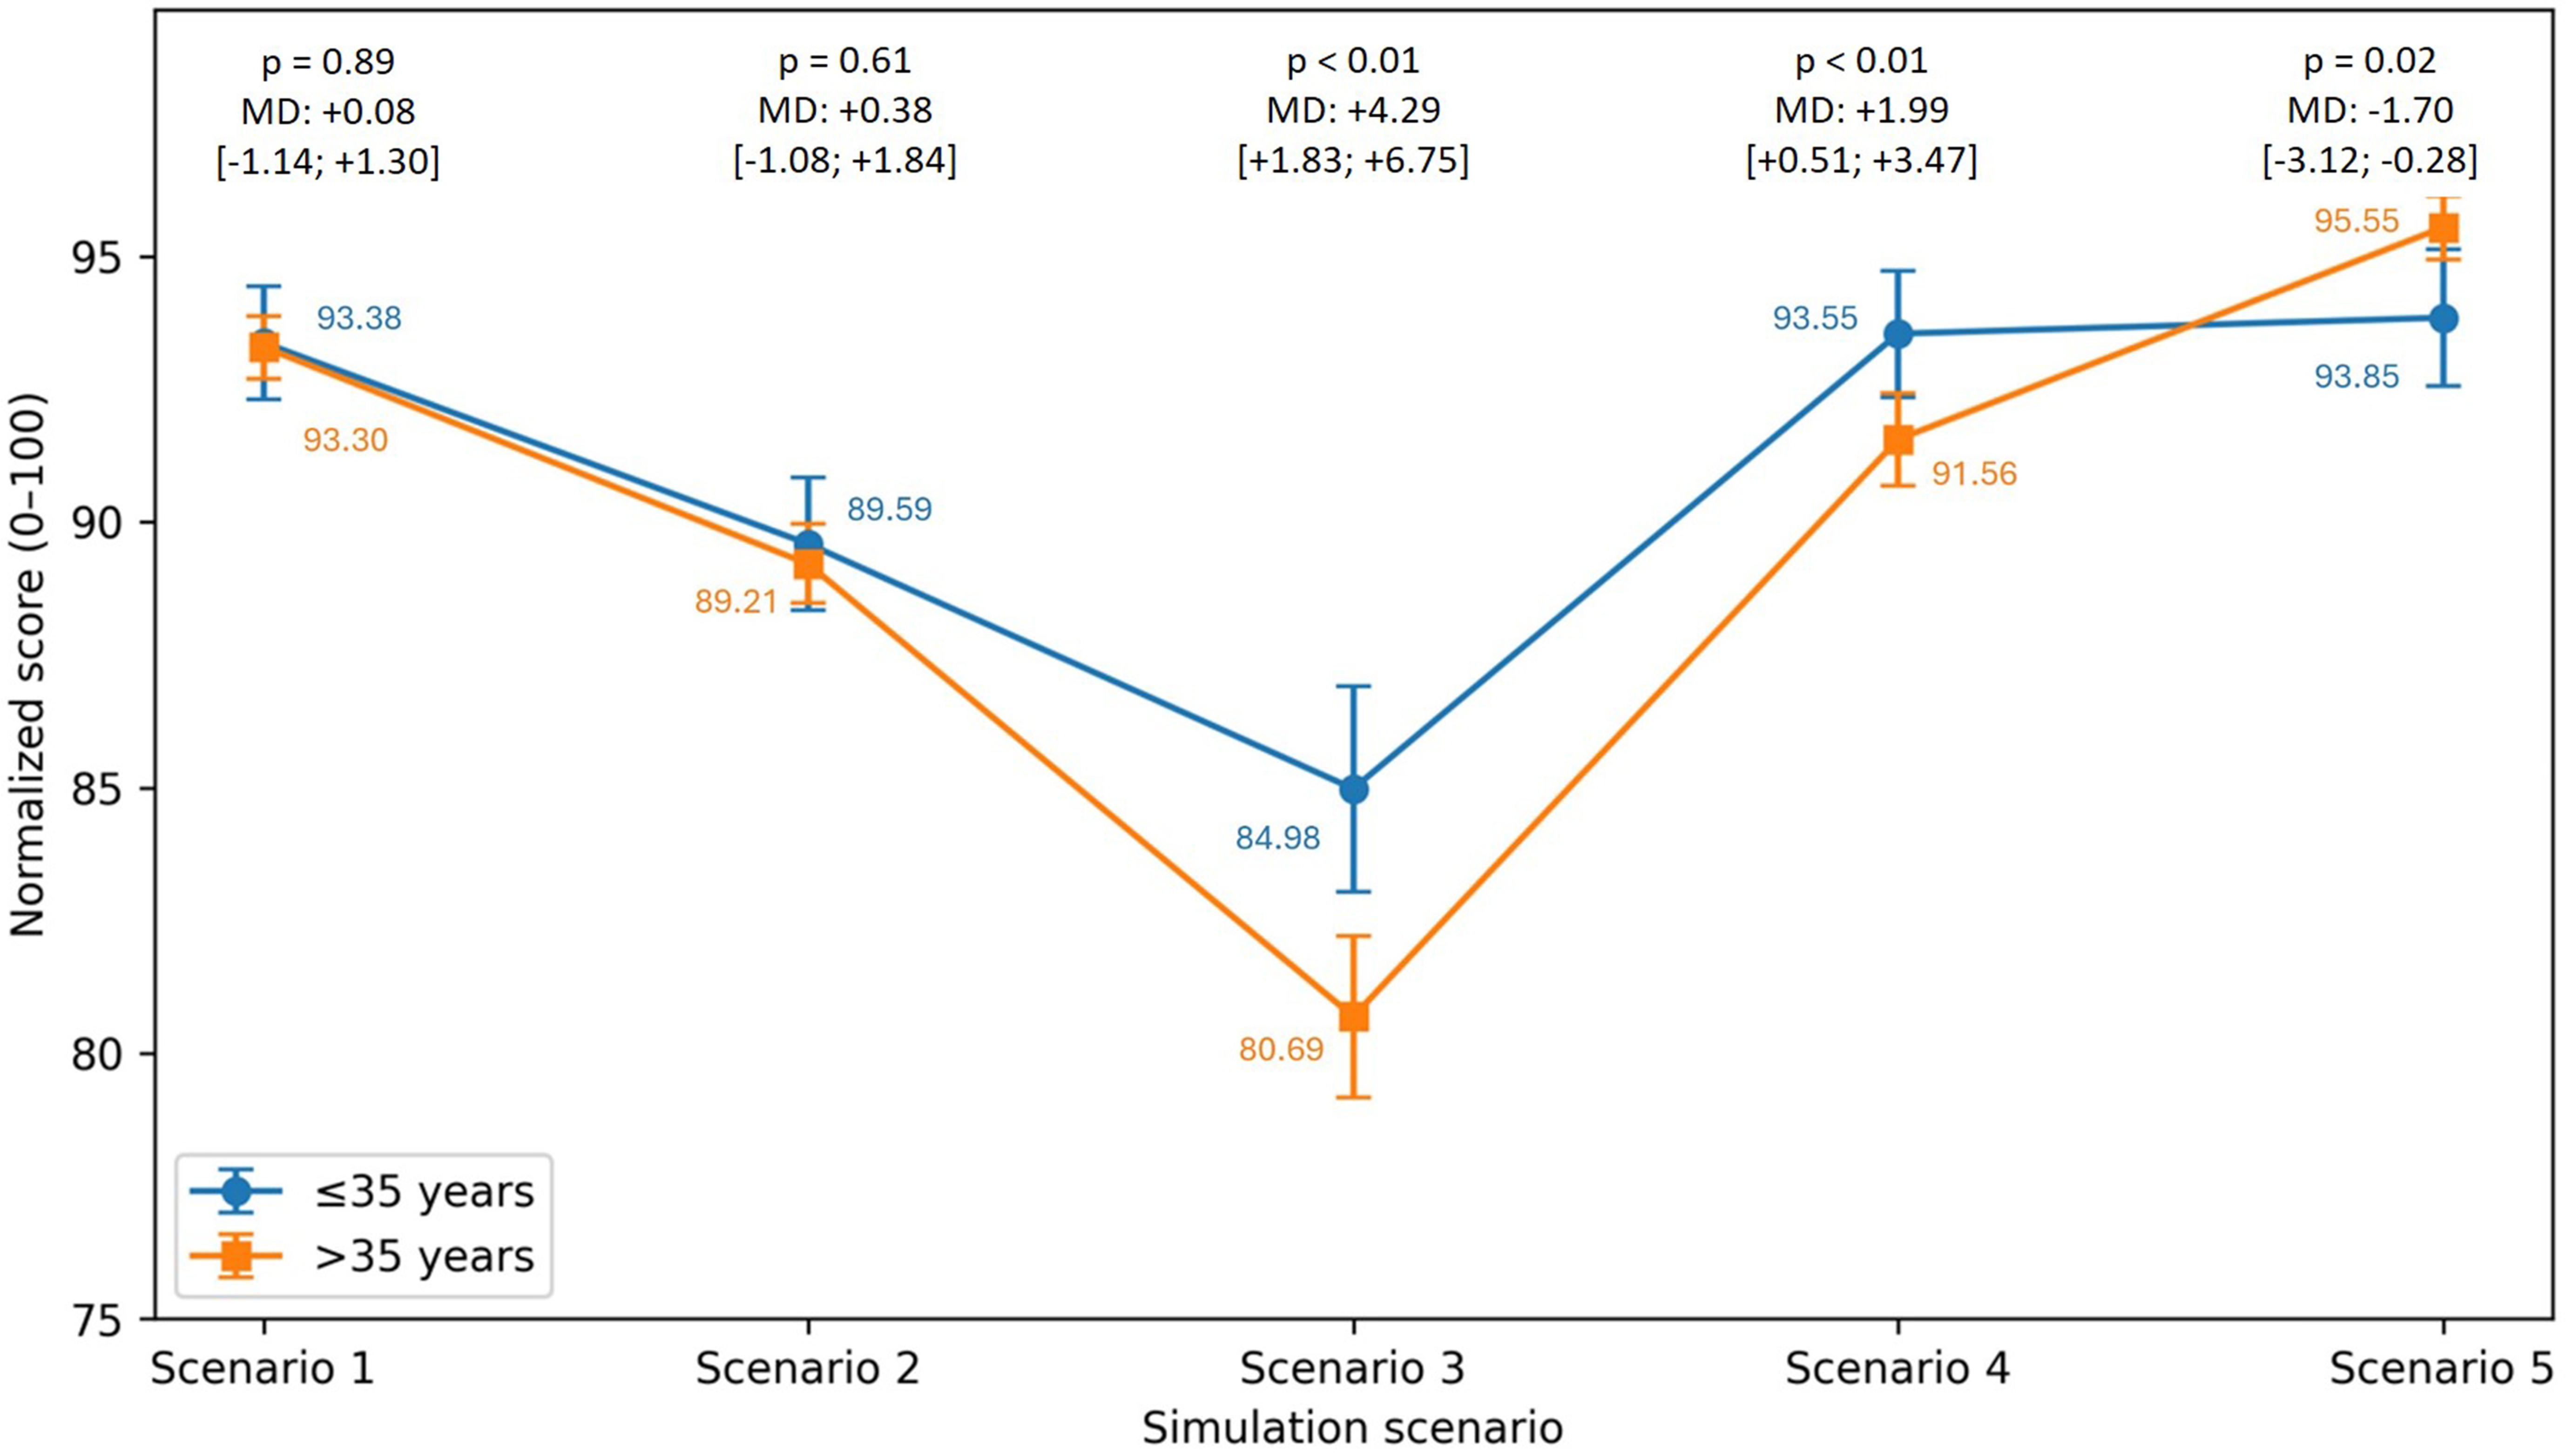
Figure 1. Scenario-specific normalized simulator scores by age cohort. Comparisons were performed between Junior (≤ 35 years; n = 120) and Senior (> 35 years; n = 340) participants within each individual scenario. For each scenario, mean scores, MD and their relative 95% confidence intervals (square brackets), with corresponding P values, are reported. MD: Mean differences.