
fig5
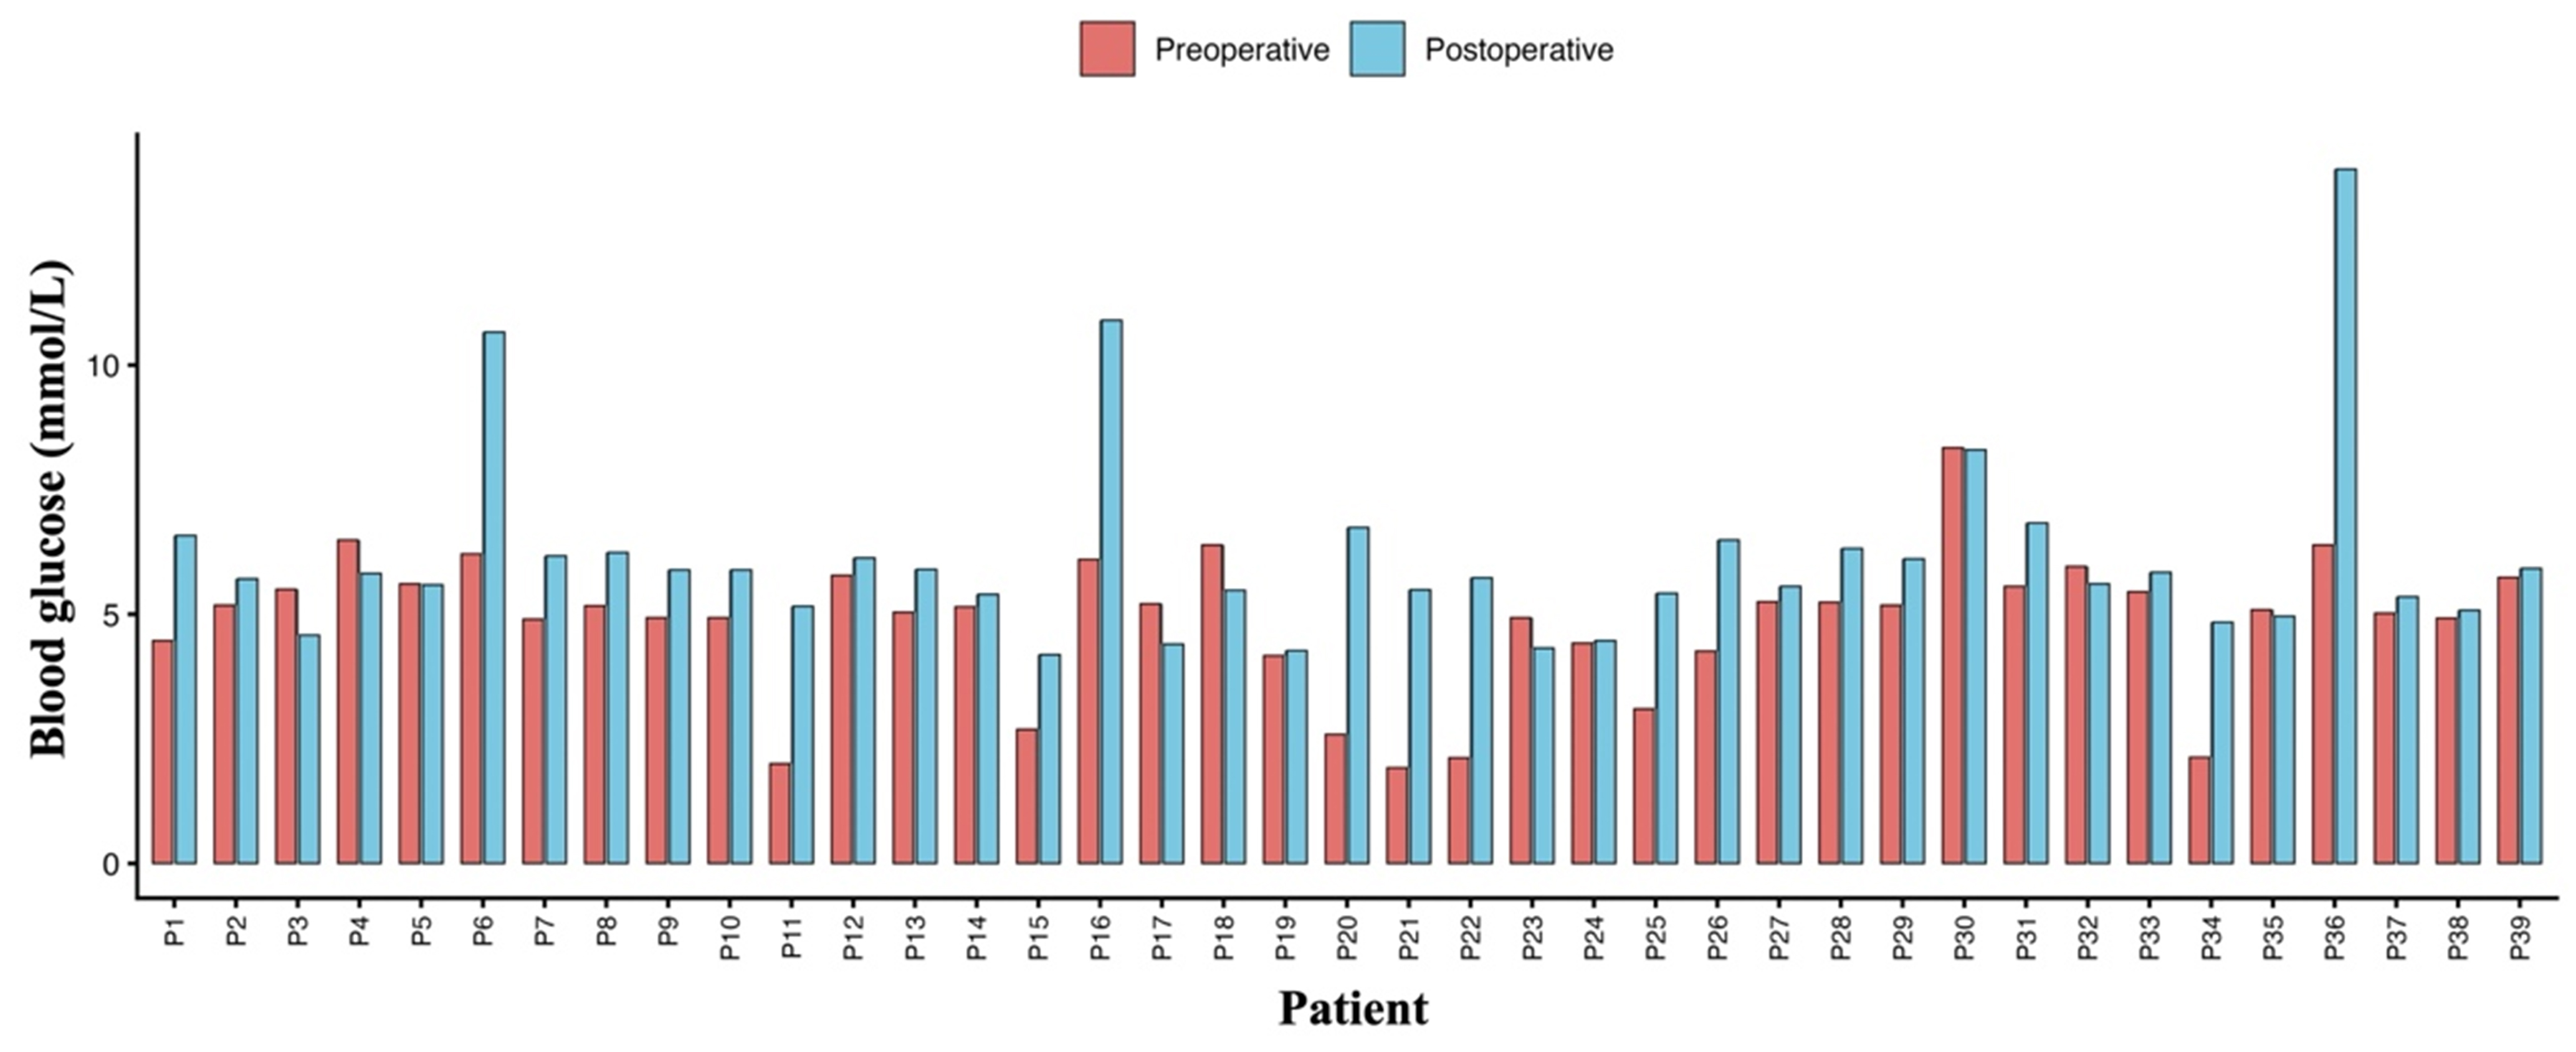
Figure 5. Individual blood glucose levels before and after function-preserving pancreatic surgery. Paired bar chart showing preoperative and postoperative blood glucose levels for each patient (P1-P39). Red bars represent preoperative measurements, and blue bars represent postoperative values obtained during follow-up. Blood glucose levels are expressed in mmol/L.