


fig2
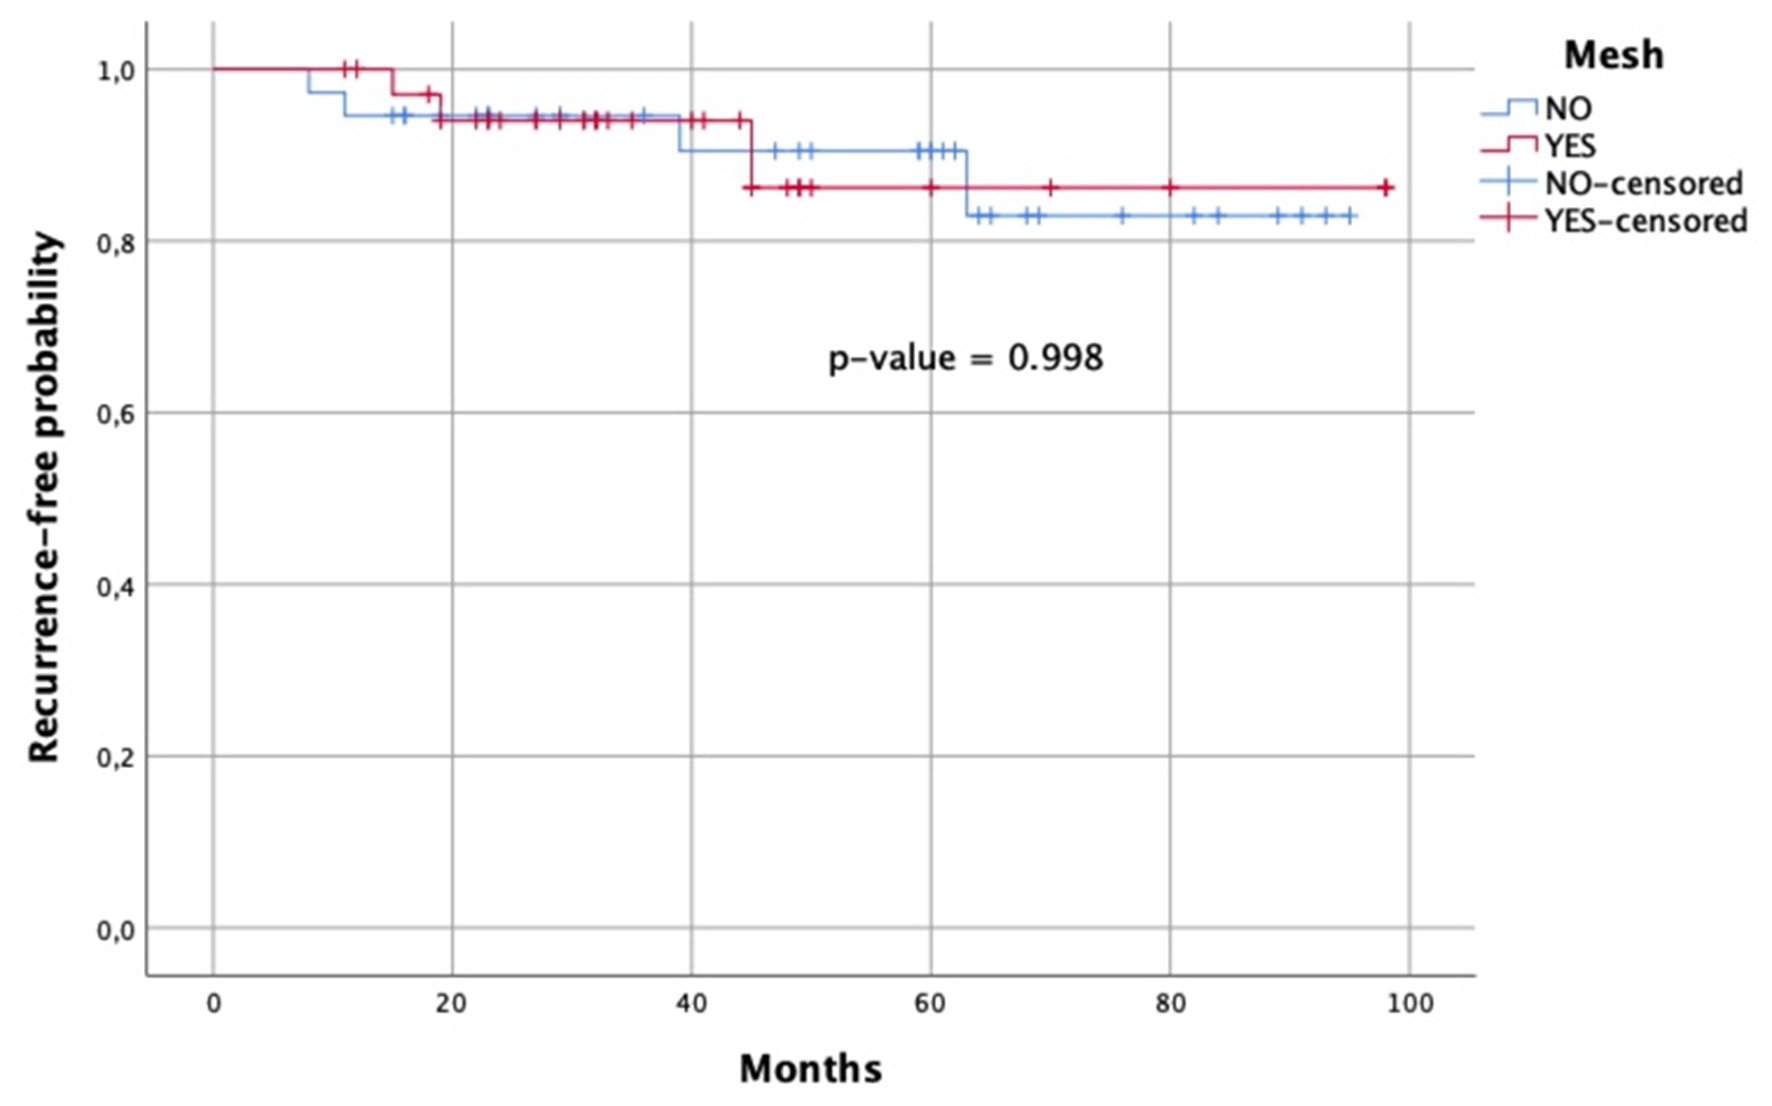
Figure 2. Kaplan-Meier survival curve of patients treated with mesh (red line) vs. no mesh (blue line). The x-axis represents time in months, and the y-axis represents recurrence-free probability.
Figure 2. Kaplan-Meier survival curve of patients treated with mesh (red line) vs. no mesh (blue line). The x-axis represents time in months, and the y-axis represents recurrence-free probability.


All published articles are preserved here permanently:
https://www.portico.org/publishers/oae/