


fig3
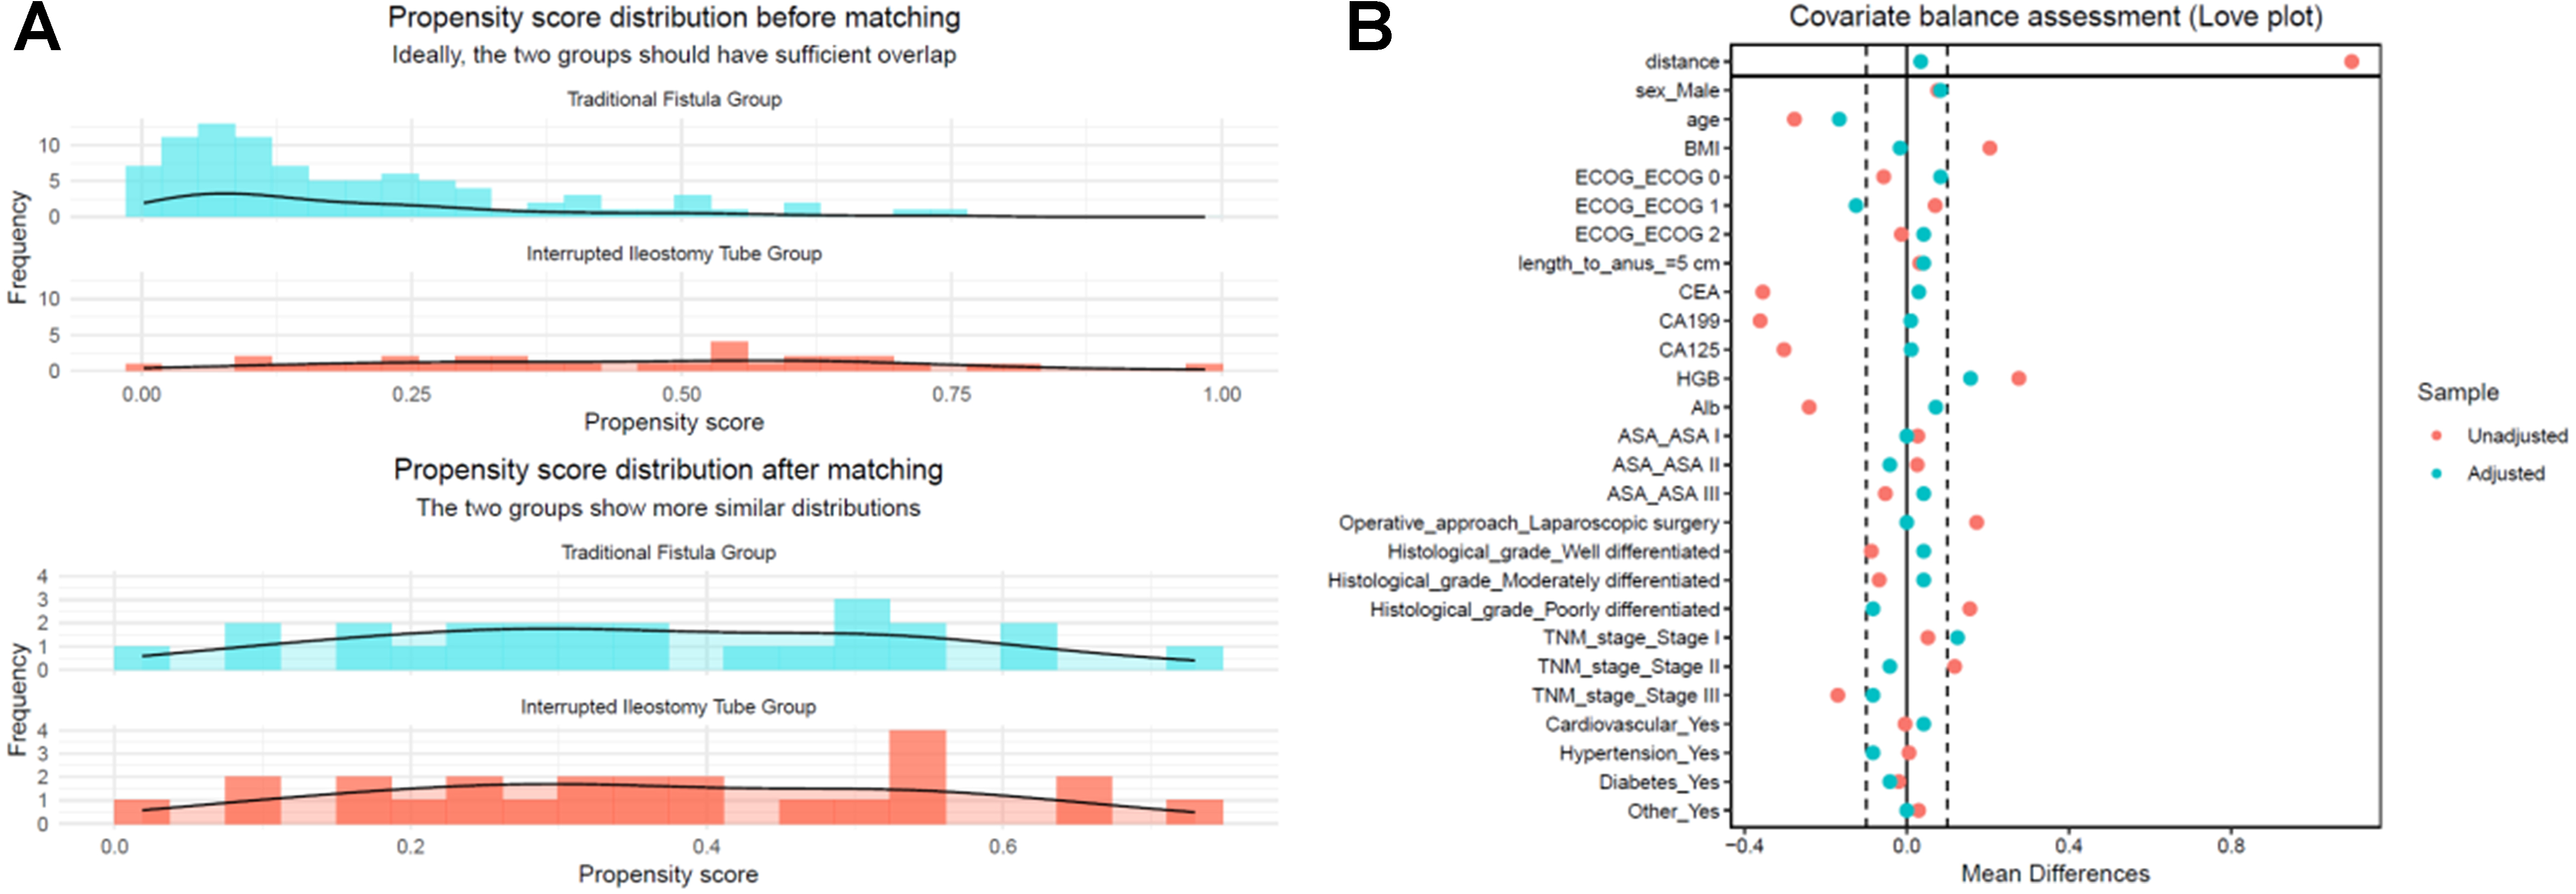
Figure 3. PSM diagnostics. (A) Love plot of absolute SMDs for baseline covariates before and after PSM; most covariates move below the prespecified balance threshold (|SMD| < 0.10) after matching; (B) Propensity score distributions for the Traditional Fistula Group and the Interrupted Ileostomy Tube Group before and after 1:1 nearest-neighbor matching, showing improved overlap in the matched cohort. PSM: Propensity score matching; SMDs: standardized mean differences; BMI: body mass index; ECOG: Eastern Cooperative Oncology Group; CEA: carcinoembryonic antigen; ASA: American Society of Anesthesiologists; TNM: tumor–node–metastasis.