


fig3
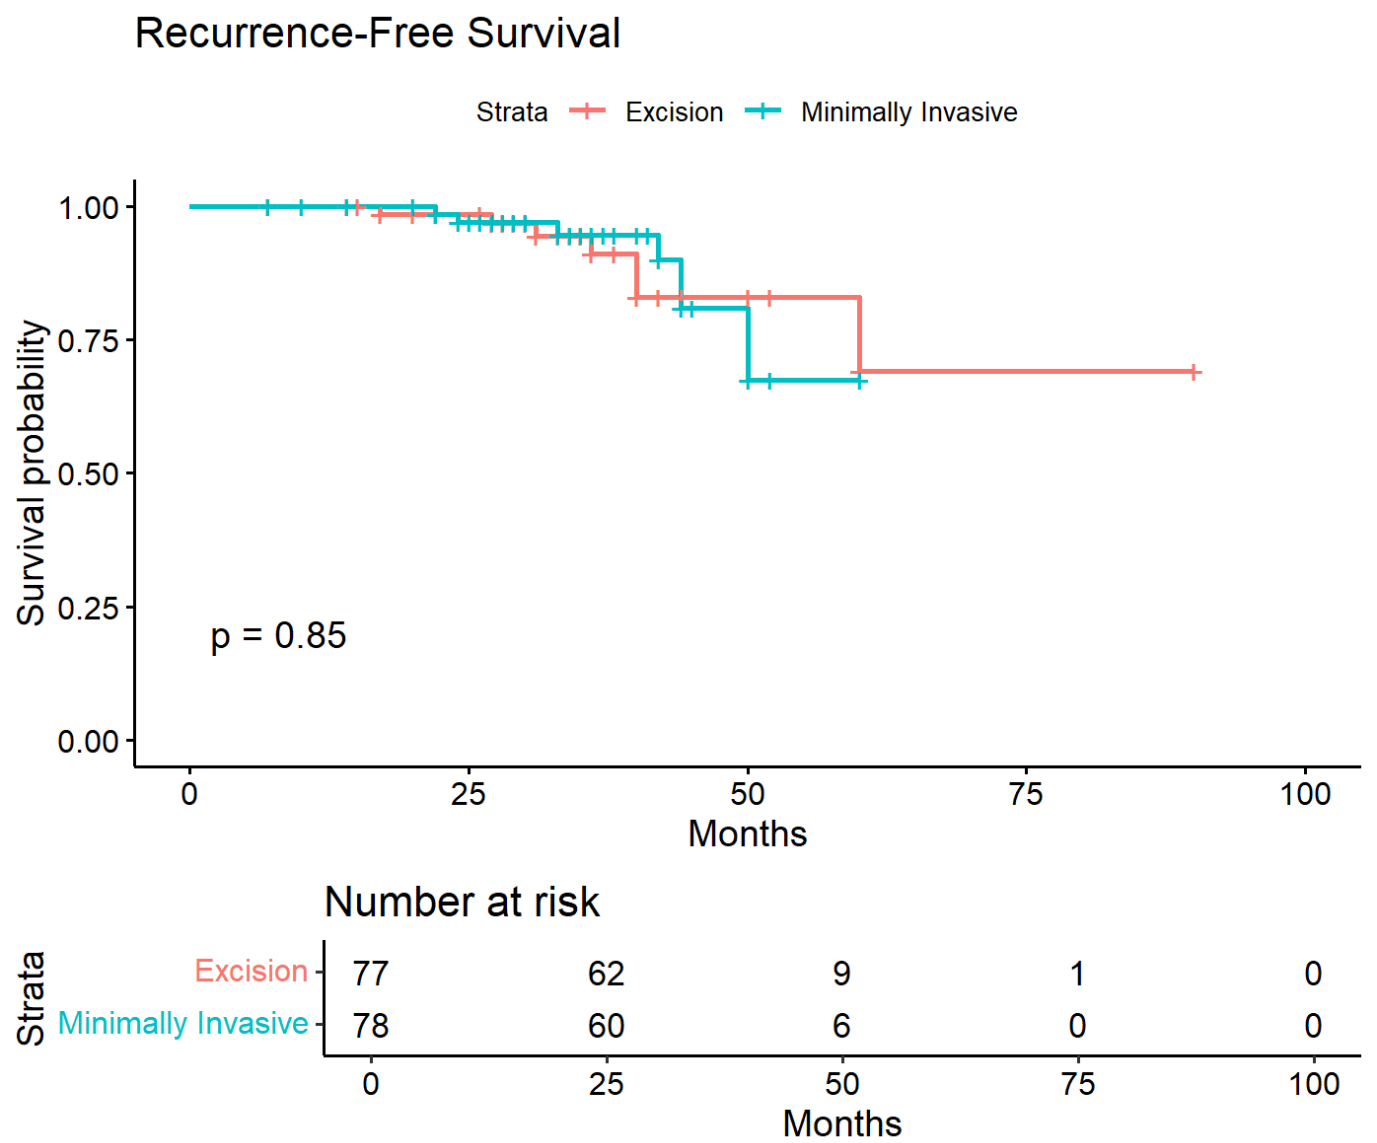
Figure 3. Kaplan-Meier recurrence-free survival curves. Comparison between wide local excision (blue) and trephination (red) groups. Groups compared using log-rank test (P = 0.85). Numbers at risk shown at 0, 25, 50, 75, and 100 months. Follow-up timing was incomplete in approximately 30% of patients; these curves should be interpreted with caution as imprecise timing data may affect survival estimates.