
fig6
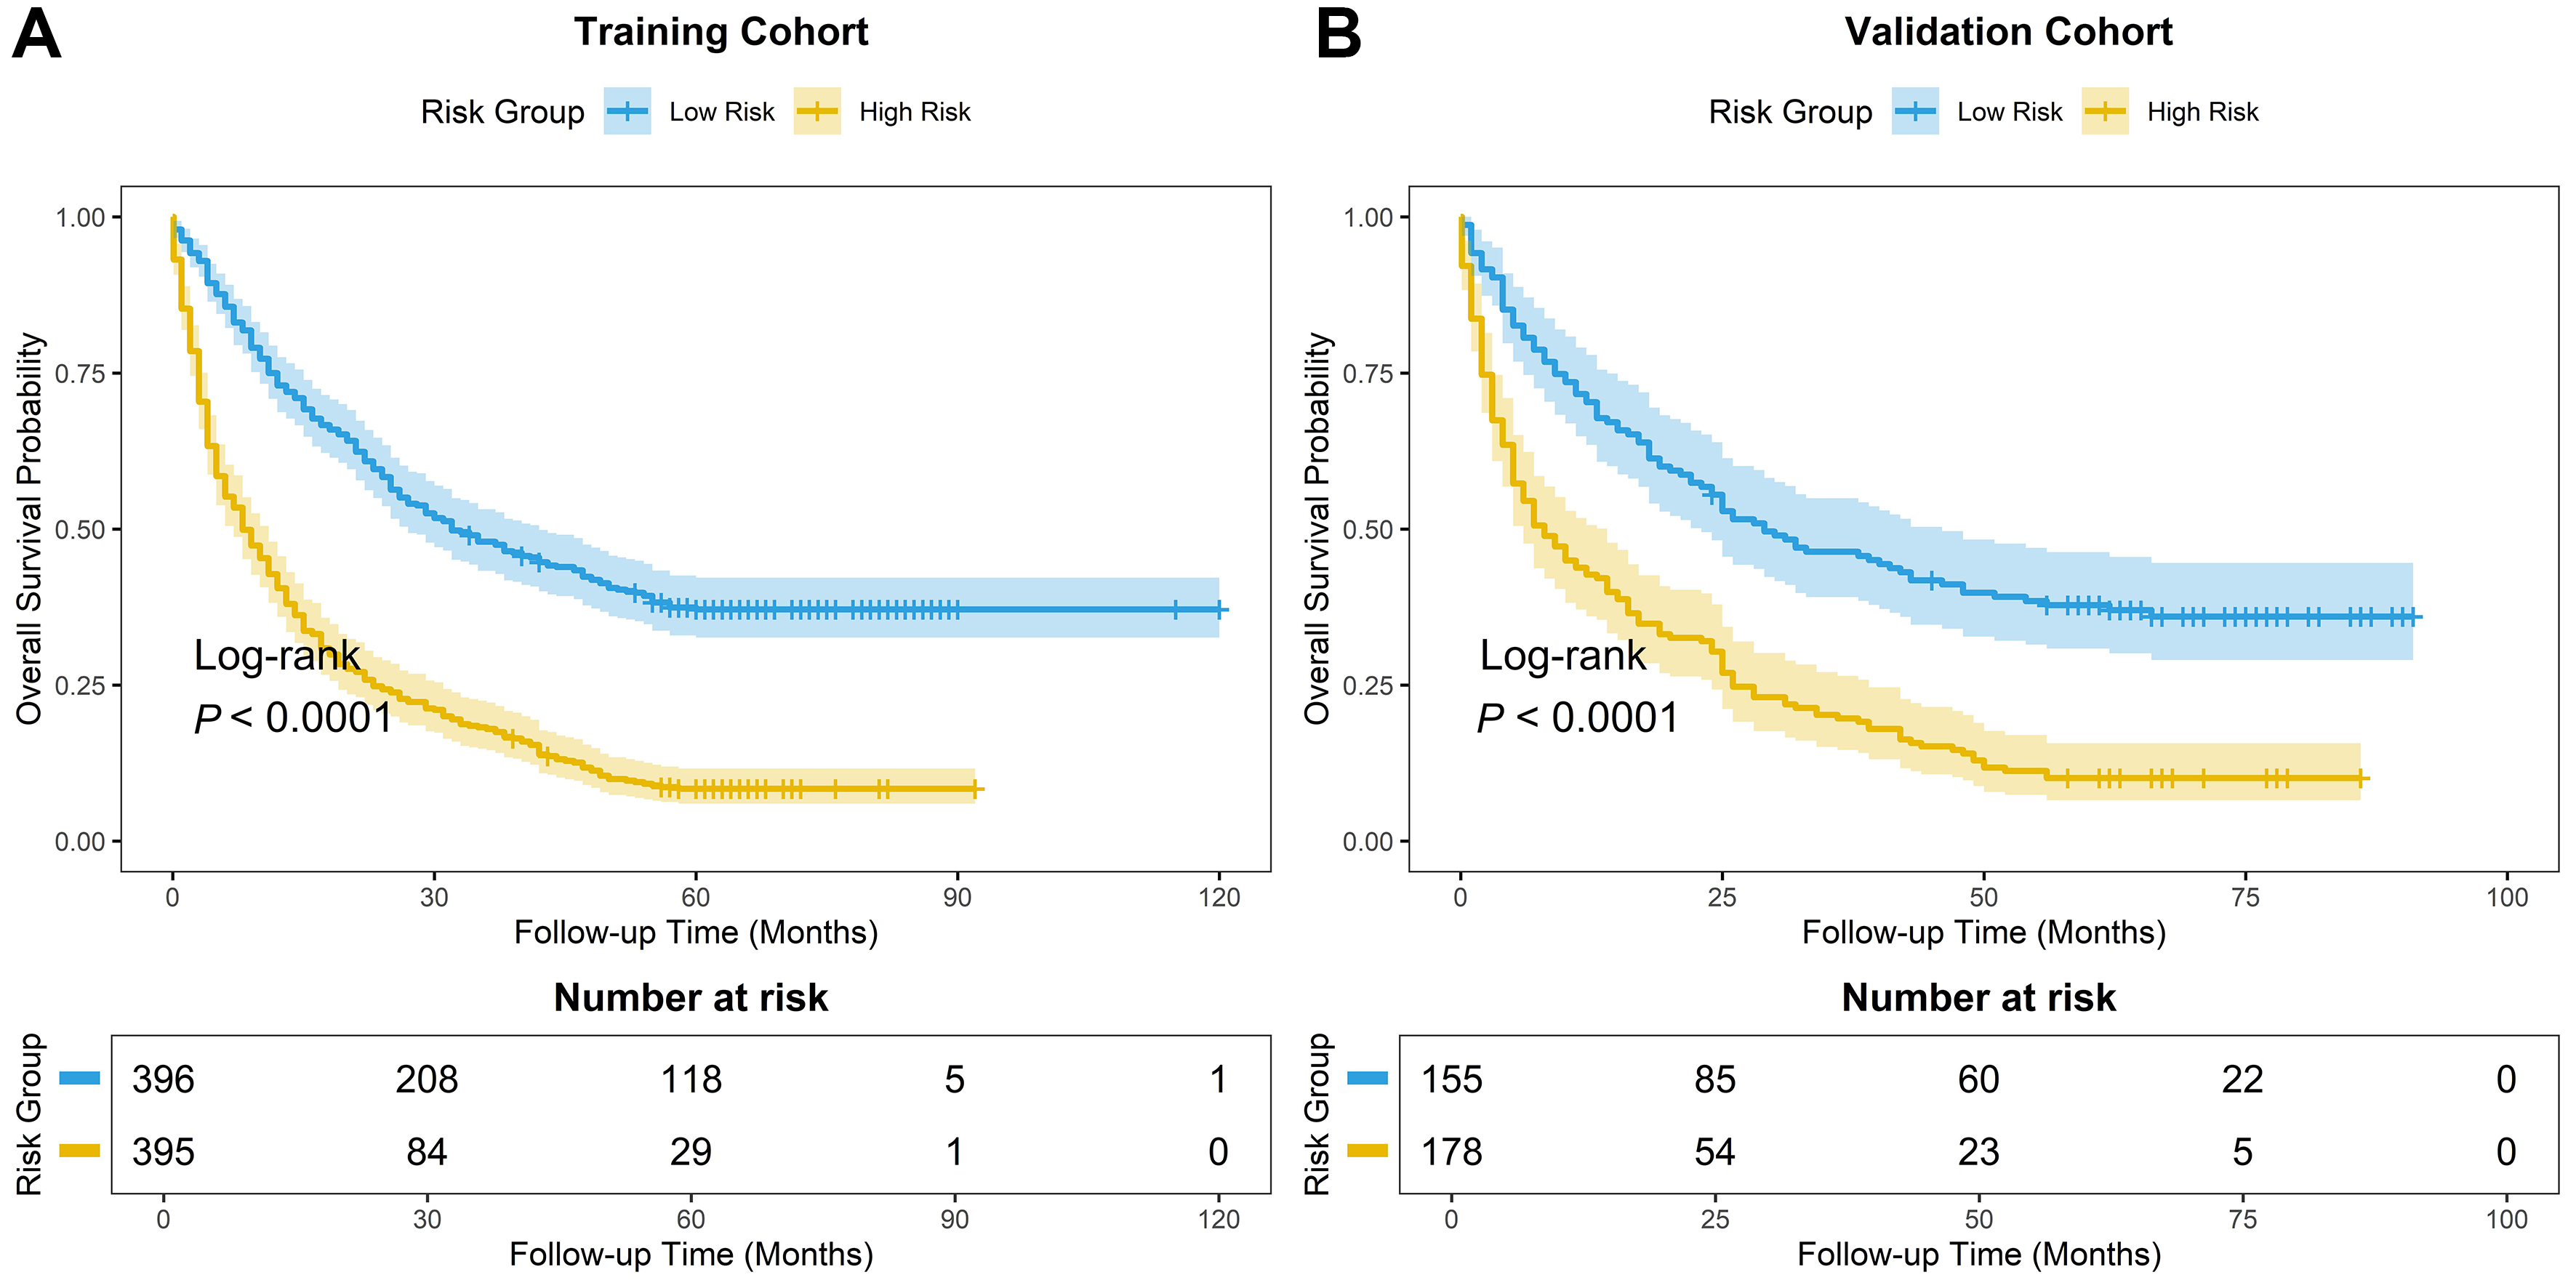
Figure 6. Kaplan-Meier survival curves for patients stratified into high- and low-risk groups. Based on the scores from the nomogram, patients were stratified into high-risk and low-risk groups. (A and B) OS curves show significant discrimination between the two groups in both cohorts: (A) training cohort; (B) validation cohort (P < 0.001). OS: Overall survival.