
fig3
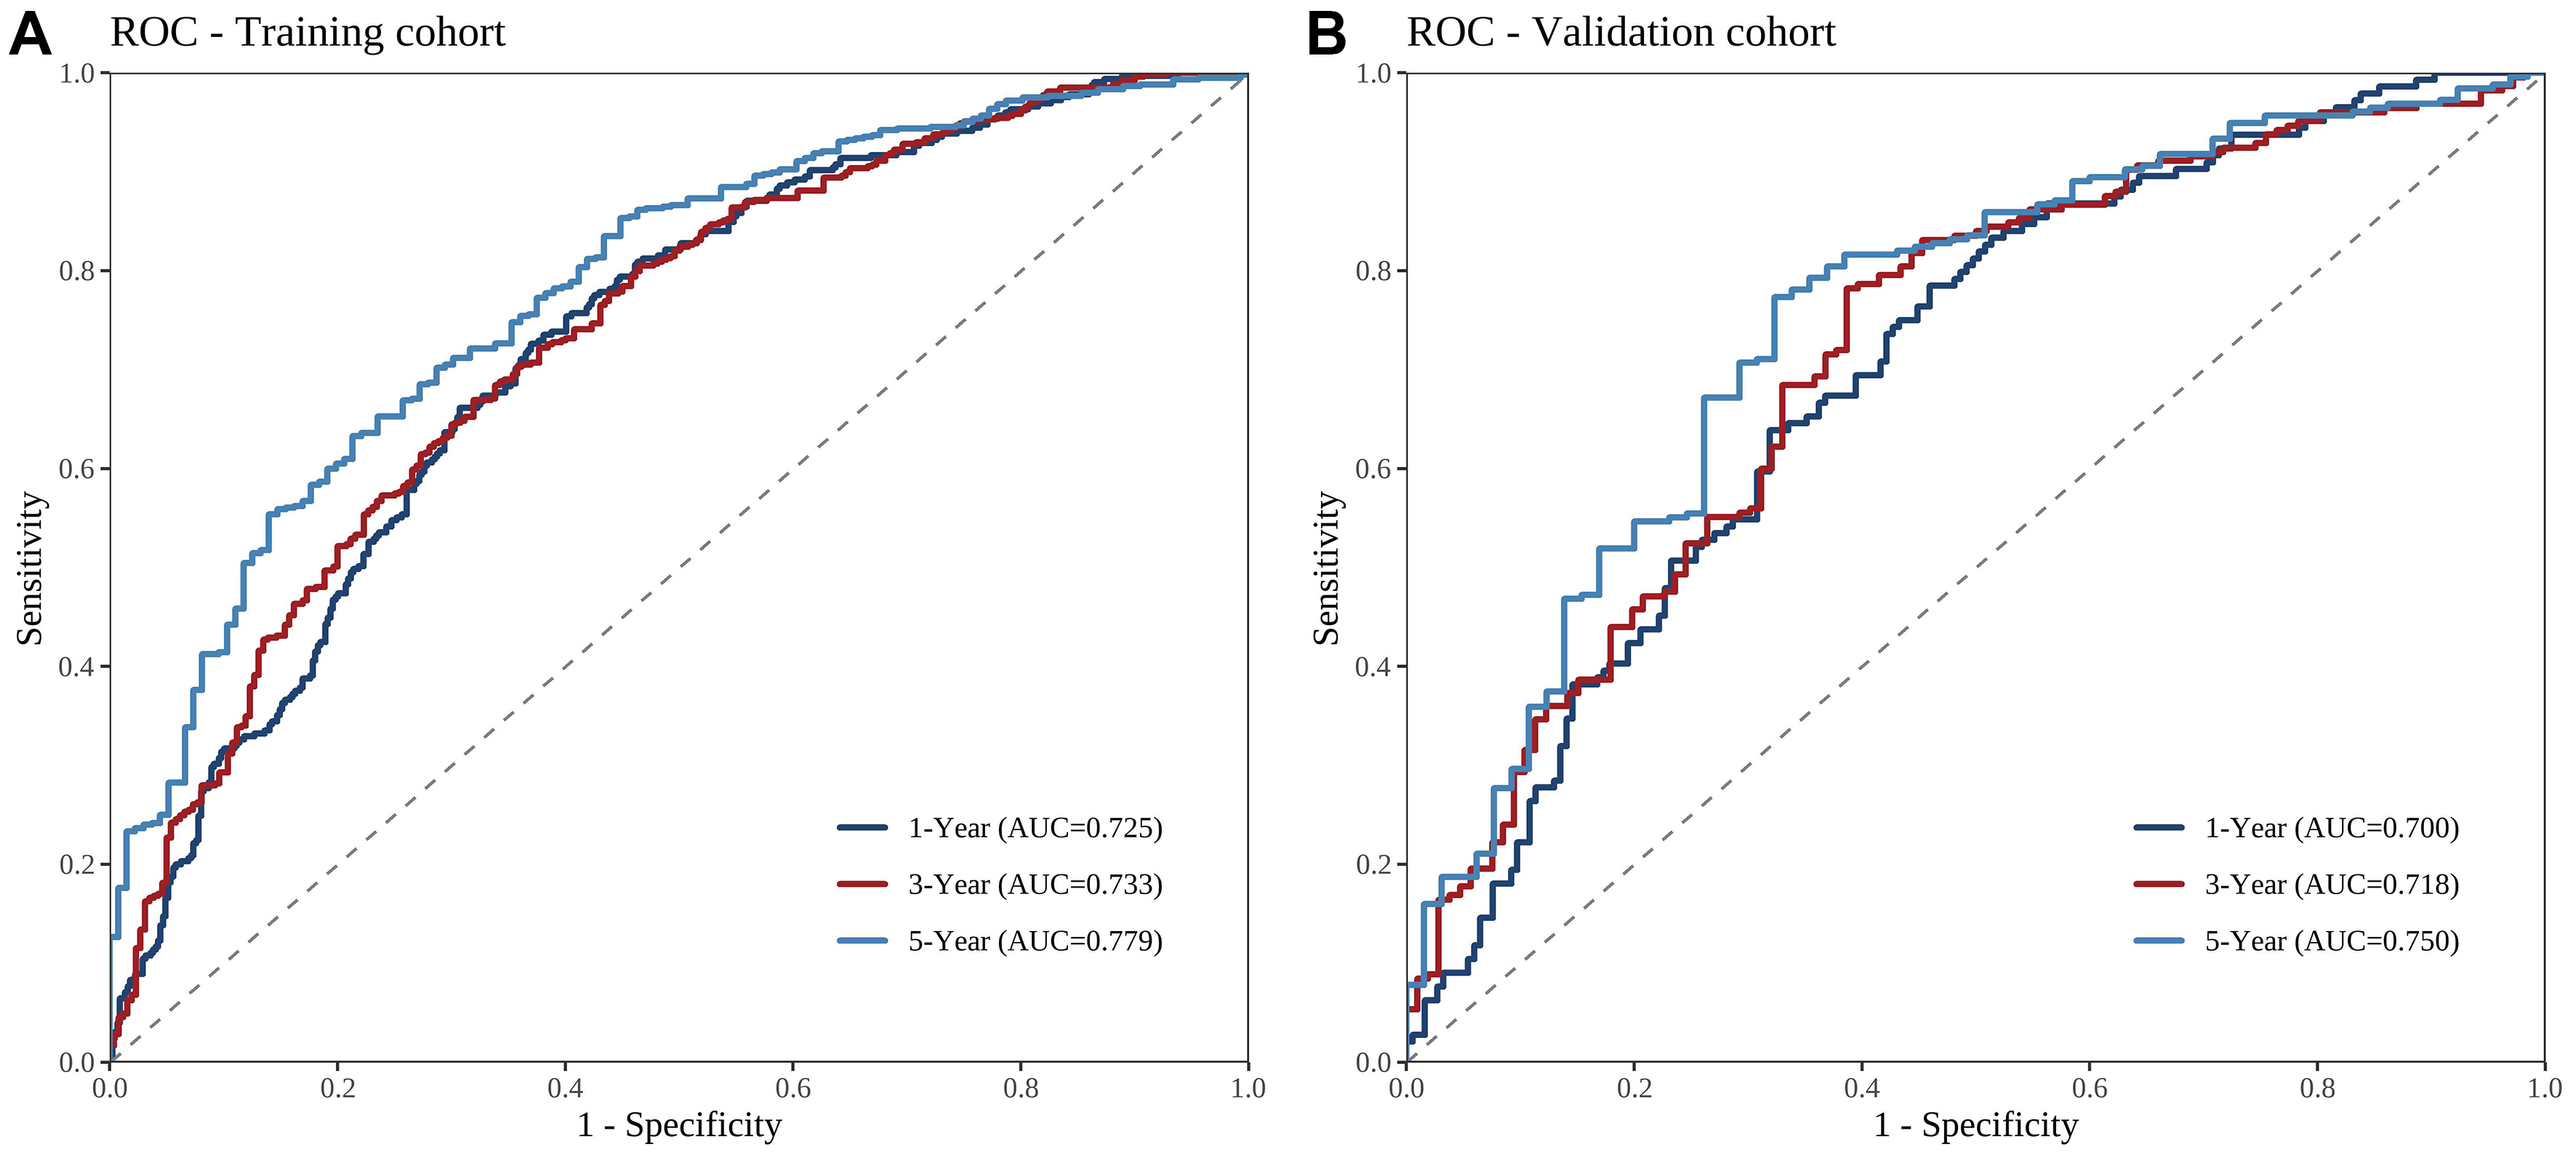
Figure 3. Time-dependent ROC curves of the prognostic model. (A and B) ROC curves were used to evaluate the sensitivity and specificity of the model for predicting 1-, 3-, and 5-year OS: (A) training cohort; (B) validation cohort. AUC values indicate the discriminative performance at each time point. ROC: Receiver operating characteristic; AUC: area under the curve; OS: overall survival.