
fig3
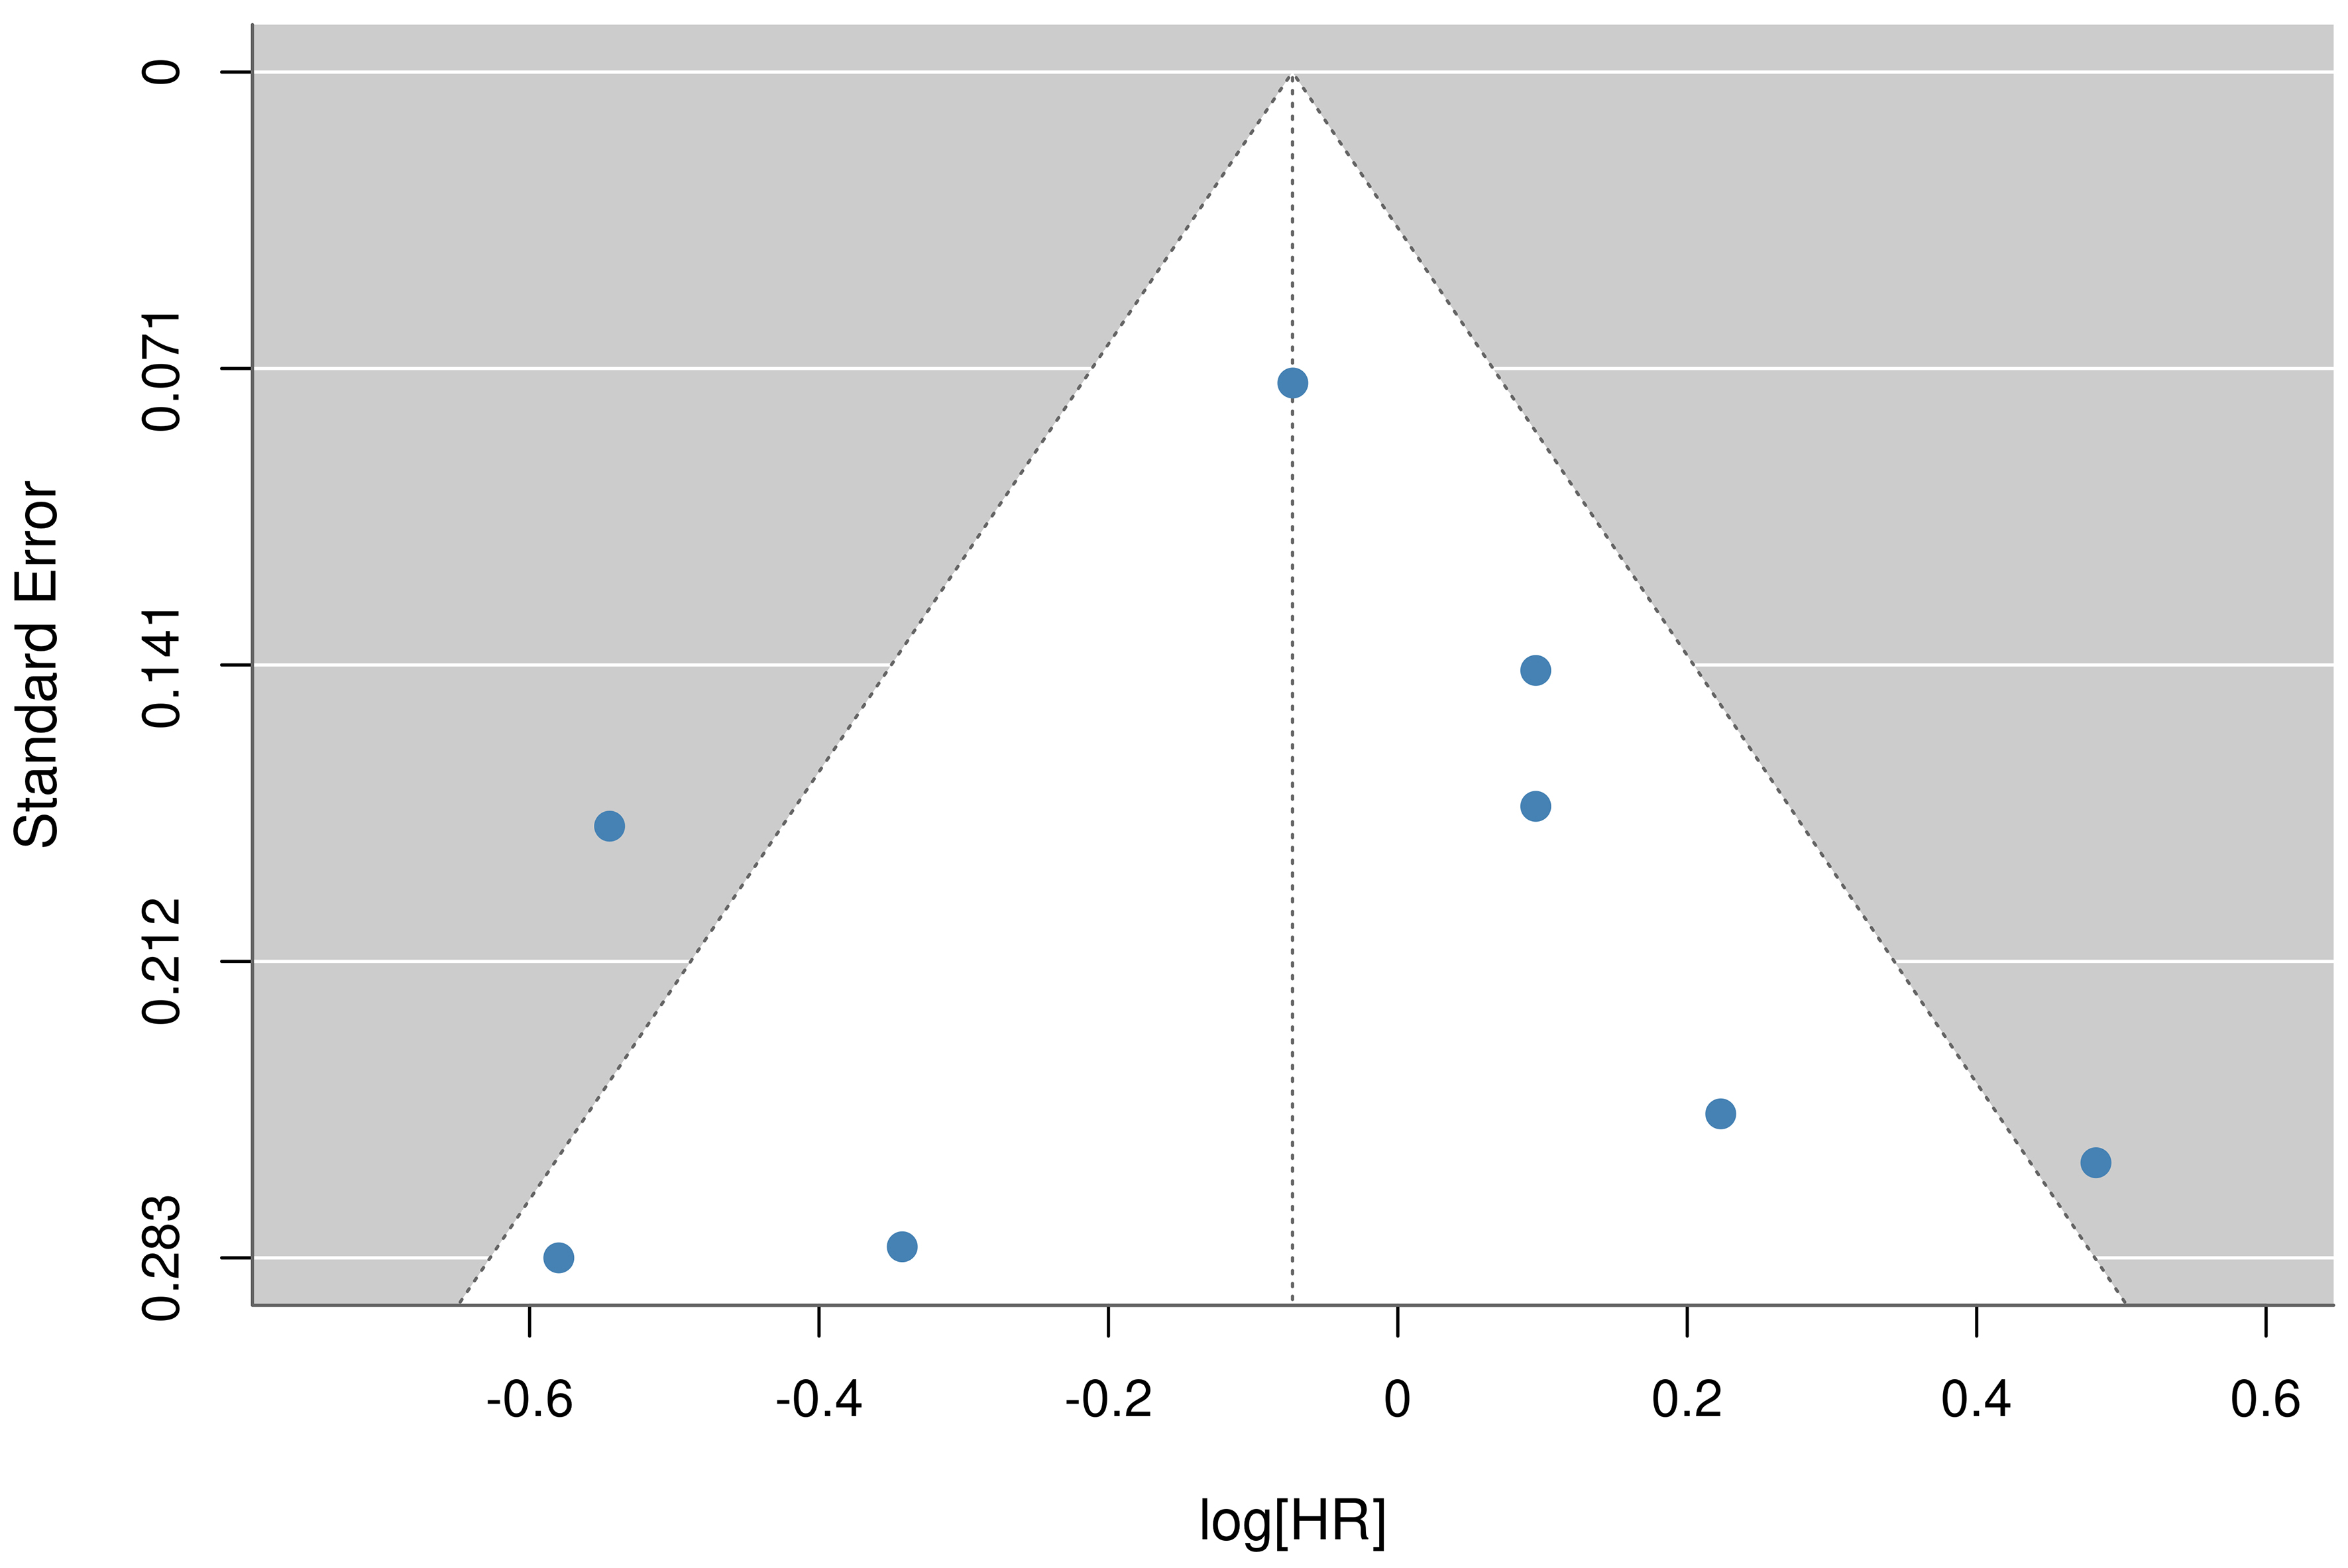
Figure 3. Funnel plot for publication bias of studies on tea consumption and liver cancer risk. The horizontal axis represents the logHR, and the vertical axis represents the SE. The vertical dashed line indicates the pooled effect estimate from the random-effects model. The diagonal dotted lines represent the 95%CI around the pooled effect. Symmetry was assessed using Egger’s test (P = 0.923), suggesting no significant publication bias. No trim-and-fill adjustment was applied. CI: Confidence interval; log[HR]: log hazard ratio; SE: standard error.