


fig6
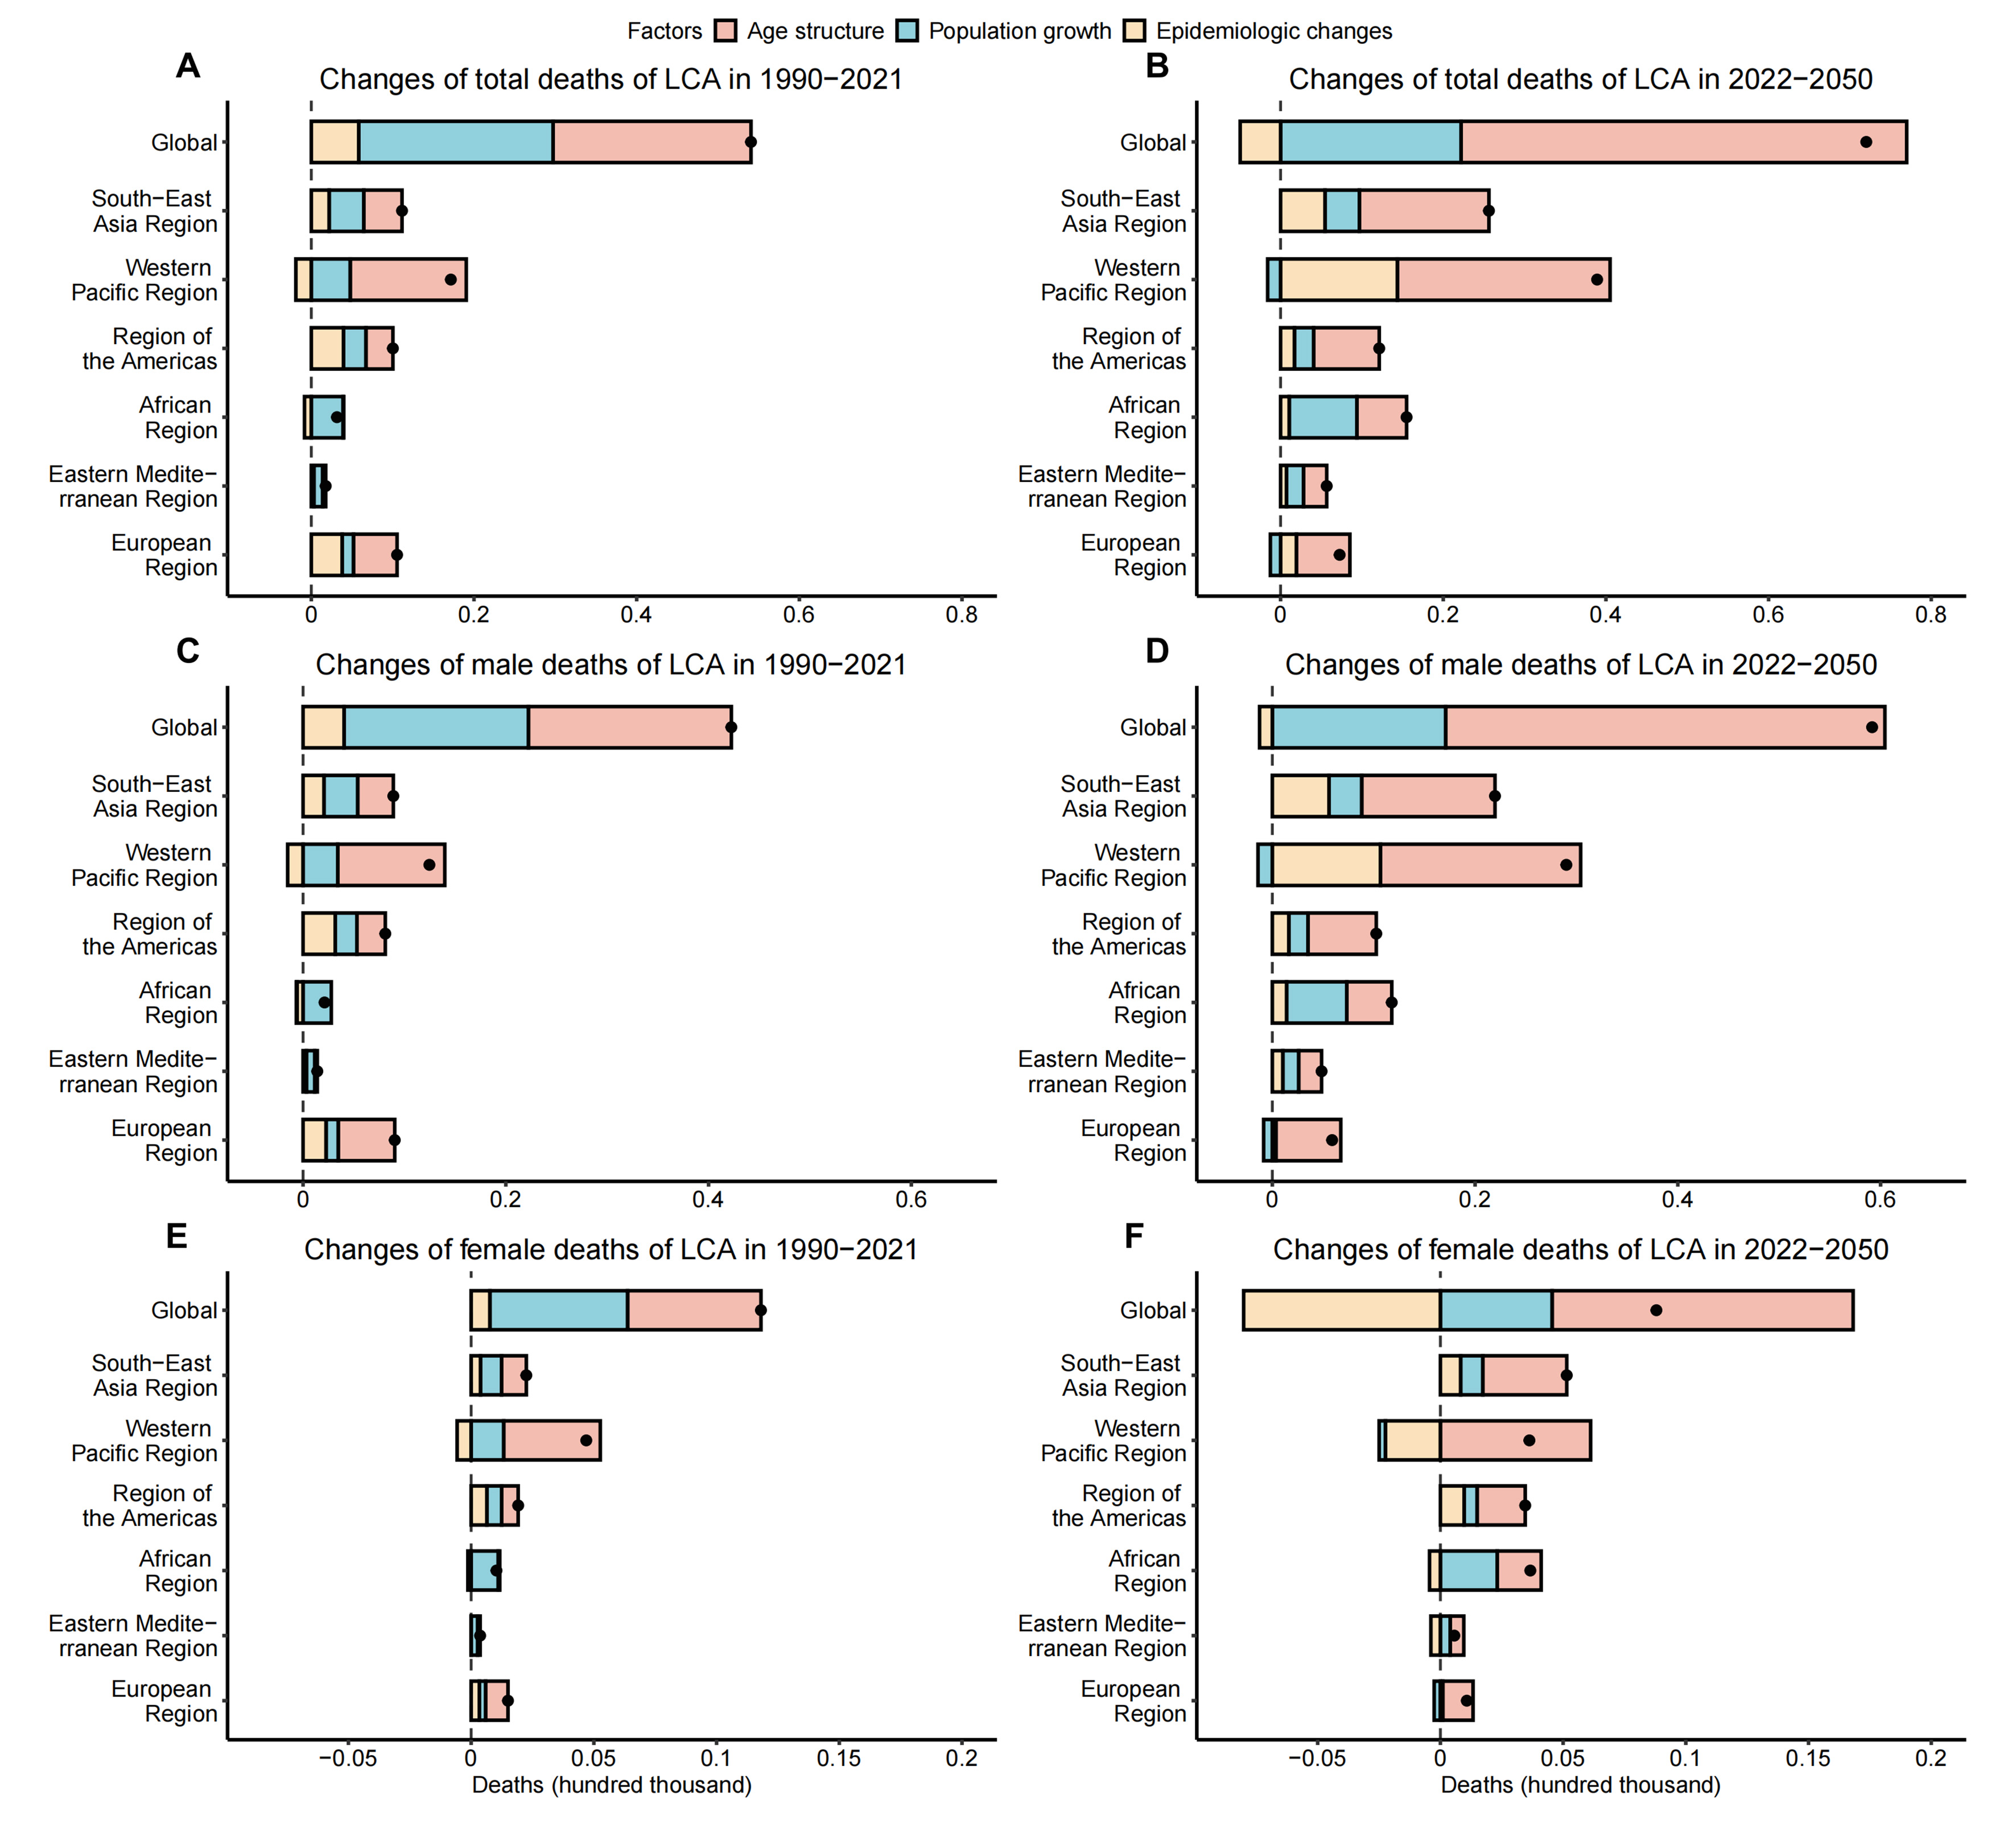
Figure 6. Contributions of population growth, age structure, epidemiological changes to the increase in deaths from LCA, 1990-2021, 2022-2050. (A) Decomposition analysis for both genders, 1990-2021; (B) Decomposition analysis for both genders, 2022-2050; (C) Decomposition analysis for males, 1990-2021; (D) Decomposition analysis for males, 2022-2050; (E) Decomposition analysis for females, 1990-2021; (F) Decomposition analysis for females, 2022-2050. Black dots represent the net change of deaths during each time period. The magnitude of a positive value indicates a corresponding increase in deaths attributed to the factor, and the magnitude of a negative value indicates a corresponding decrease in deaths attributed to the related factor. LCA: Liver cancer due to alcohol use.


