


fig5
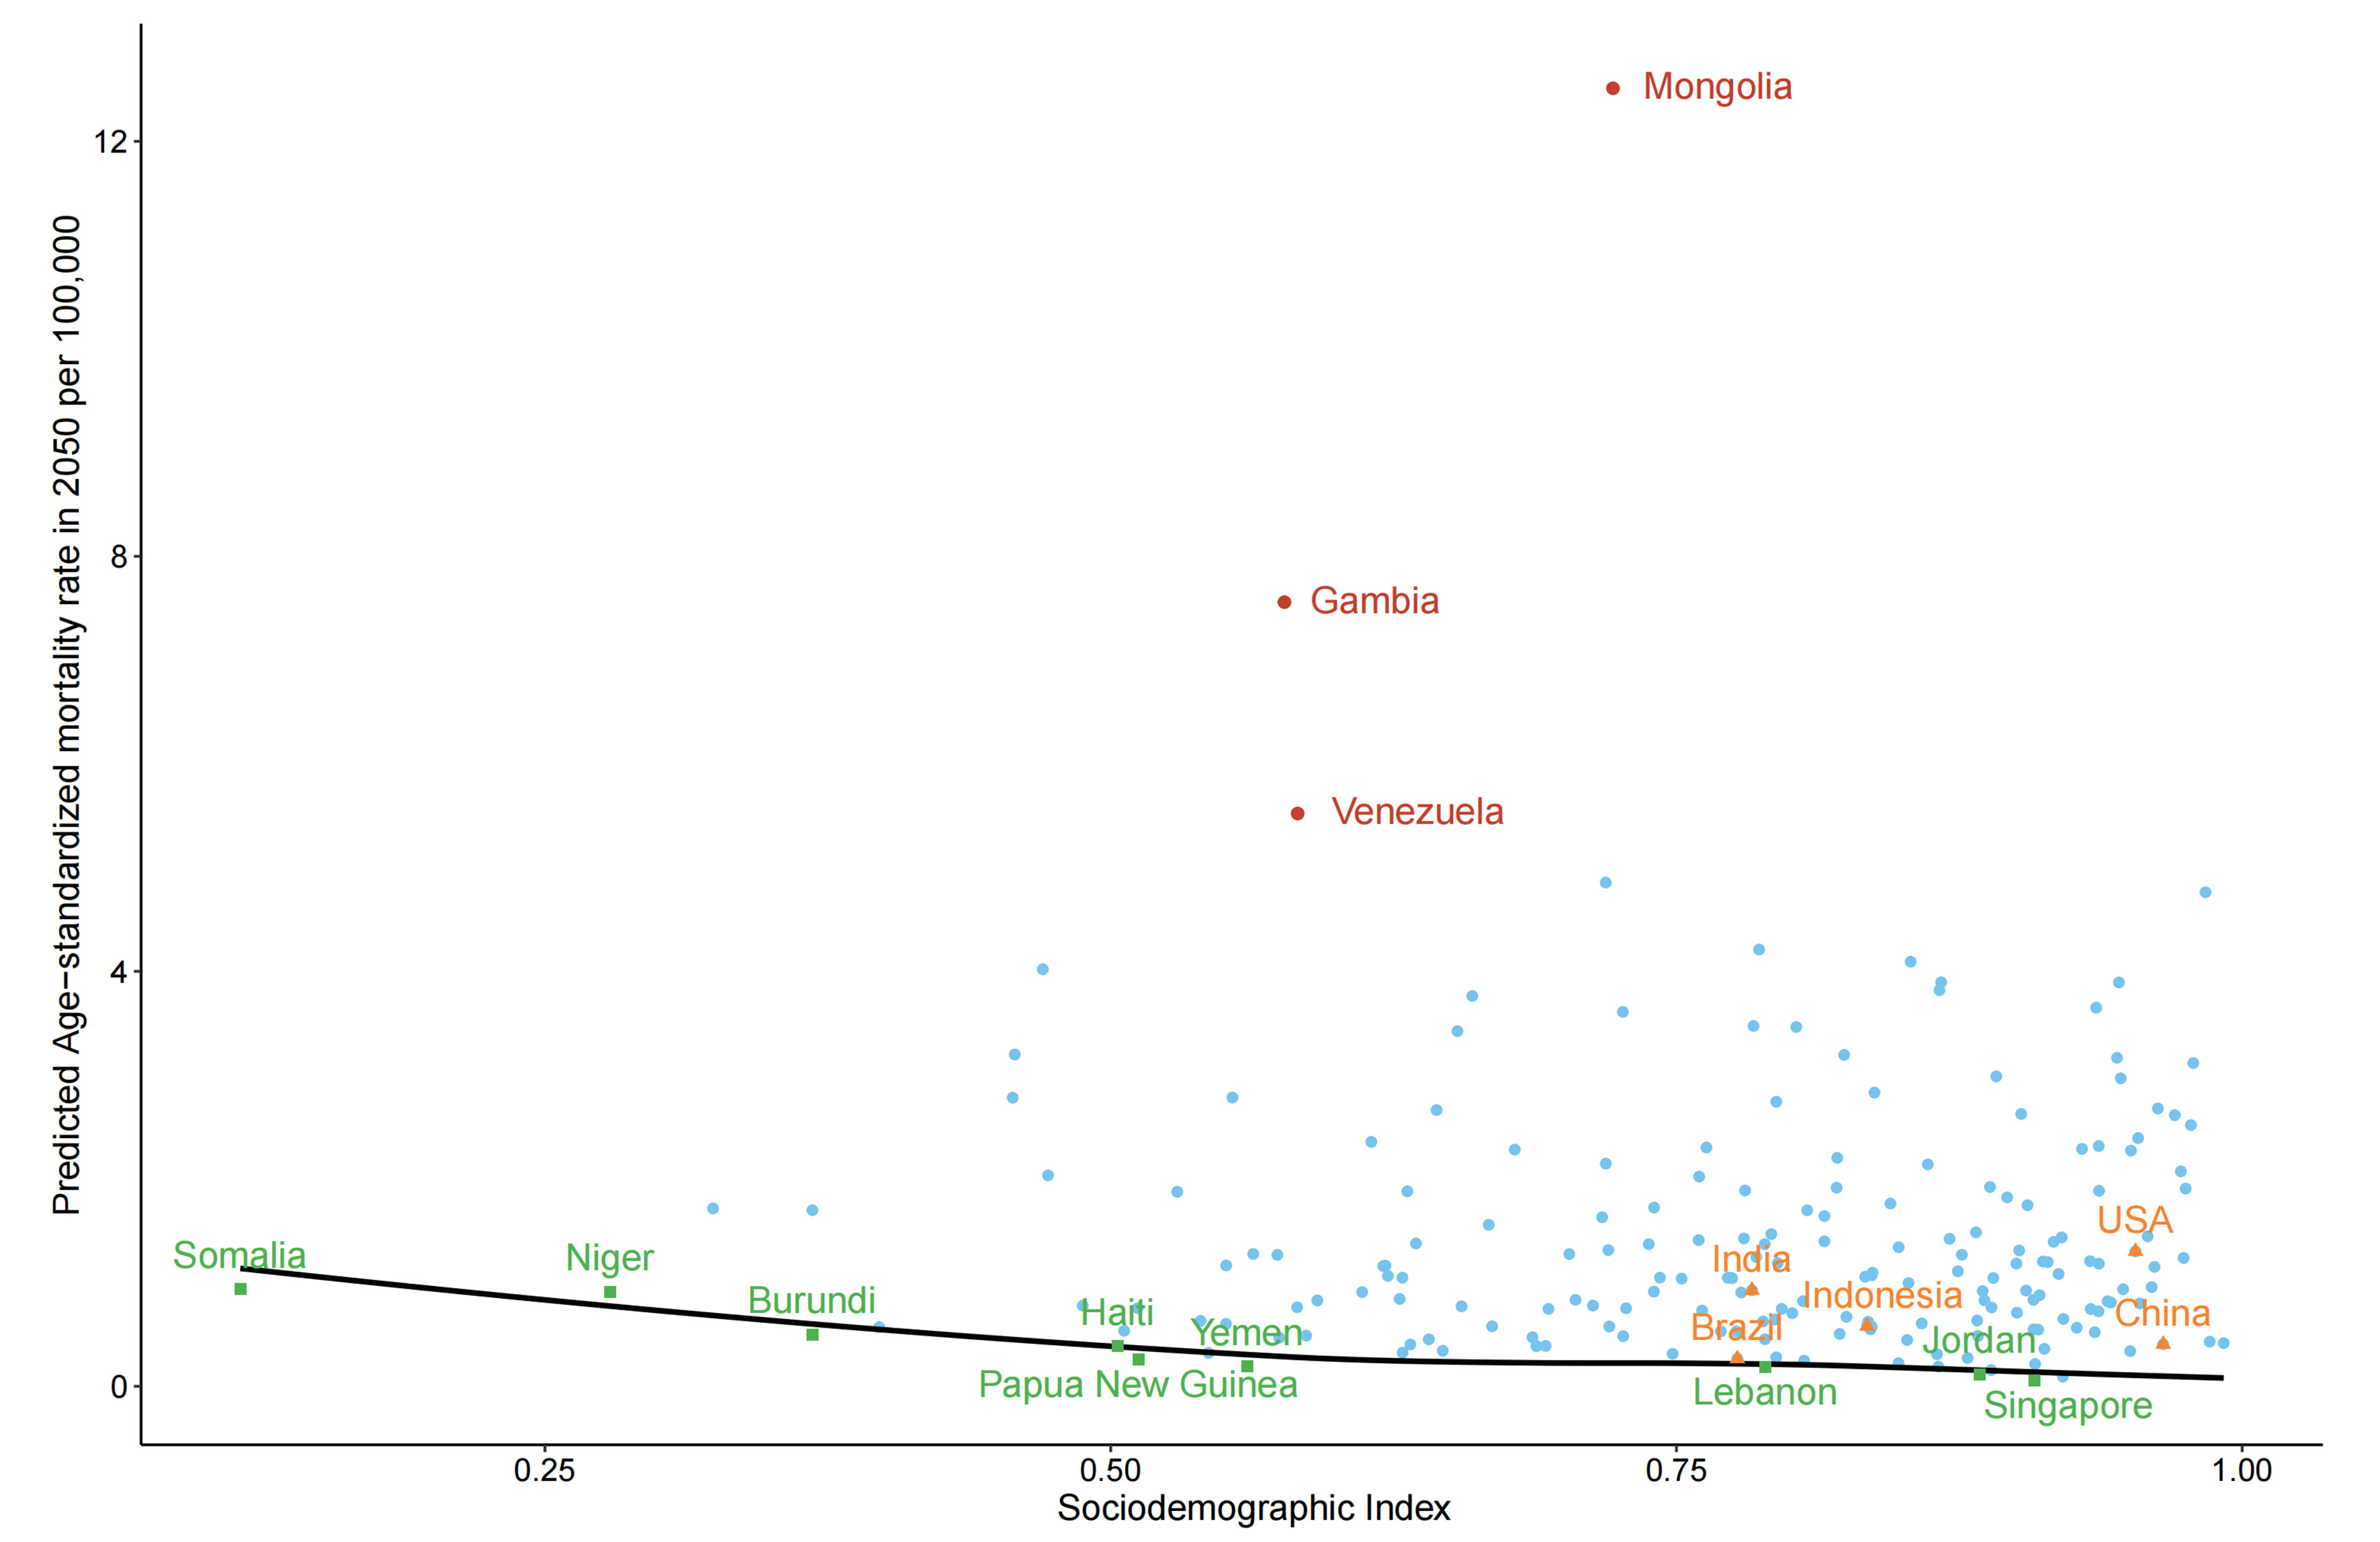
Figure 5. Frontier analysis results based on the sociodemographic index and predicted ASMR for LCA in 2050. The black line represents the frontier (i.e., the optimal ASMR achievable at each SDI level). Green dots represent countries and territories with the lowest predicted ASMR. Red dots highlight the top ten countries with the greatest effective differences from the frontier. Orange dots represent the top five countries by population including China, India, the United States, Indonesia, and Brazil. Light blue dots represent all other countries and territories. The smaller the vertical distance between the point and the curve, the smaller the gap between the predicted ASMR value of the corresponding country and the lowest achievable ASMR value, that is, the more efficient the use of national resources for disease prevention and control. ASMR: Age-standardized mortality rate; LCA: liver cancer due to alcohol use; SDI: sociodemographic index.


