


fig7
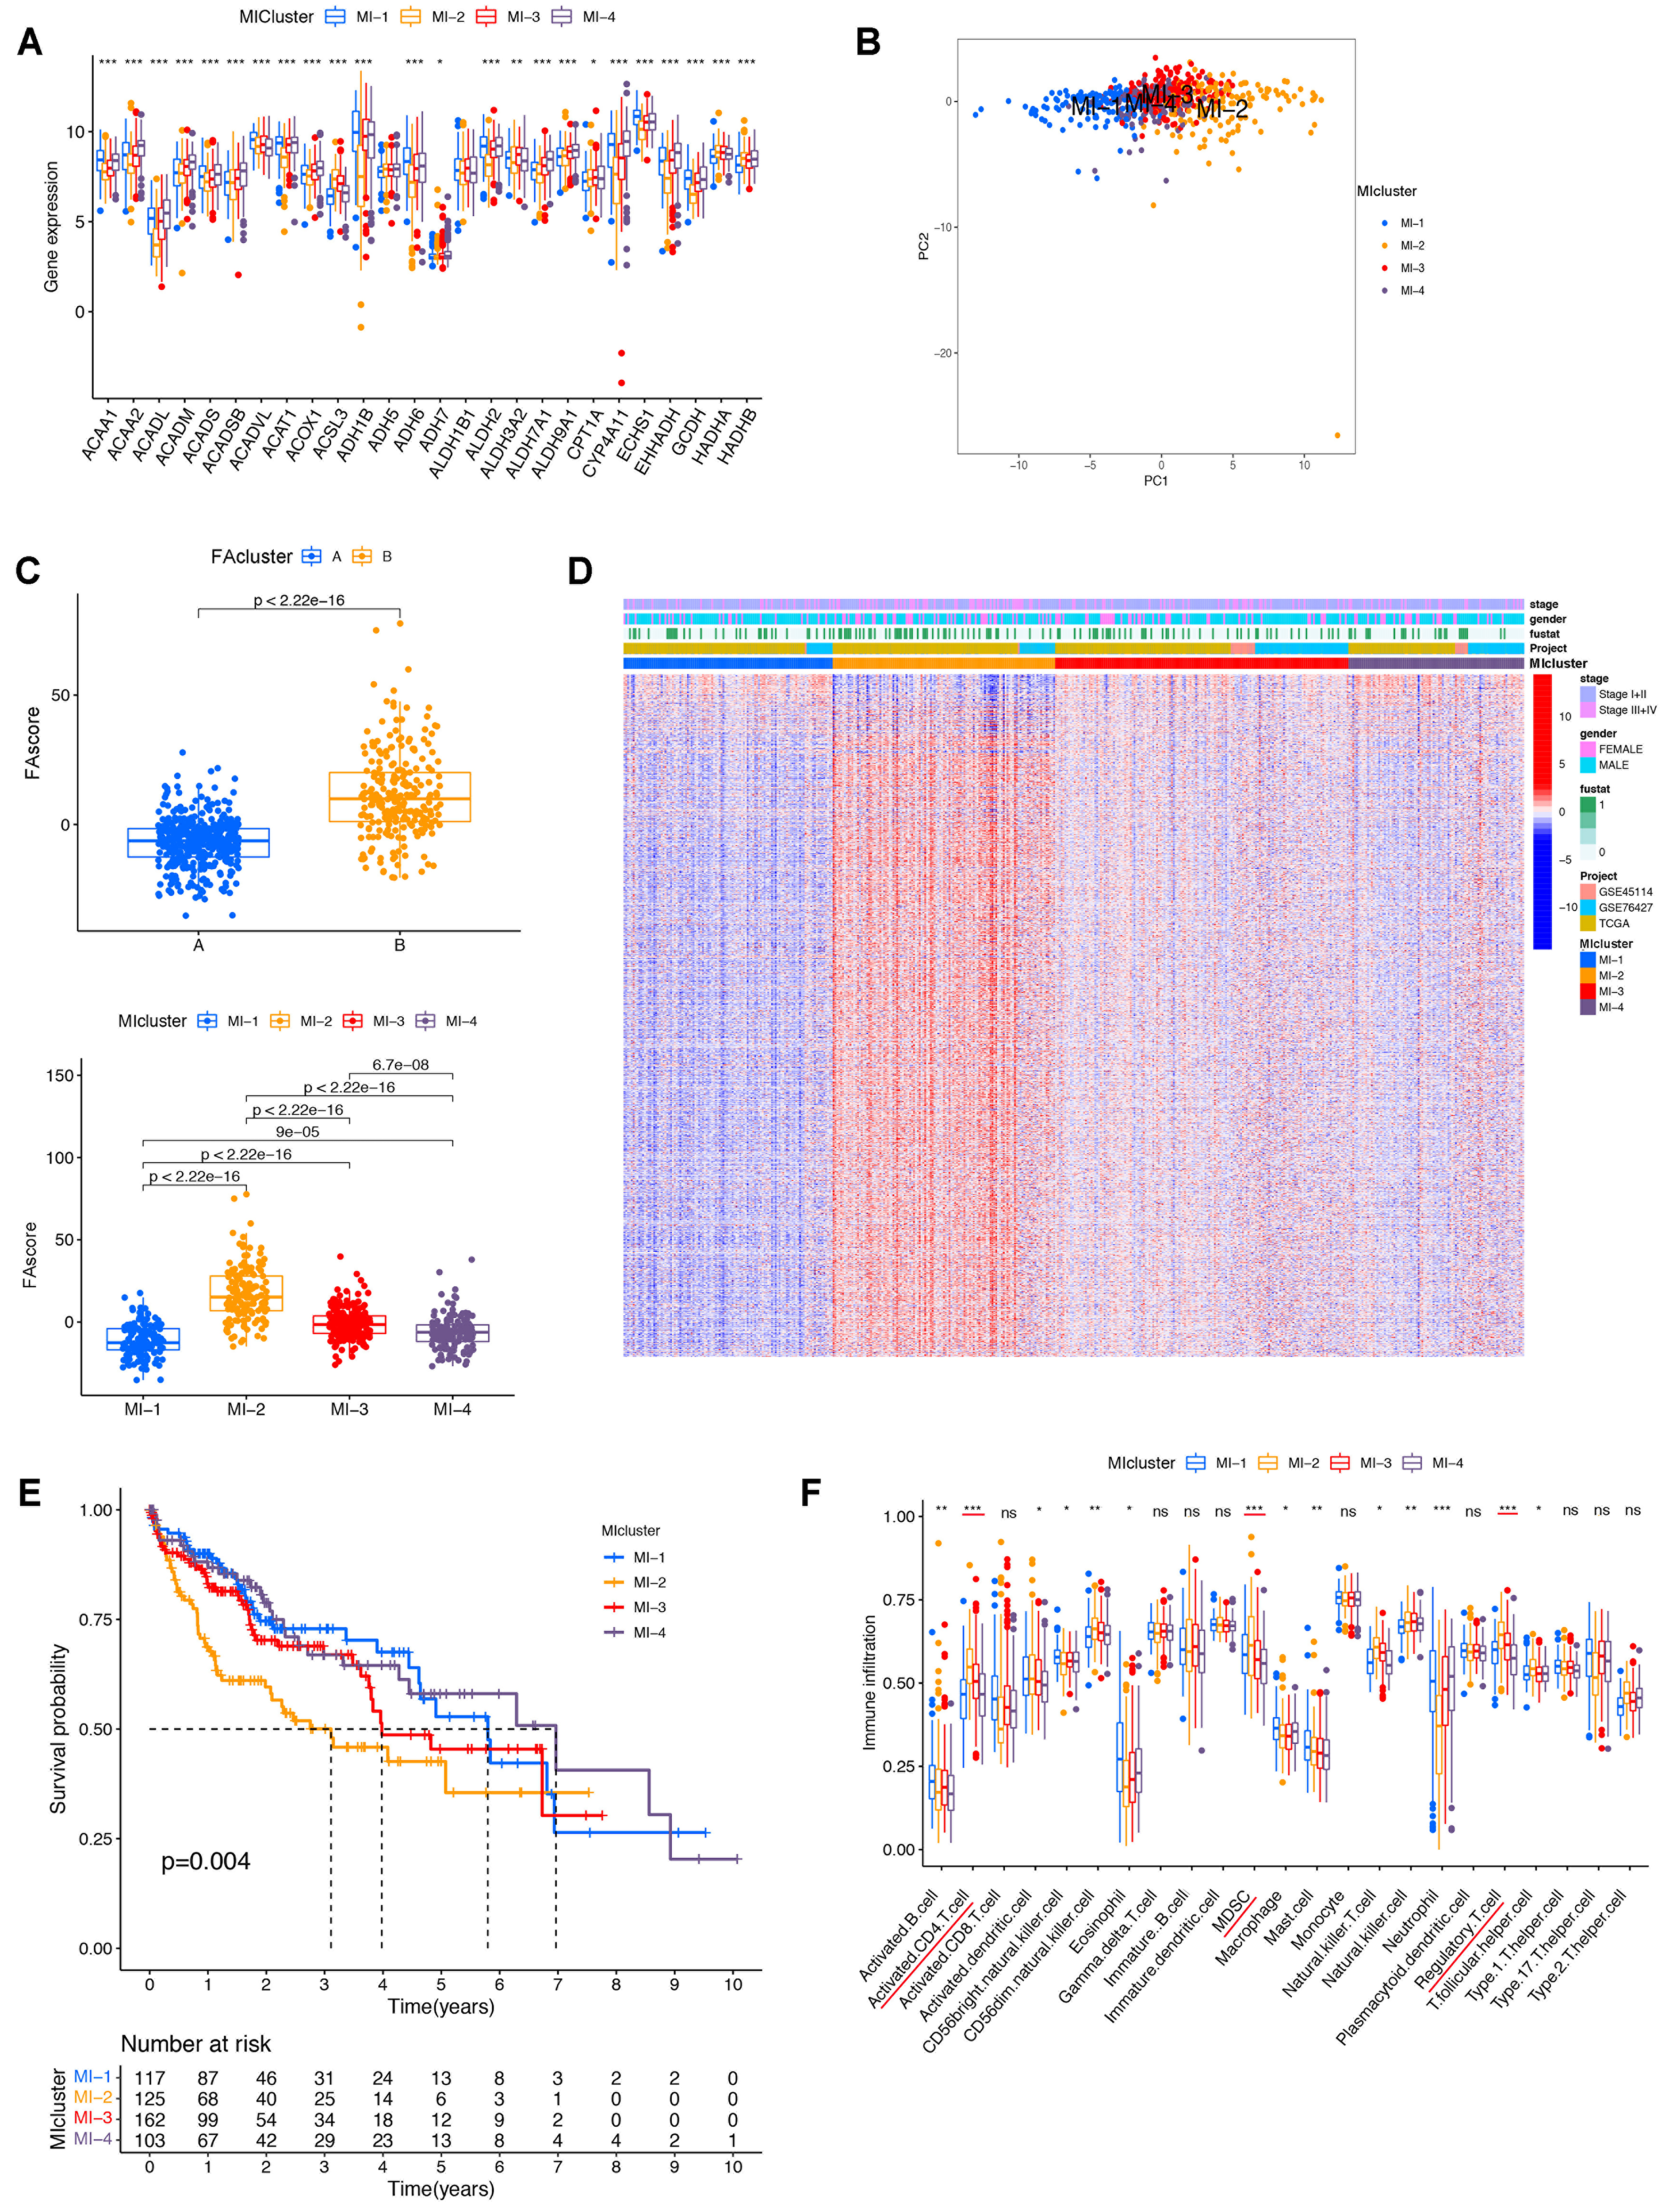
Figure 7. Complex clustering based on FA_score and immune risk score. (A) Expression of 42 FA metabolism regulators across different MI clusters; (B) PCA analysis showing separate distribution of HCC patients in MI clusters 1-4; (C) FA_score comparison: cluster B higher than cluster A (upper panel); MI cluster-2 higher than the other three MI clusters (lower panel); (D) Heatmap showing enrichment of FA-associated DEGs in MI cluster-2; (E) Kaplan-Meier analysis indicating MI cluster-2 had the longest overall survival among the four MI clusters; (F) Infiltration levels of activated CD4+ T cells, MDSCs, and Tregs were higher in MI cluster-2 compared with the other clusters. Statistical significance assessed using the Kruskal-Wallis test. *P < 0.05; **P < 0.01; ***P < 0.001. FA: Fatty acid; MI: mixed index; HCC: hepatocellular carcinoma; PCA: principal component analysis; DEGs: differentially expressed genes; CD4+ T cells: cluster of differentiation 4-positive T cells; MDSCs: myeloid-derived suppressor cells; Tregs: regulatory T cells; ns: not significant.


