


fig5
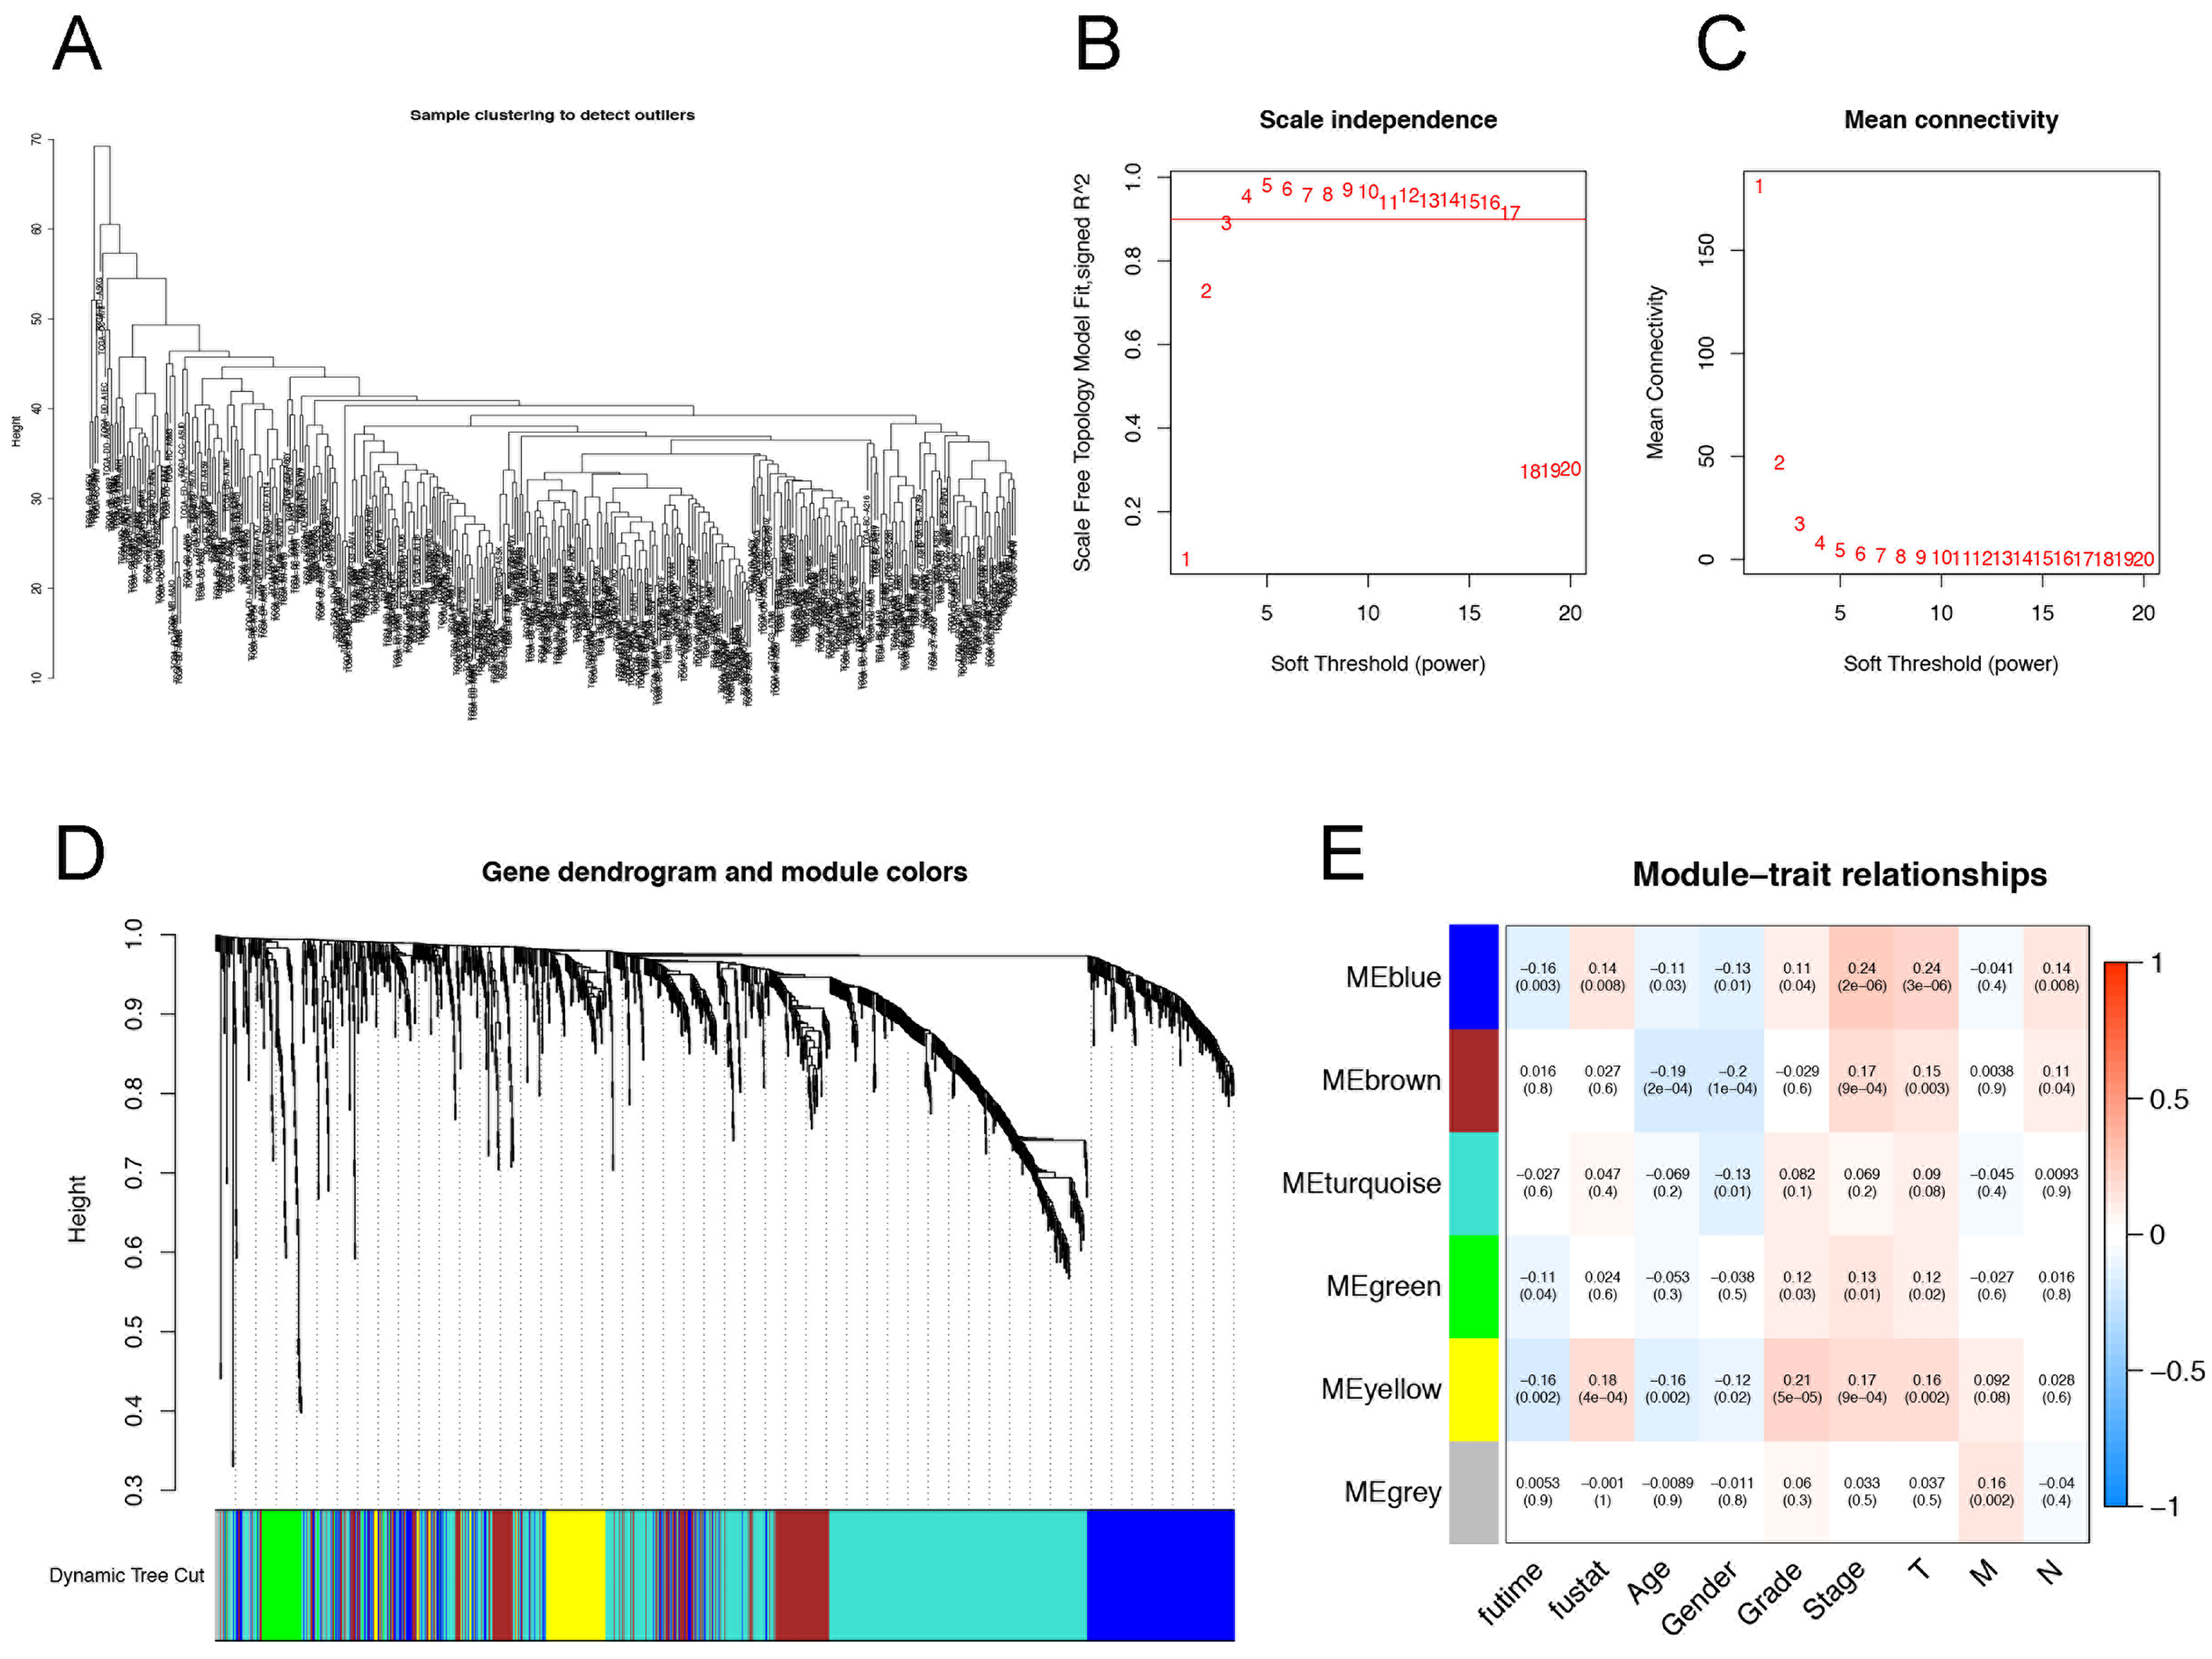
Figure 5. Identification of immune gene co-expression modules in HCC. (A) Sample clustering within the HCC cohort; (B) Scale-free fit index across different soft-thresholding powers (β); (C) Mean connectivity at various soft-thresholding powers; (D) Dendrogram of DEGs based on a dissimilarity measure (1-TOM); (E) Analysis of interactions within each module in HCC samples. HCC: Hepatocellular carcinoma; DEGs: differentially expressed genes; TOM: topological overlap matrix.


