


fig2
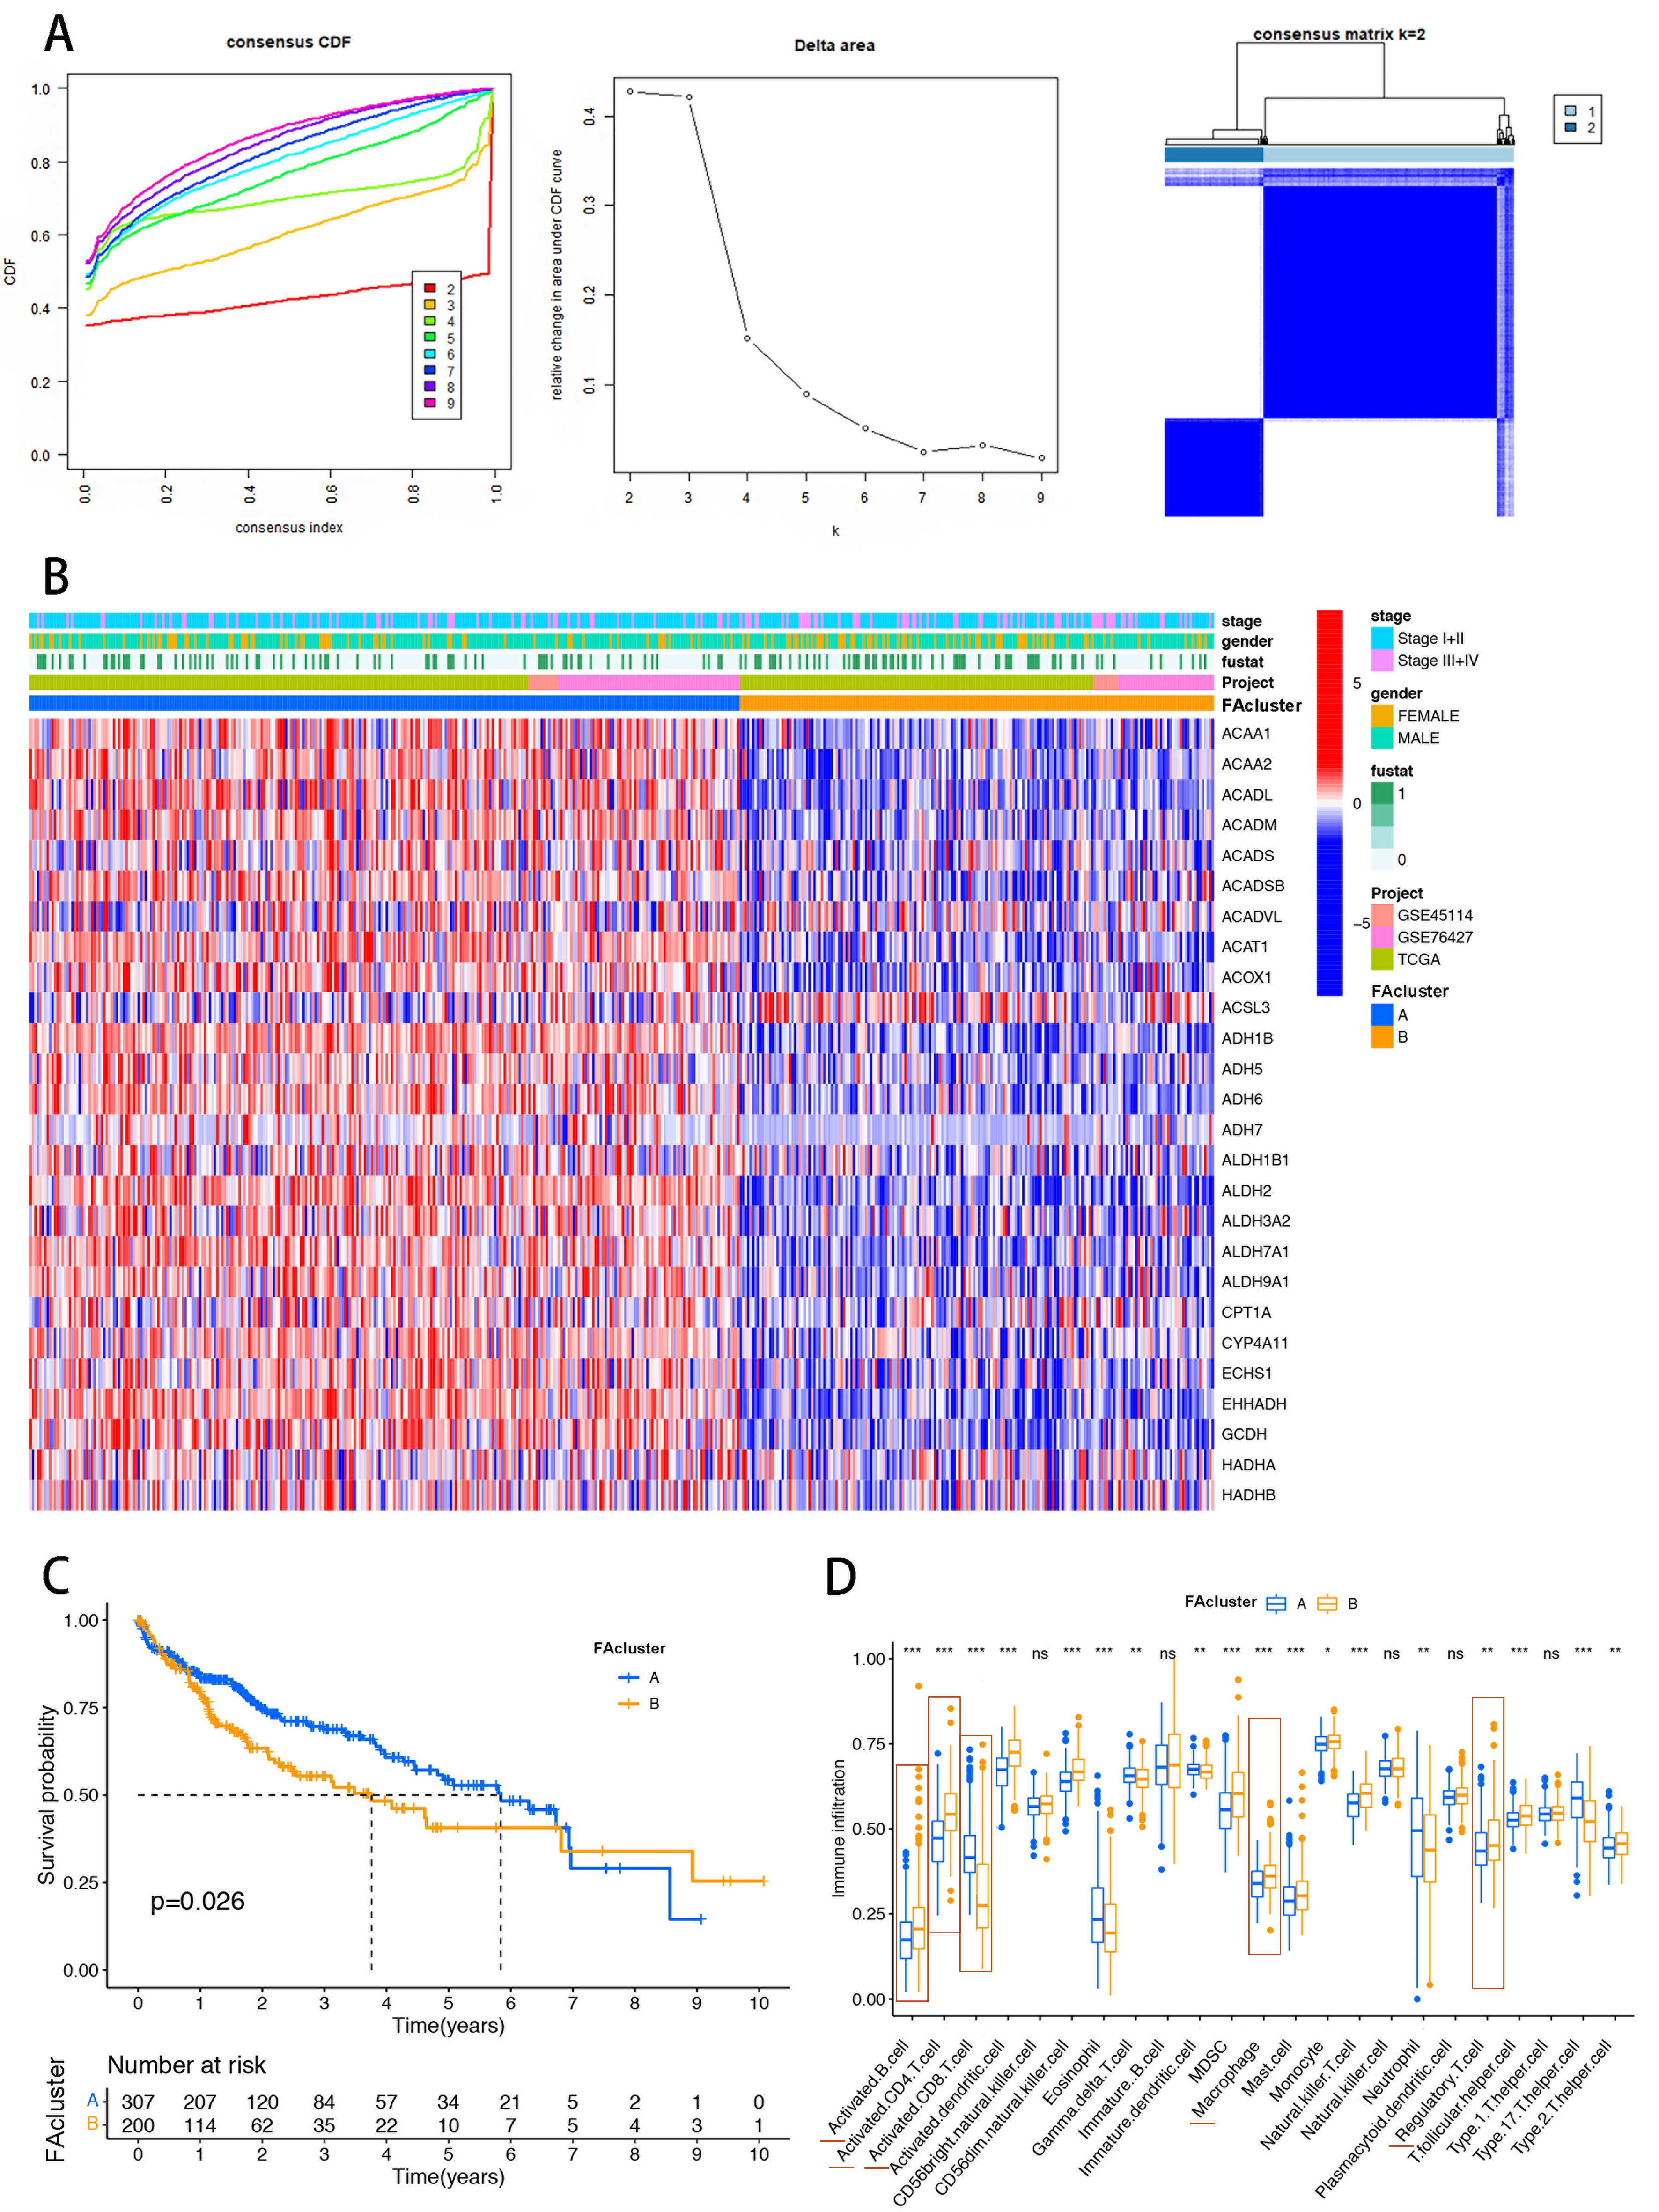
Figure 2. Construction of FA metabolism-related clustering in the HCC cohort. (A) CDF analysis used to select k = 2 for classifying HCC patients; (B) Heatmap showing distinct expression distributions of FA regulatory genes between the two clusters; (C) Kaplan-Meier analysis indicating poorer prognosis in cluster B; (D) CIBERSORT analysis of immune cell infiltration in HCC samples, showing higher recruitment of immunosuppressive cells (CD4+ T cells, MDSCs, Tregs) in cluster B. The red horizontal line marks significantly different immune cells. Statistical significance was assessed using the Wilcoxon rank-sum test. *P < 0.05; **P < 0.01; ***P < 0.001. FA: Fatty acid; HCC: hepatocellular carcinoma; CDF: cumulative distribution function; CIBERSORT: Cell-type Identification By Estimating Relative Subsets Of RNA Transcripts; CD4+ T cells: cluster of differentiation 4-positive T cells; MDSCs: myeloid-derived suppressor cells; Tregs: regulatory T cells; ns: not significant.


