


fig1
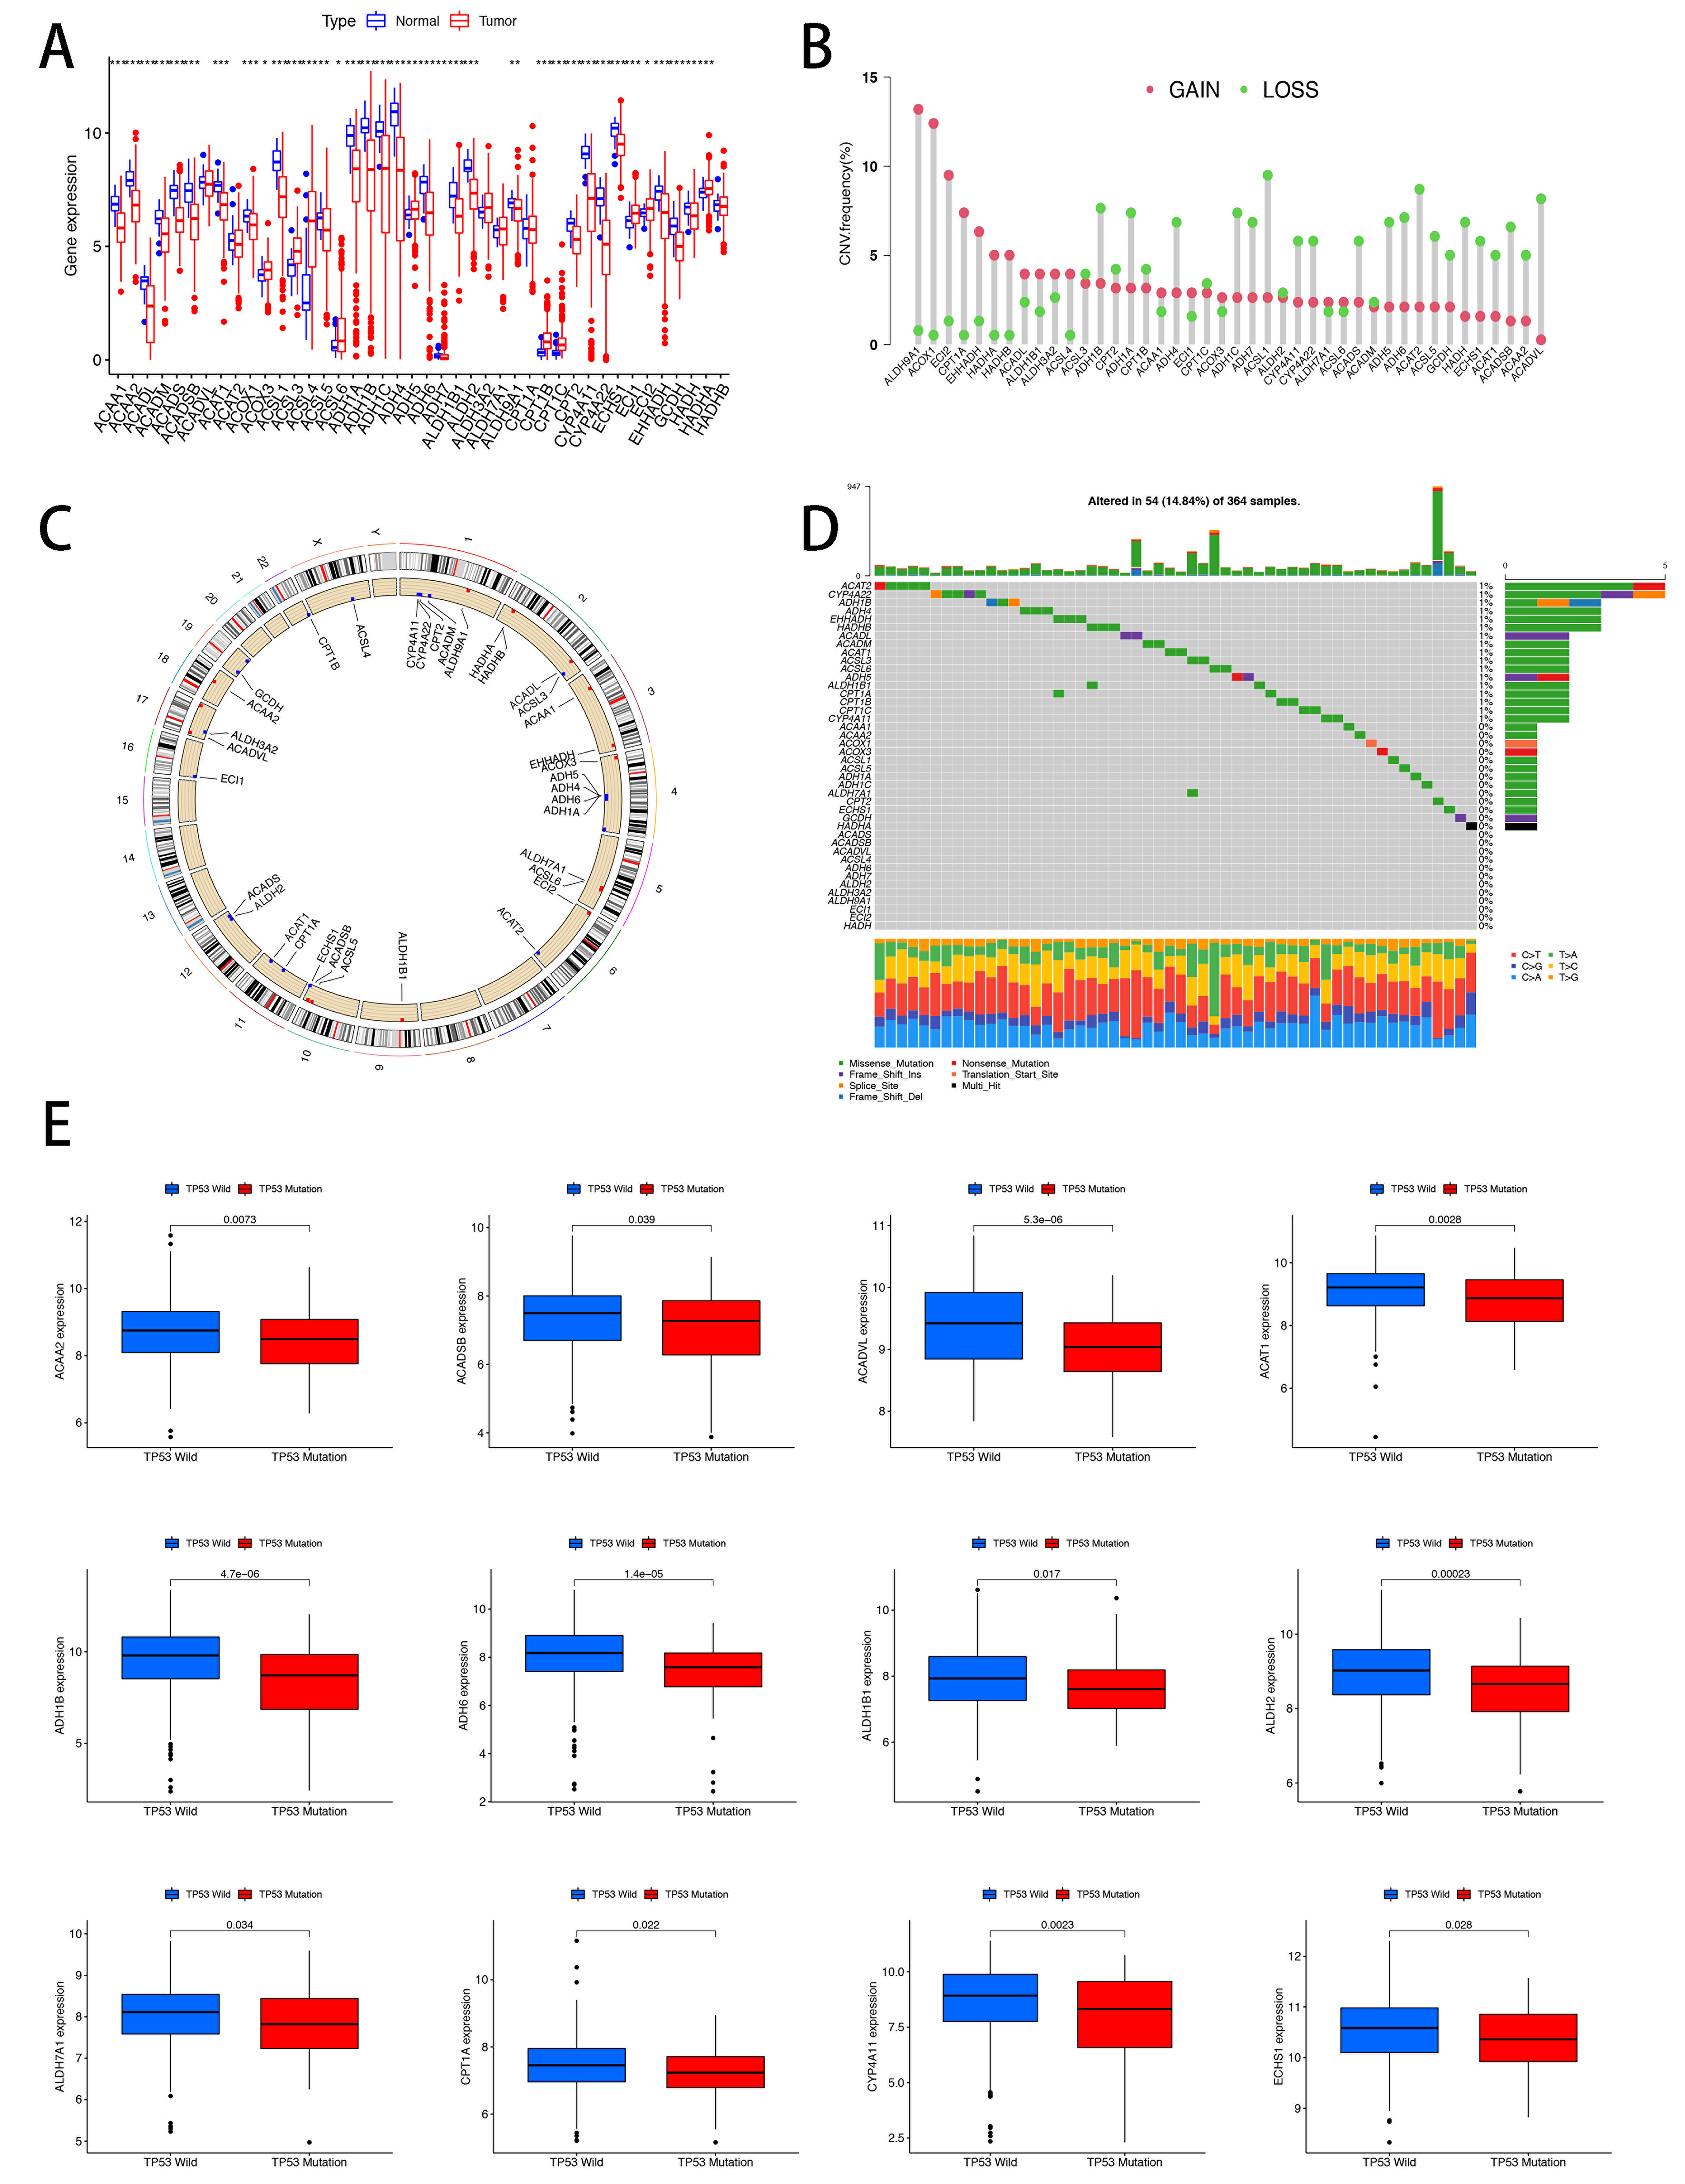
Figure 1. Expression patterns of FA metabolism-associated regulators in HCC. (A) Boxplots showing expression levels of 42 FA metabolism regulators in HCC specimens and noncancerous counterparts. Statistical significance was assessed using the Wilcoxon rank-sum test; (B and C) CNV analysis of HCC samples from TCGA showing gains in ALDH9A1, ACOX1, ECI2, CPT1A, and EHHADH, and frequent losses in ACSL1, ACAT2, and ACADVL; (D) Genomic mutation status of 42 FA metabolism regulators in HCC samples; (E) Expression changes of 12 FA metabolism regulators following TP53 mutation. *P < 0.05; **P < 0.01; ***P < 0.001. FA: Fatty acid; HCC: hepatocellular carcinoma; CNV: copy number variation; TCGA: The Cancer Genome Atlas; TP53: tumor protein p53.


