


fig2
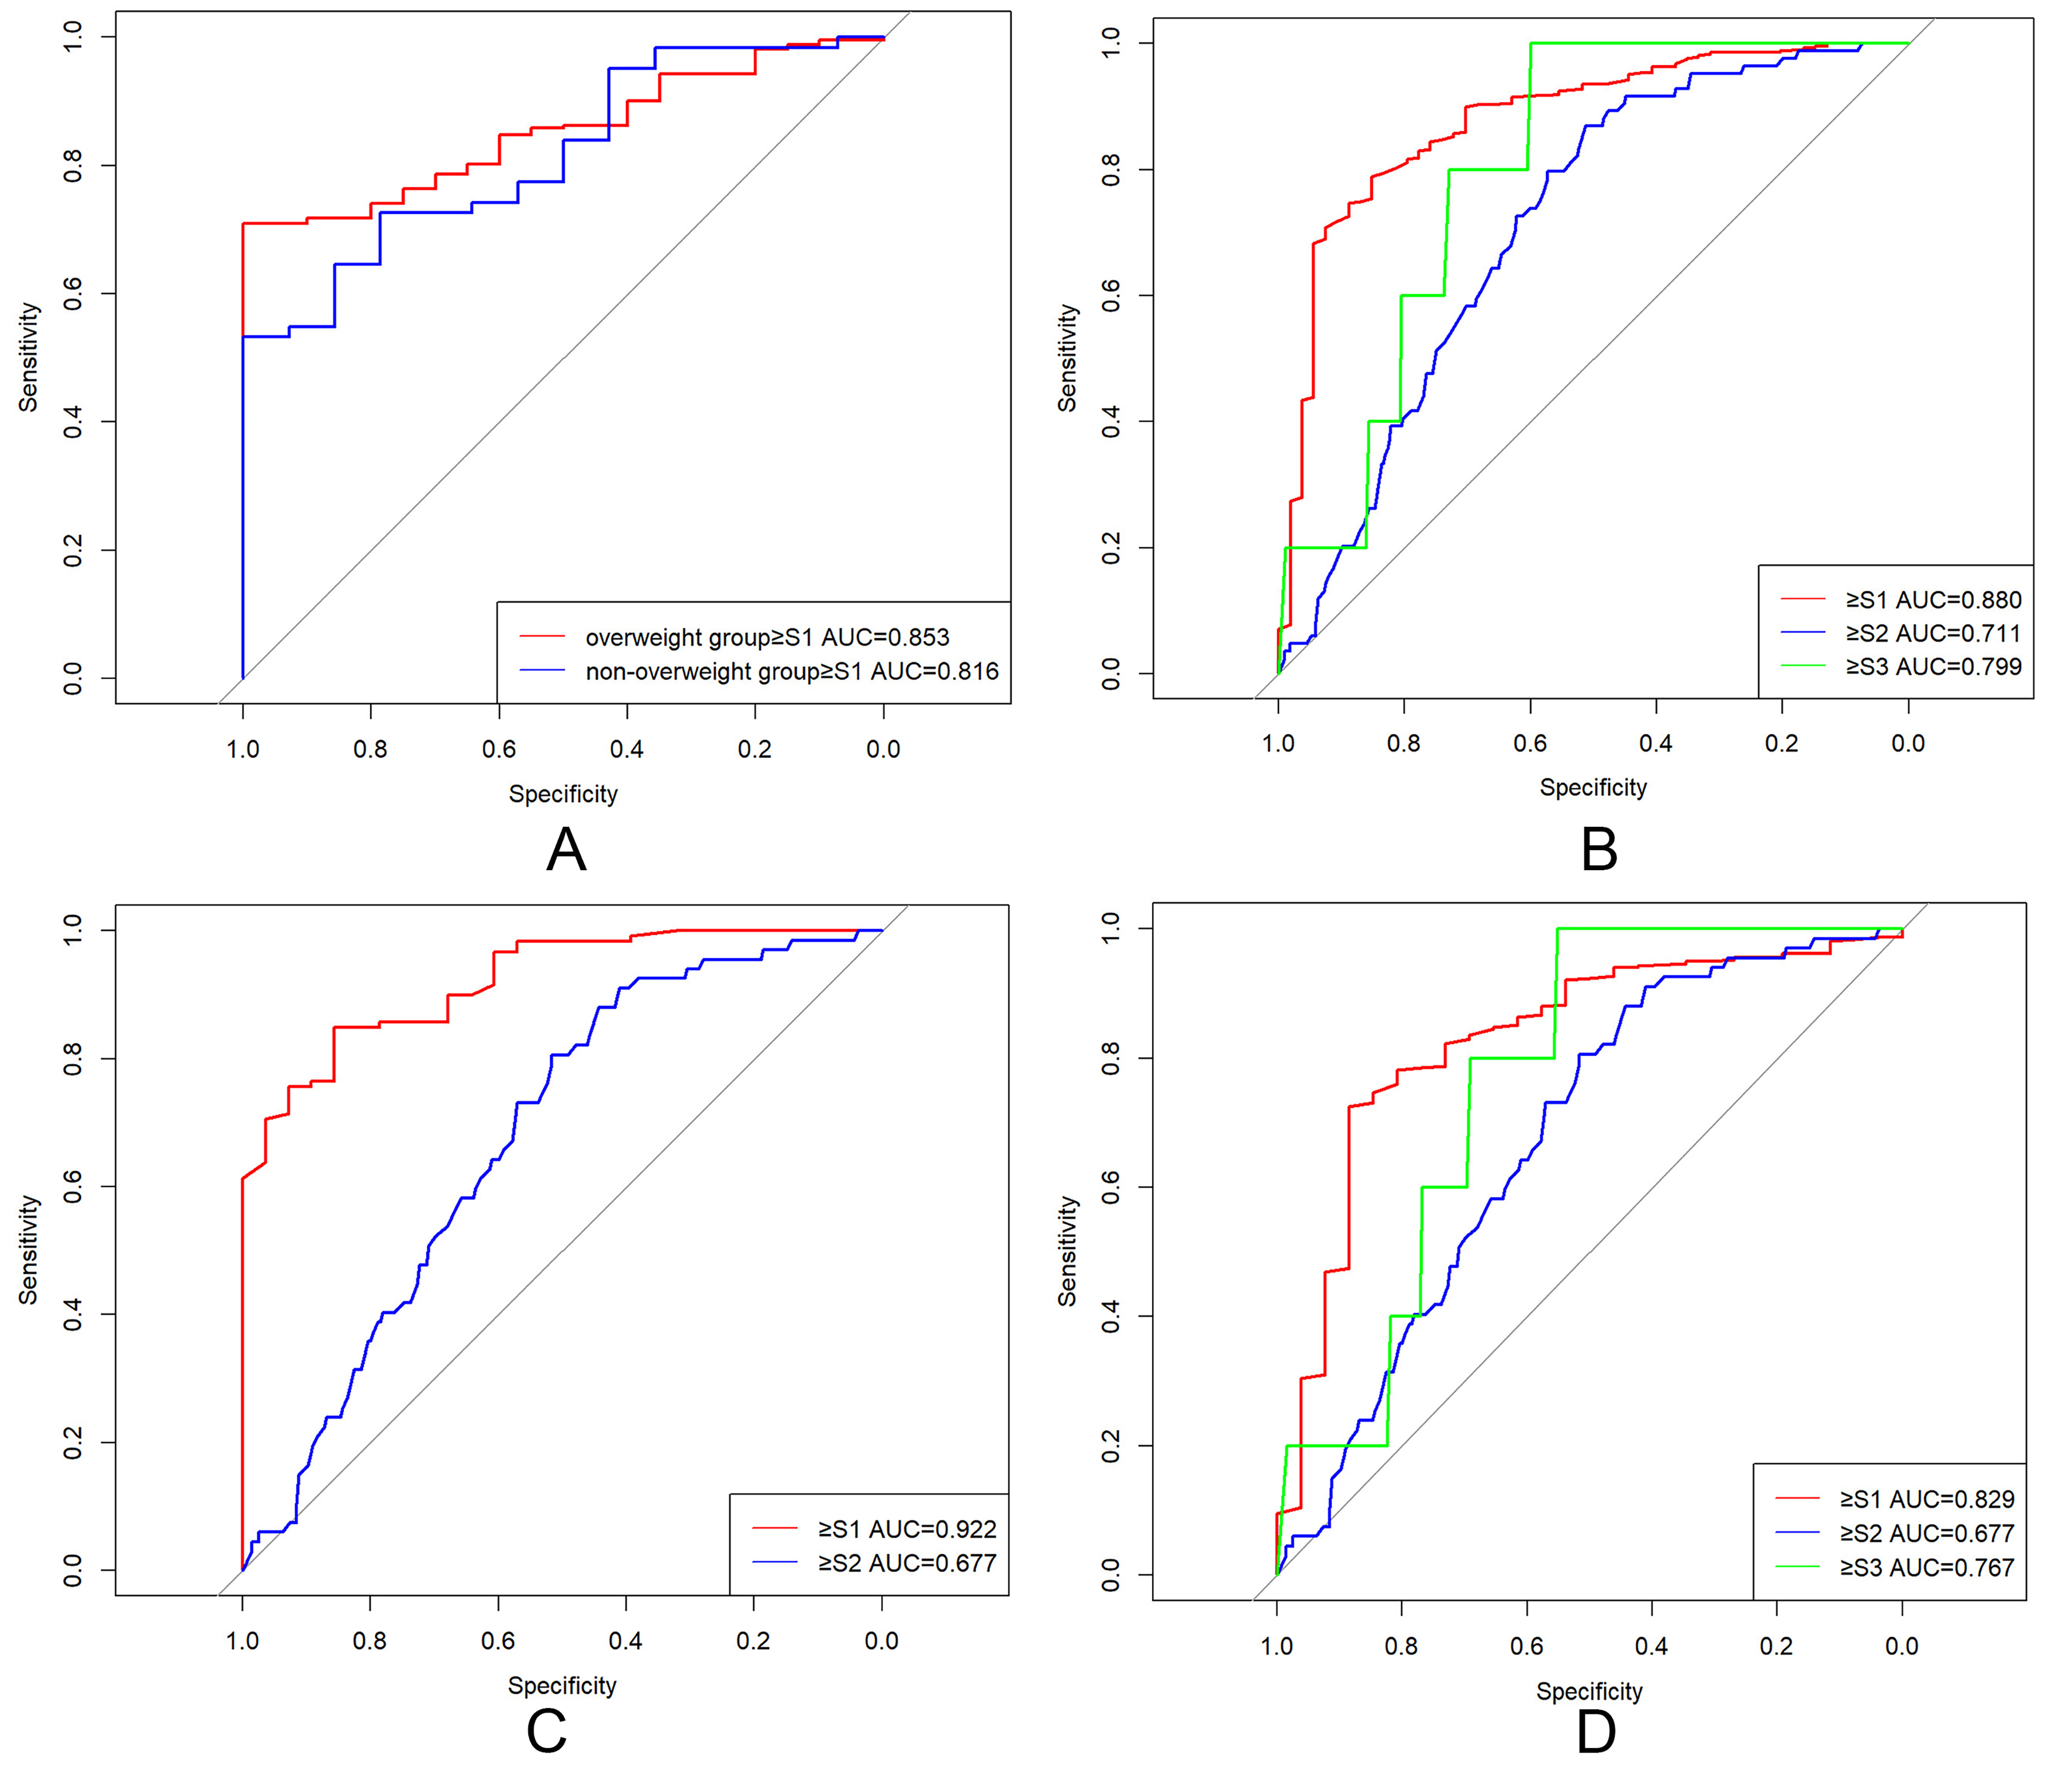
Figure 2. ROC curves for CAP in diagnosing hepatic steatosis grades. (A) Multivariable linear regression models predicting CAP. Normal-weight group AUC = 0.816 (95%CI: 0.713-0.927); overweight group AUC = 0.853 (95%CI: 0.798-0.907); (B) CAP diagnostic performance in the overall cohort. ≥ S1: cut-off = 283.5 dB/m, AUC = 0.880 (95%CI: 0.831-0.910); ≥ S2: cut-off = 311.5 dB/m, AUC = 0.712 (95%CI: 0.659-0.764); ≥ S3: cut-off = 328.5 dB/m, AUC = 0.799 (95%CI: 0.628-0.917); (C) CAP performance in the normal-weight group. ≥ S1: cut-off = 259.5 dB/m, AUC = 0.922 (95%CI: 0.875-0.968); ≥ S2: cut-off = 323.5 dB/m, AUC = 0.779 (95%CI: 0.628-0.876); (D) CAP performance in the overweight group. ≥ S1: cut-off = 283.5 dB/m, AUC = 0.829 (95%CI: 0.744-0.915); ≥ S2: cut-off = 311.5 dB/m, AUC = 0.677 (95%CI: 0.613-0.740); ≥ S3: cut-off = 328.5 dB/m, AUC = 0.767 (95%CI: 0.635-0.898). ROC: Receiver operating characteristic; CAP: controlled attenuation parameter; AUC: area under the curve; CI: confidence interval; S1: mild hepatic steatosis; S2: moderate hepatic steatosis; S3: severe hepatic steatosis.


