


fig1
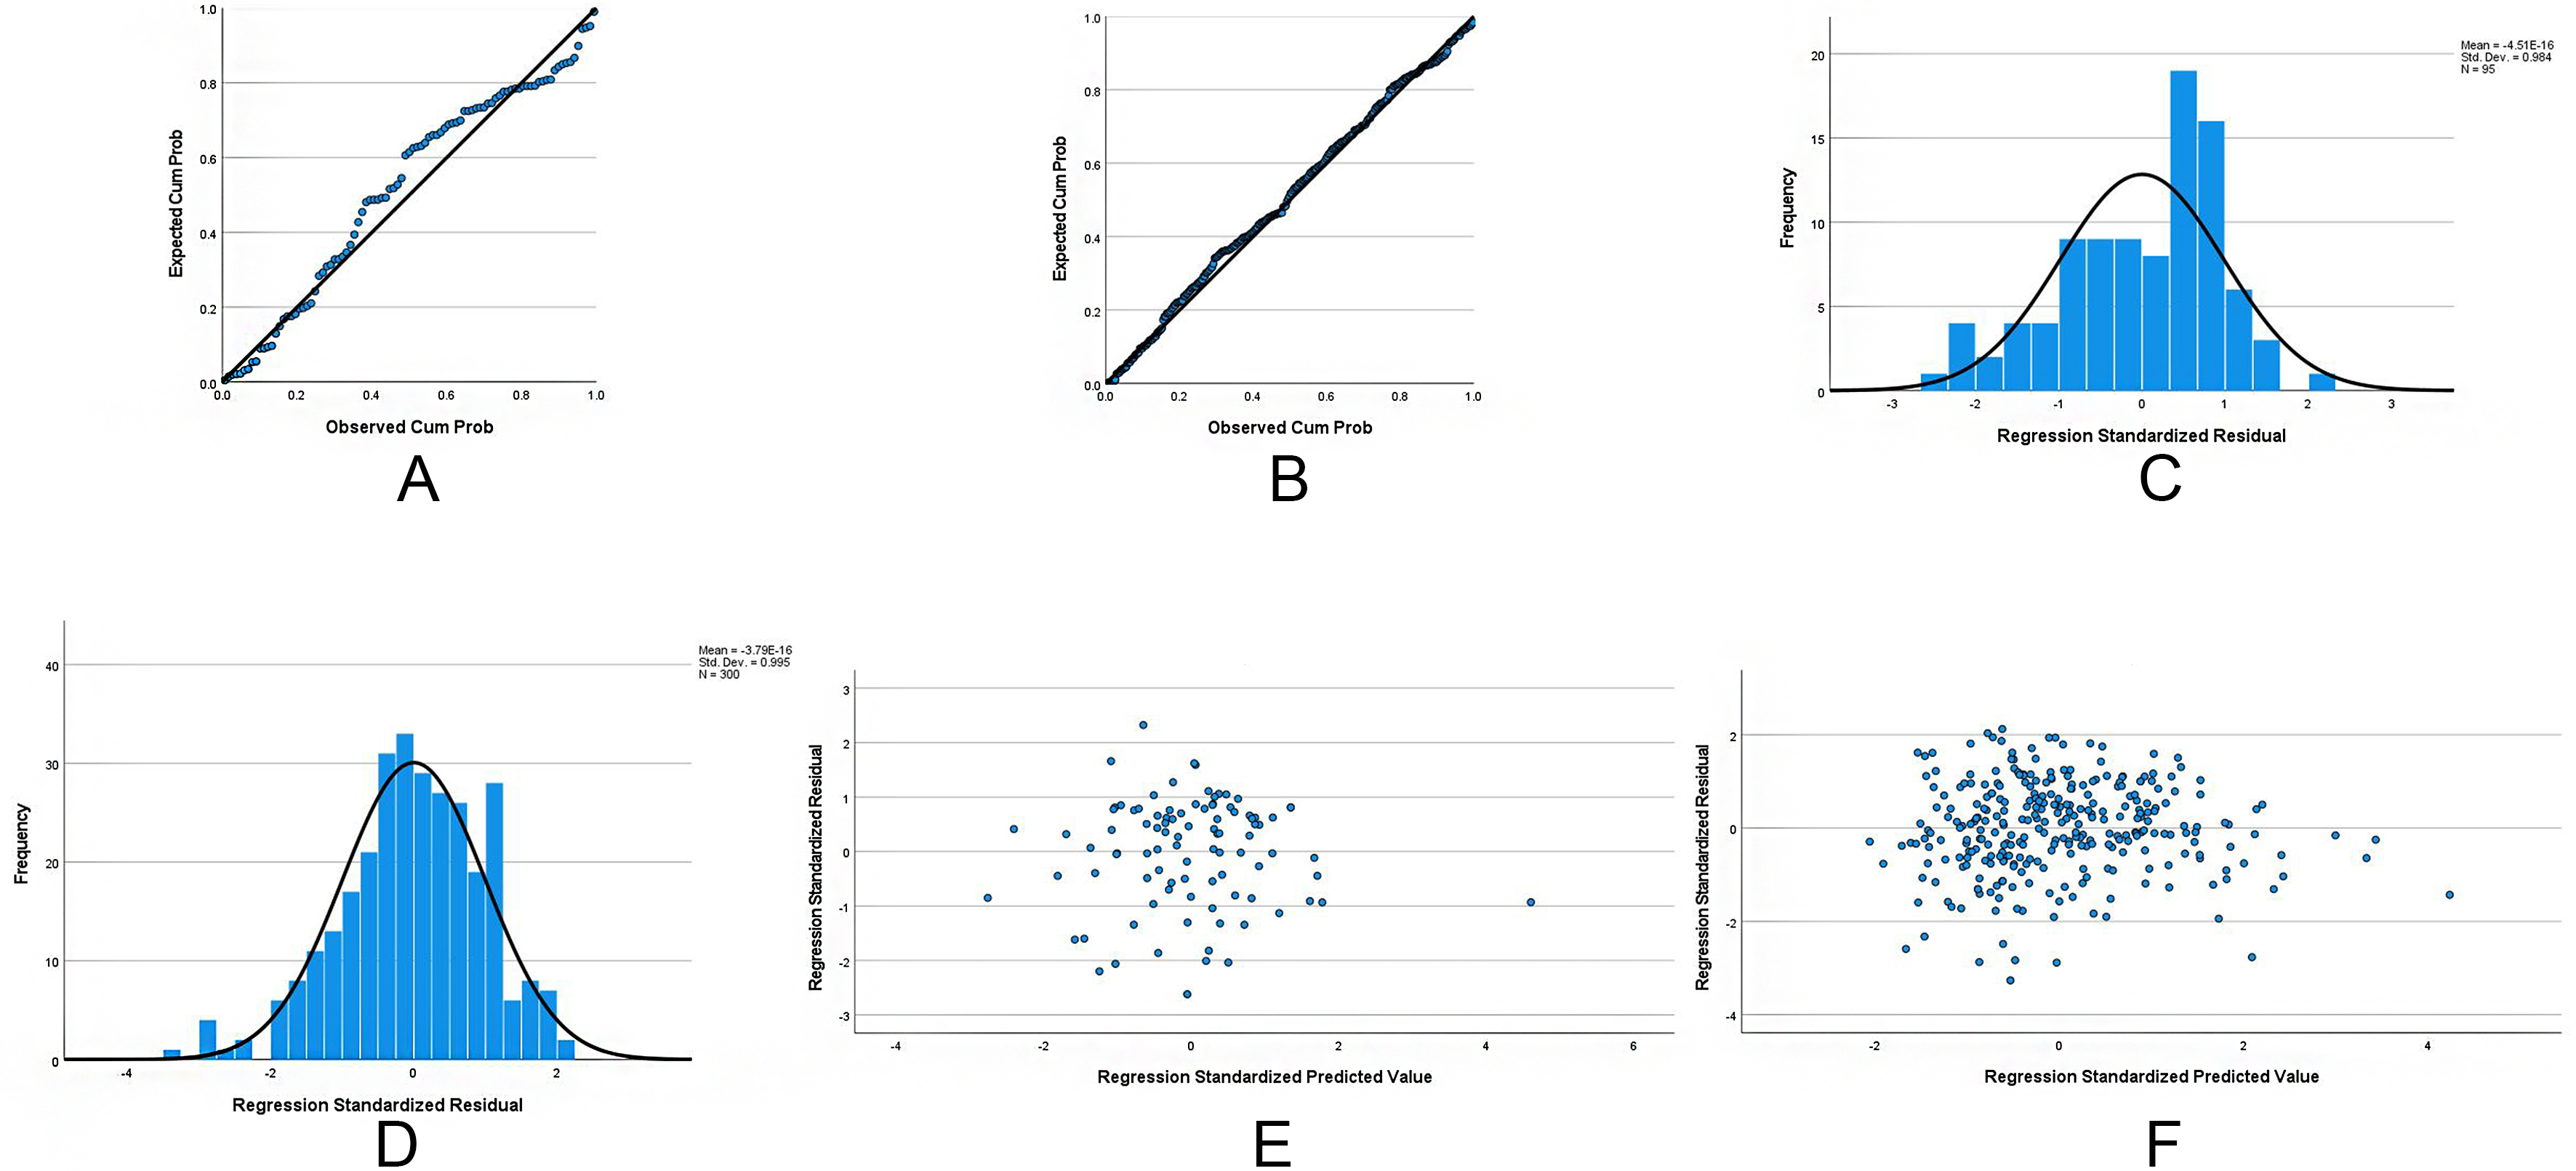
Figure 1. Diagnostic plots assessing assumptions of the multivariable linear regression models for CAP values. (A) Residuals closely follow the diagonal line, supporting normality in the normal-weight model; (B) Residuals approximate the diagonal line, validating normality in the overweight model; (C) Histogram showing a near-normal distribution of residuals for the normal-weight model; (D) Residuals are approximately symmetrical and unimodal in the overweight model, supporting normality; (E) Residuals are randomly dispersed around zero, indicating homoscedasticity for the normal-weight model; (F) Random scatter of residuals confirms homoscedasticity in the overweight model. Collectively, plots (A-F) validate key regression assumptions - normality, homoscedasticity, and independence - for both BMI subgroups. Durbin-Watson statistics (2.01 and 2.02) and VIF values < 5 confirm absence of autocorrelation and multicollinearity, respectively. CAP: Controlled attenuation parameter; BMI: body mass index; VIF: variance inflation factor.


