


fig3
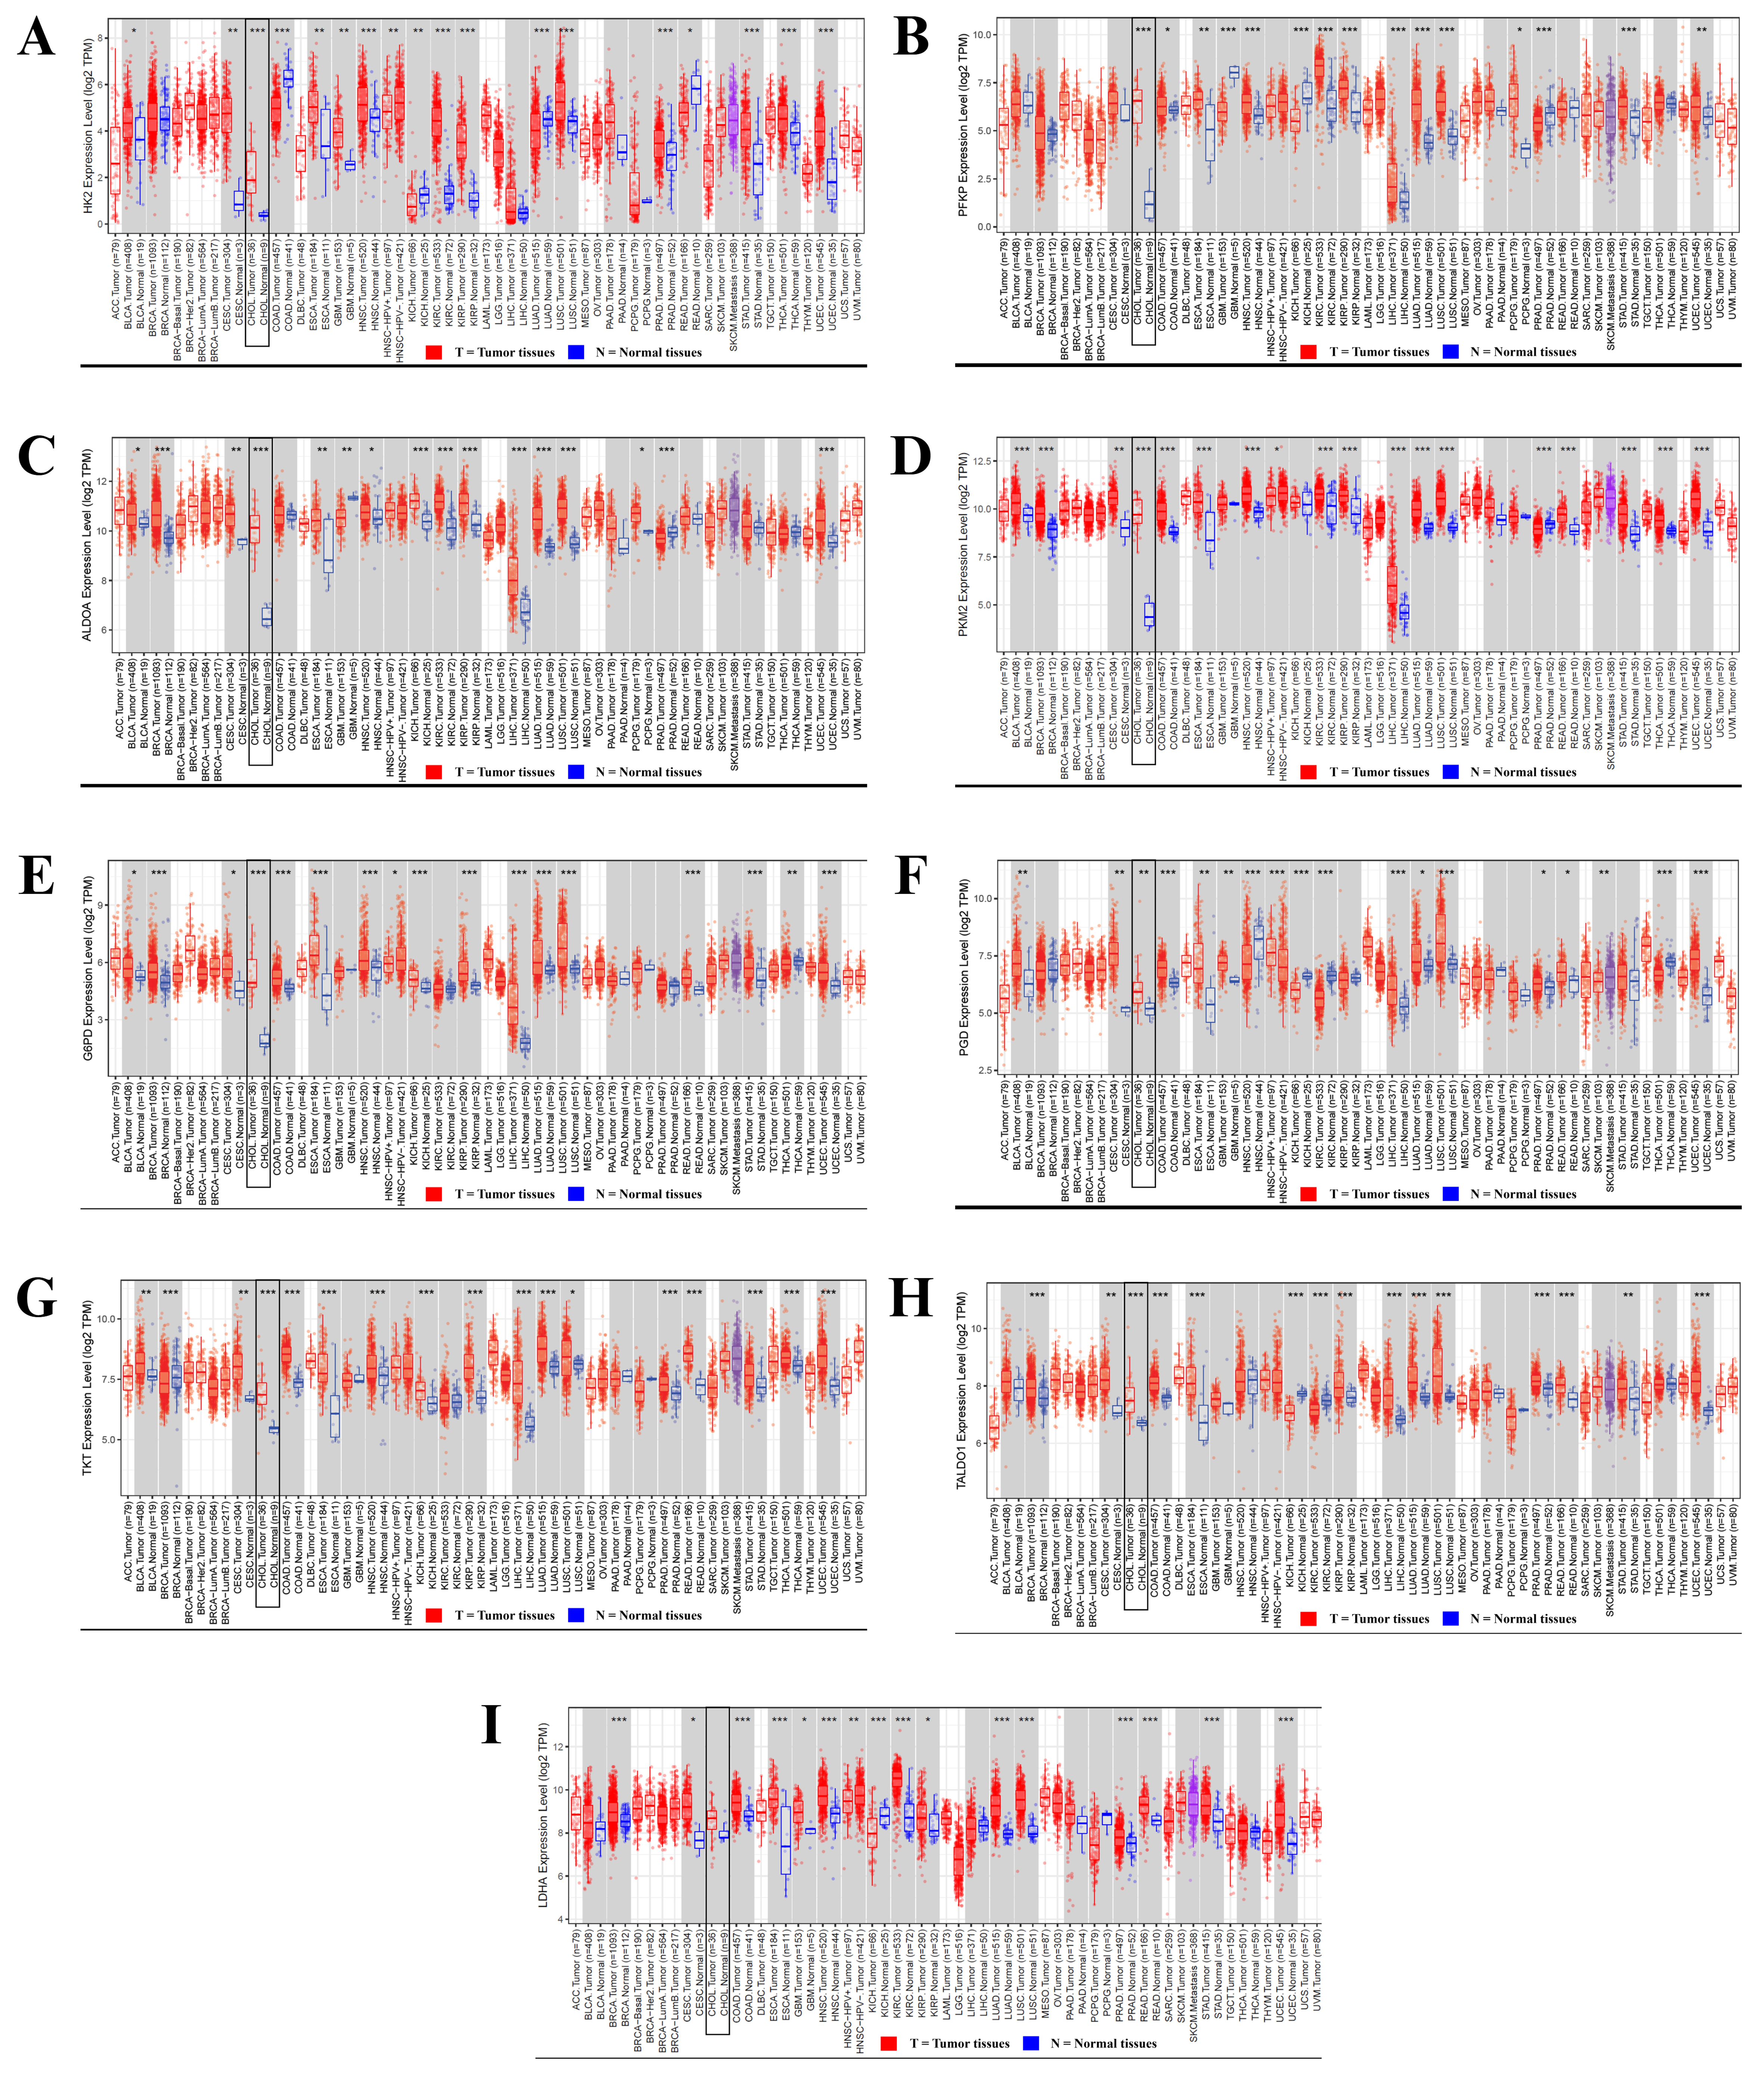
Figure 3. Differential expression of glucose metabolic enzymes in CCA. The distribution of gene expression levels is displayed using box plots (red: tumor tissues; blue: normal tissues) in panels A-I. (A) HKII; (B) PFKP; (C) ALDOA; (D) PKM2; (E) G6PD; (F) 6PGD; (G) TKT; (H) TALDO; (I) LDHA. Statistical significance was determined using the Wilcoxon test, with P-values indicated by the number of stars


