


fig6
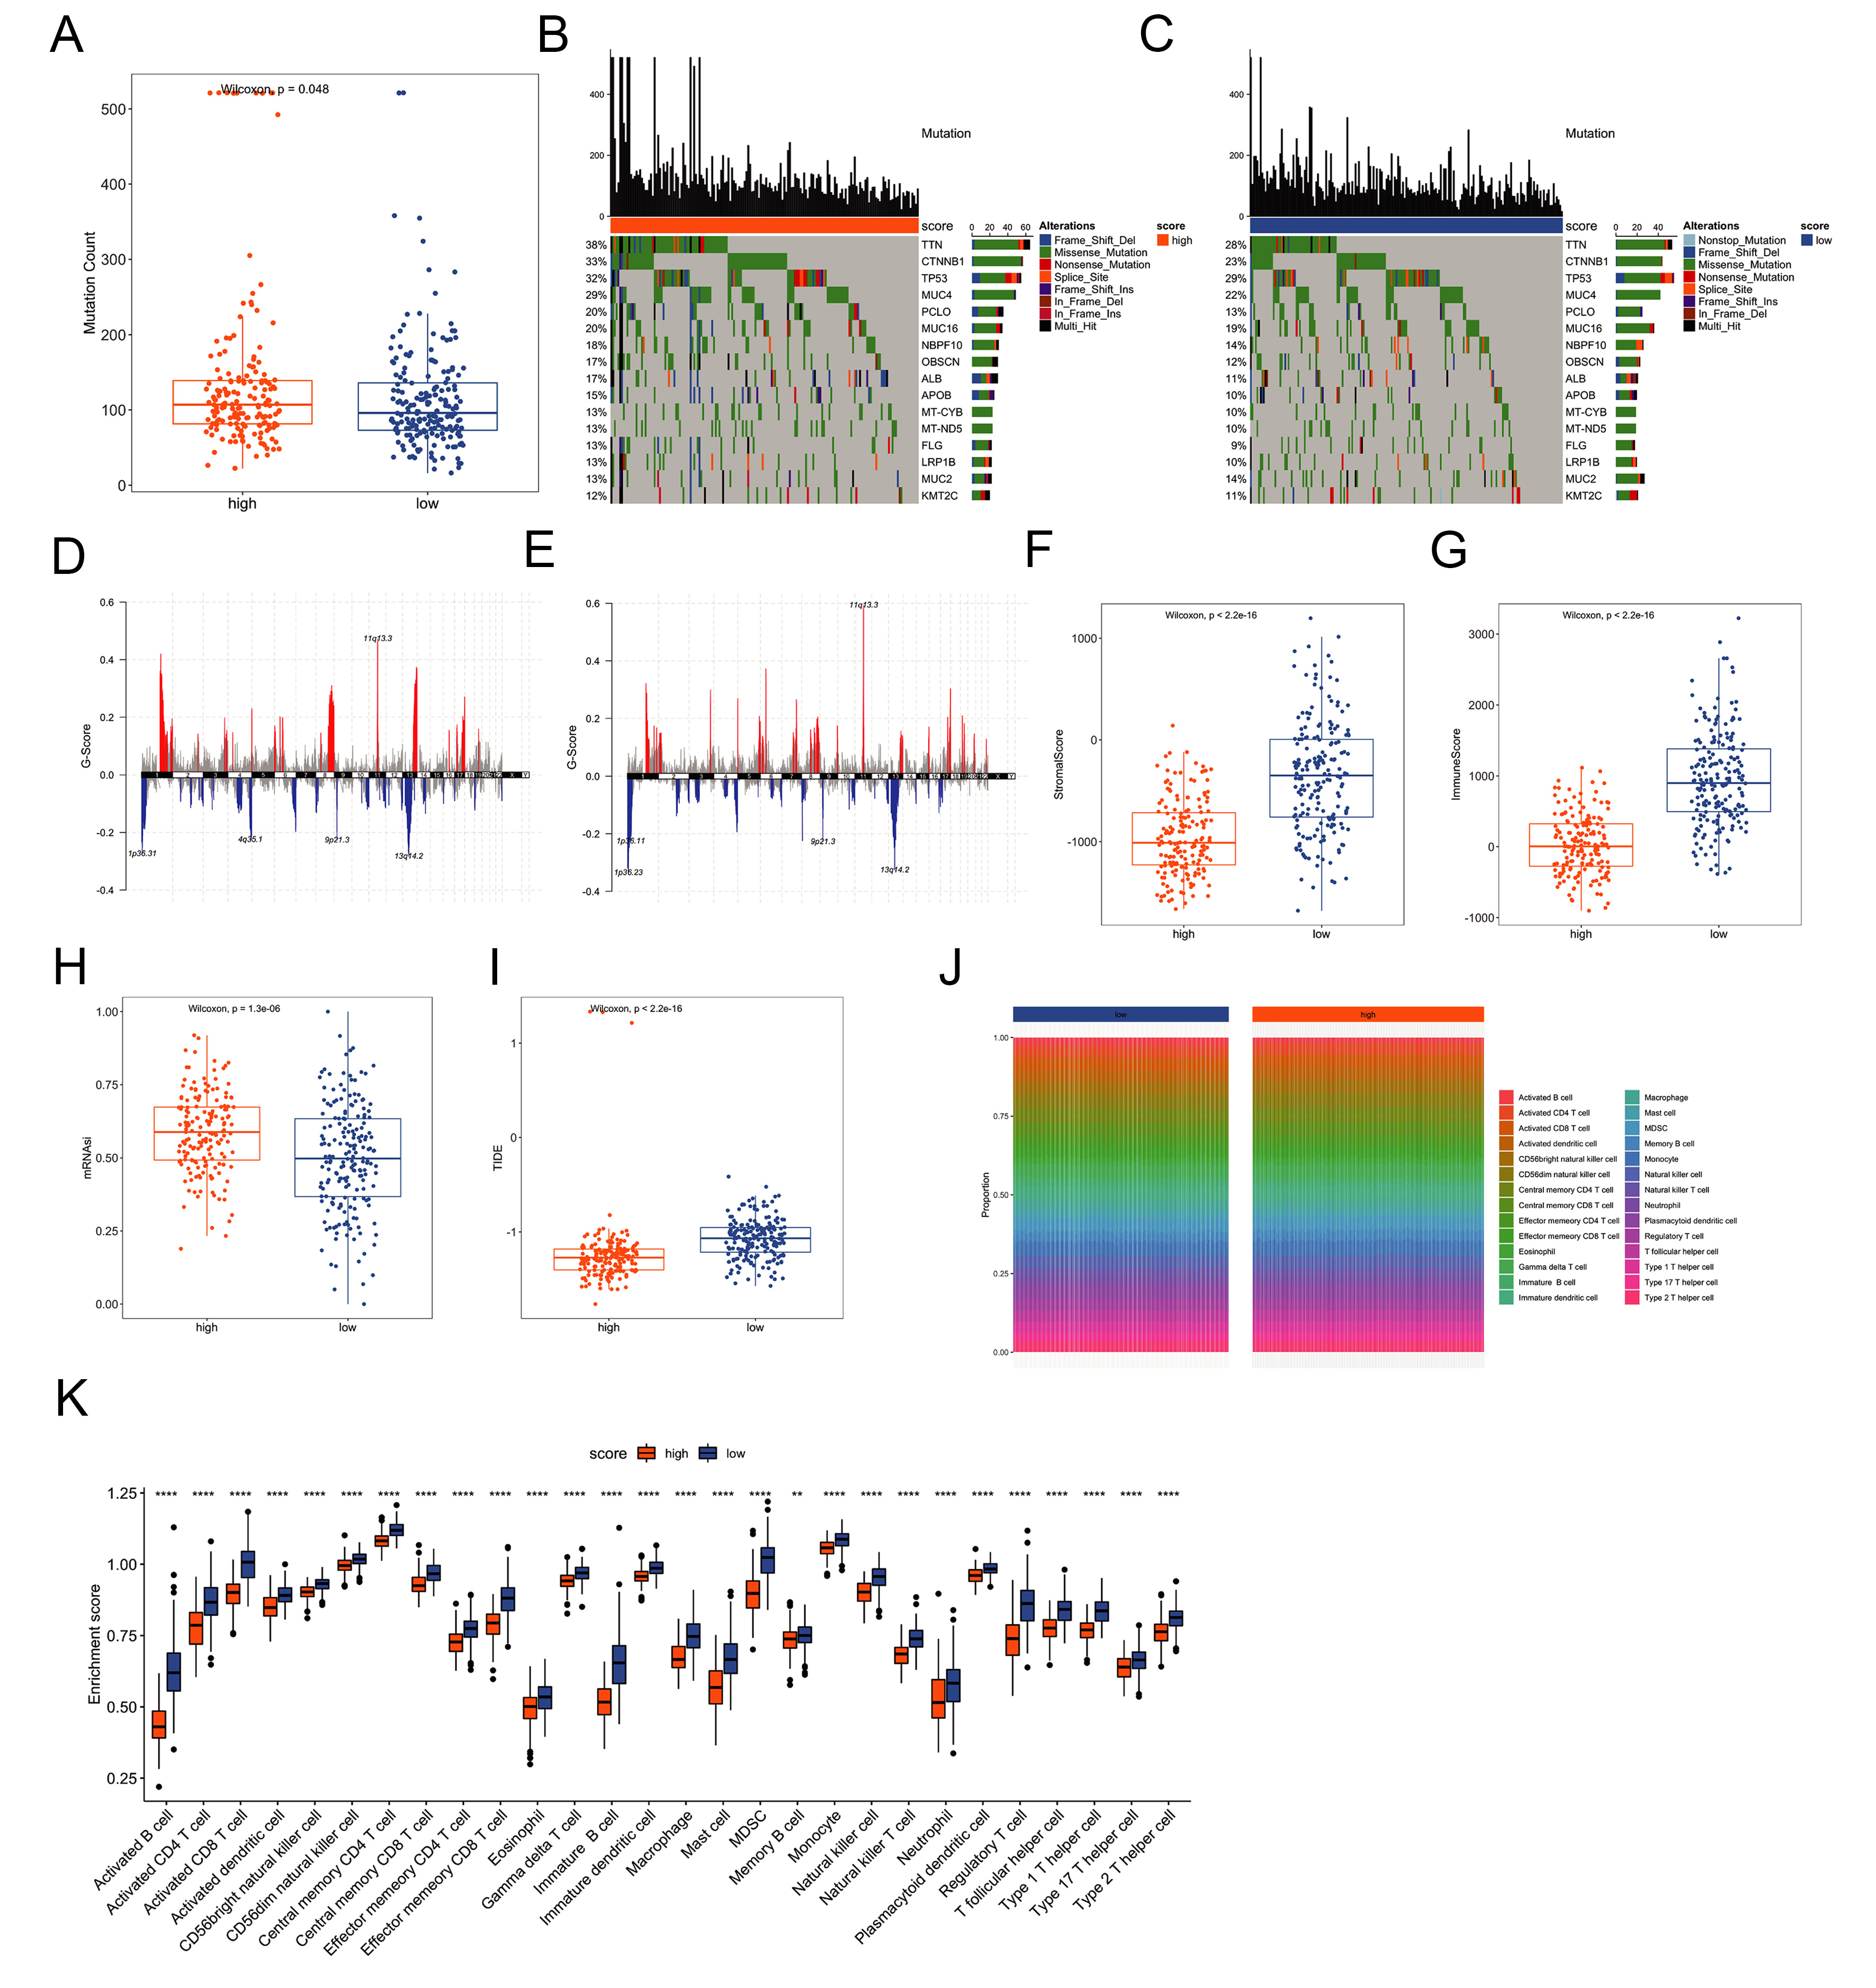
Figure 6. Molecular differences between risk groups. (A) Comparison of mutation counts between risk groups; (B and C) Mutation spectra of the 16 most frequently altered genes in each group; (D and E) CNV profiles across risk groups; (F and G) Immune and stromal scores estimated using the ESTIMATE algorithm; (H) Stemness scores derived from transcriptomic data; (I) TIDE scores predicting immune checkpoint inhibitor response; (J and K) Differential immune-cell infiltration patterns between risk groups. Significance markers are based on nominal P-values from Wilcoxon tests. ***P < 0.001, **P < 0.01, *P < 0.05. CNV: Copy-number variation; TIDE: tumor immune dysfunction and exclusion.


