


fig5
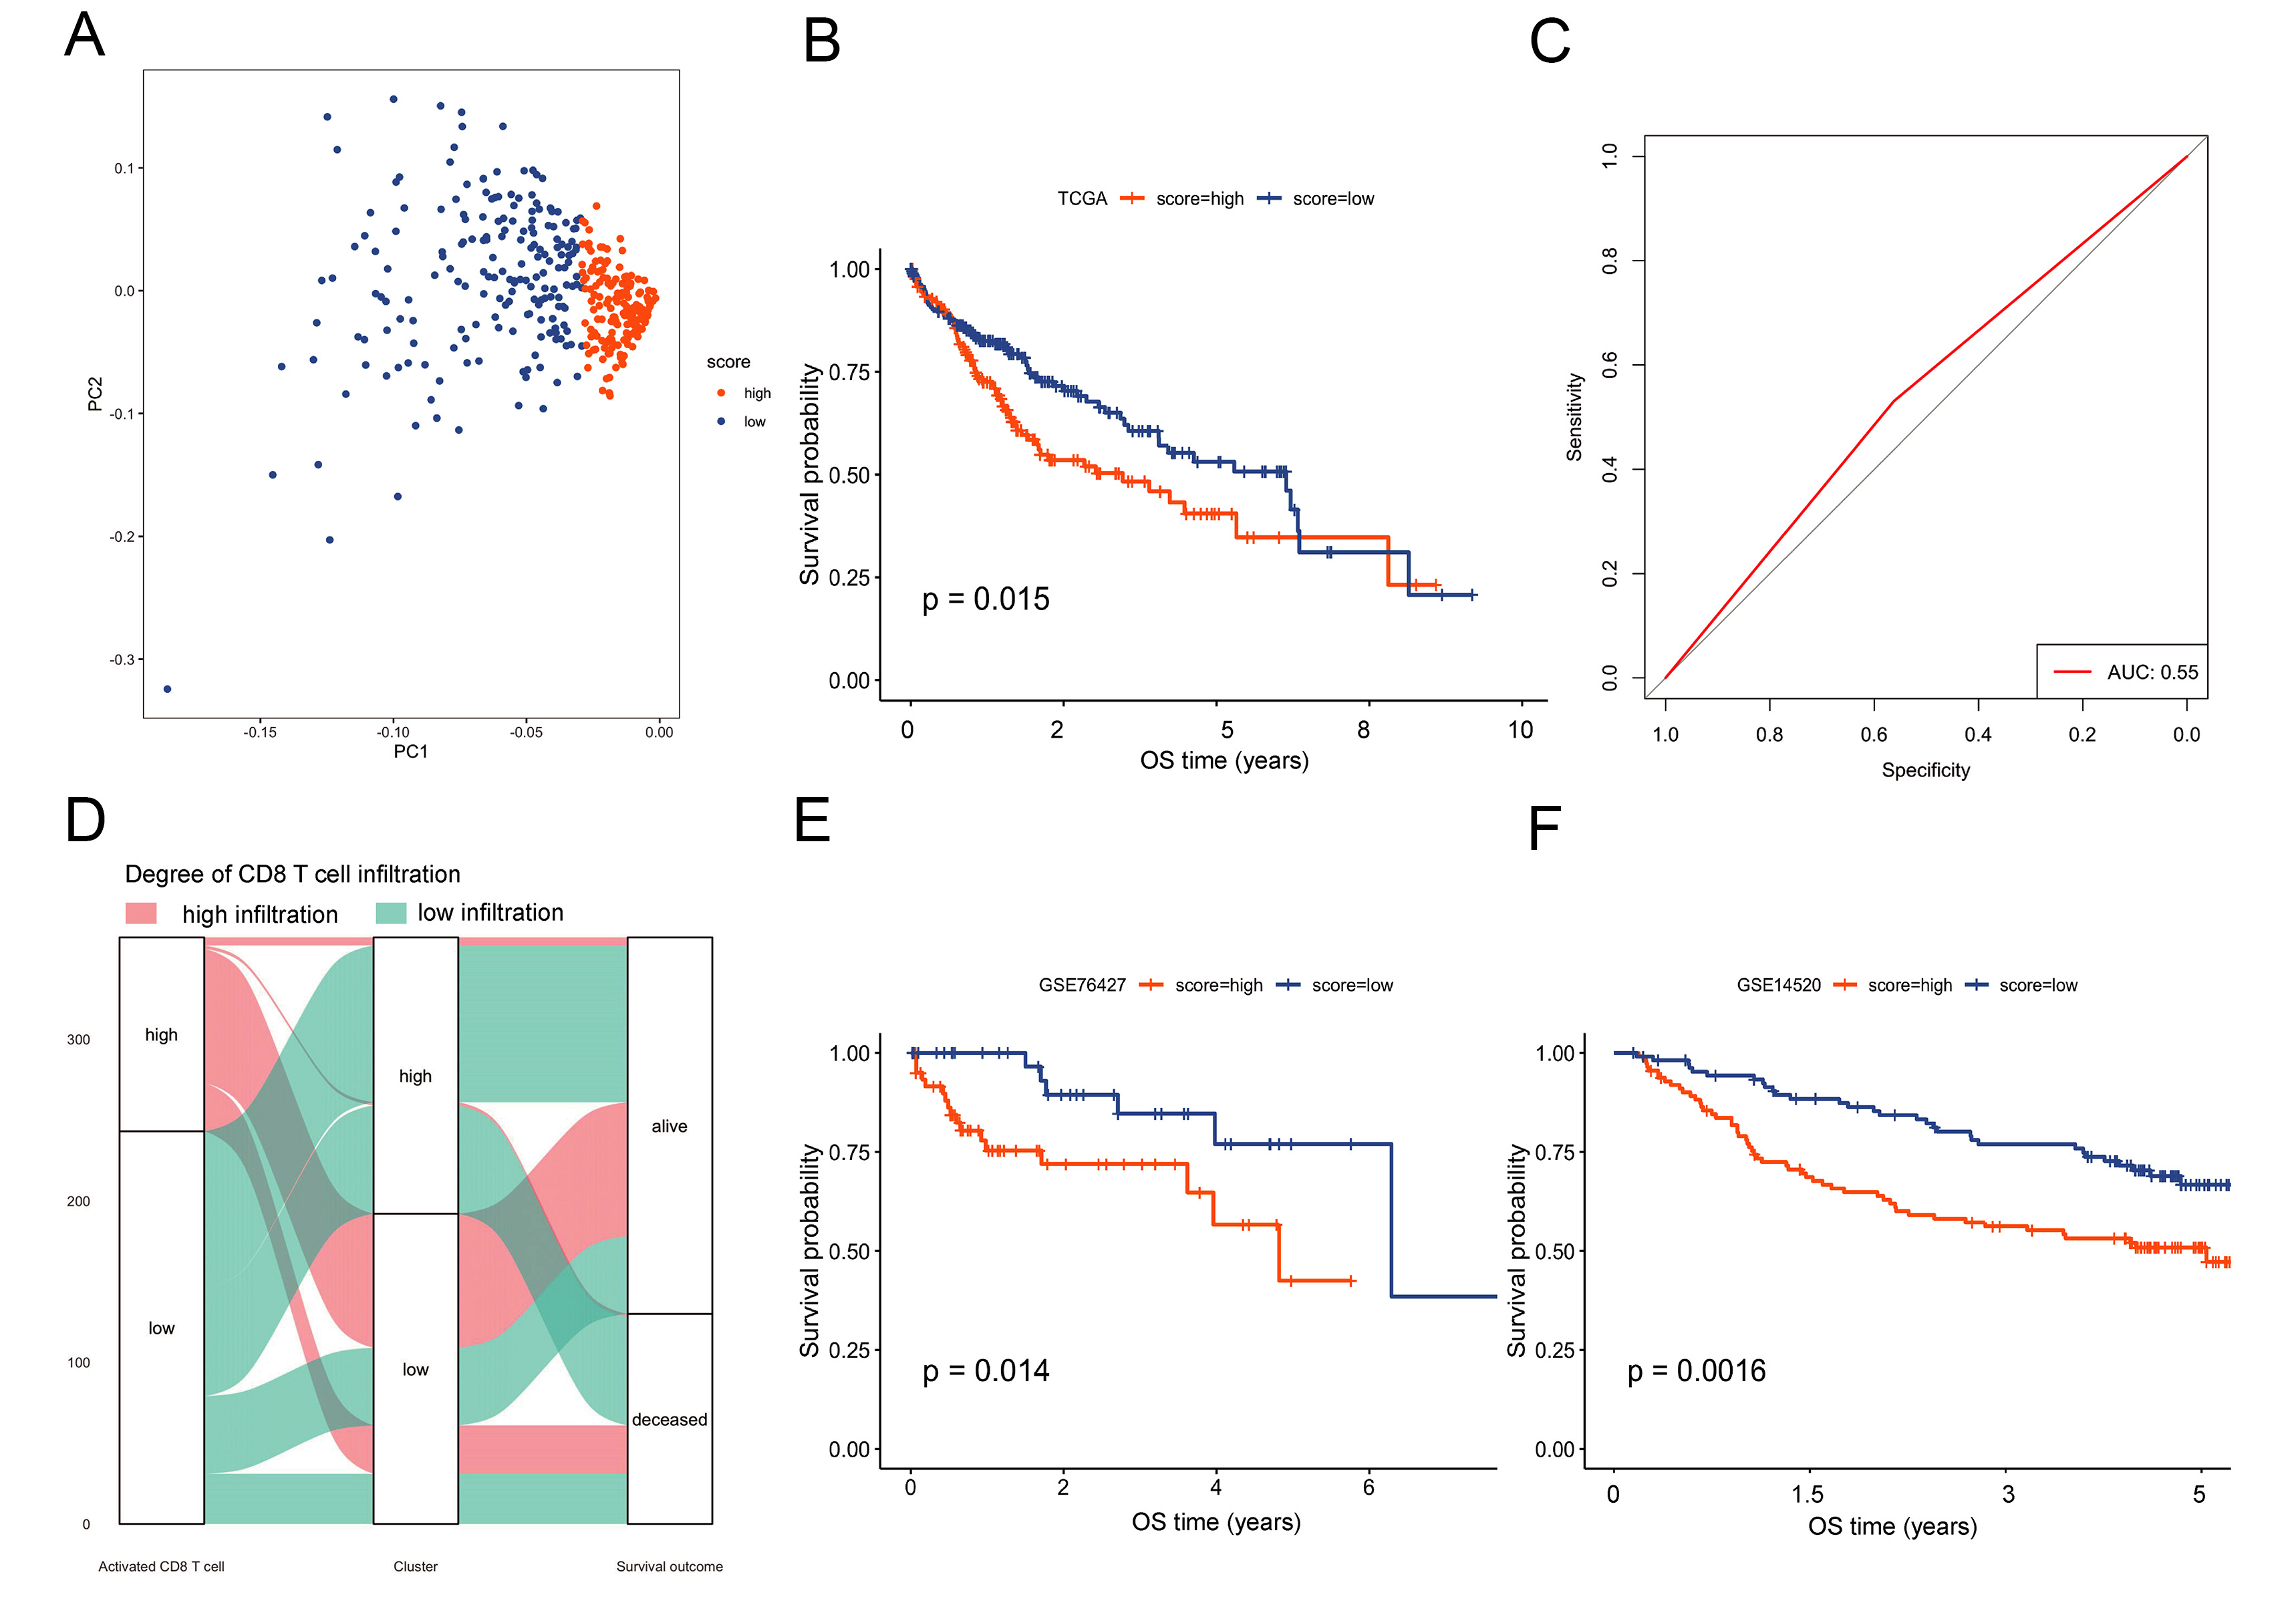
Figure 5. Construction and verification of the risk model. (A) PCA of the 17 hub genes; (B) Kaplan-Meier survival curves for high-risk vs. low-risk groups in the TCGA cohort; (C) ROC curve reached 0.55; (D) Sankey diagram illustrating relationships among molecular clusters, risk groups, and key clinical features; (E and F) External validation of the risk model in GEO datasets GSE76427 and GSE14520. PCA: Principal component analysis; TCGA: the Cancer Genome Atlas; ROC: receiver operating characteristic; GEO: the Gene Expression Omnibus; OS: overall survival; AUC: area under the ROC curve.


