


fig4
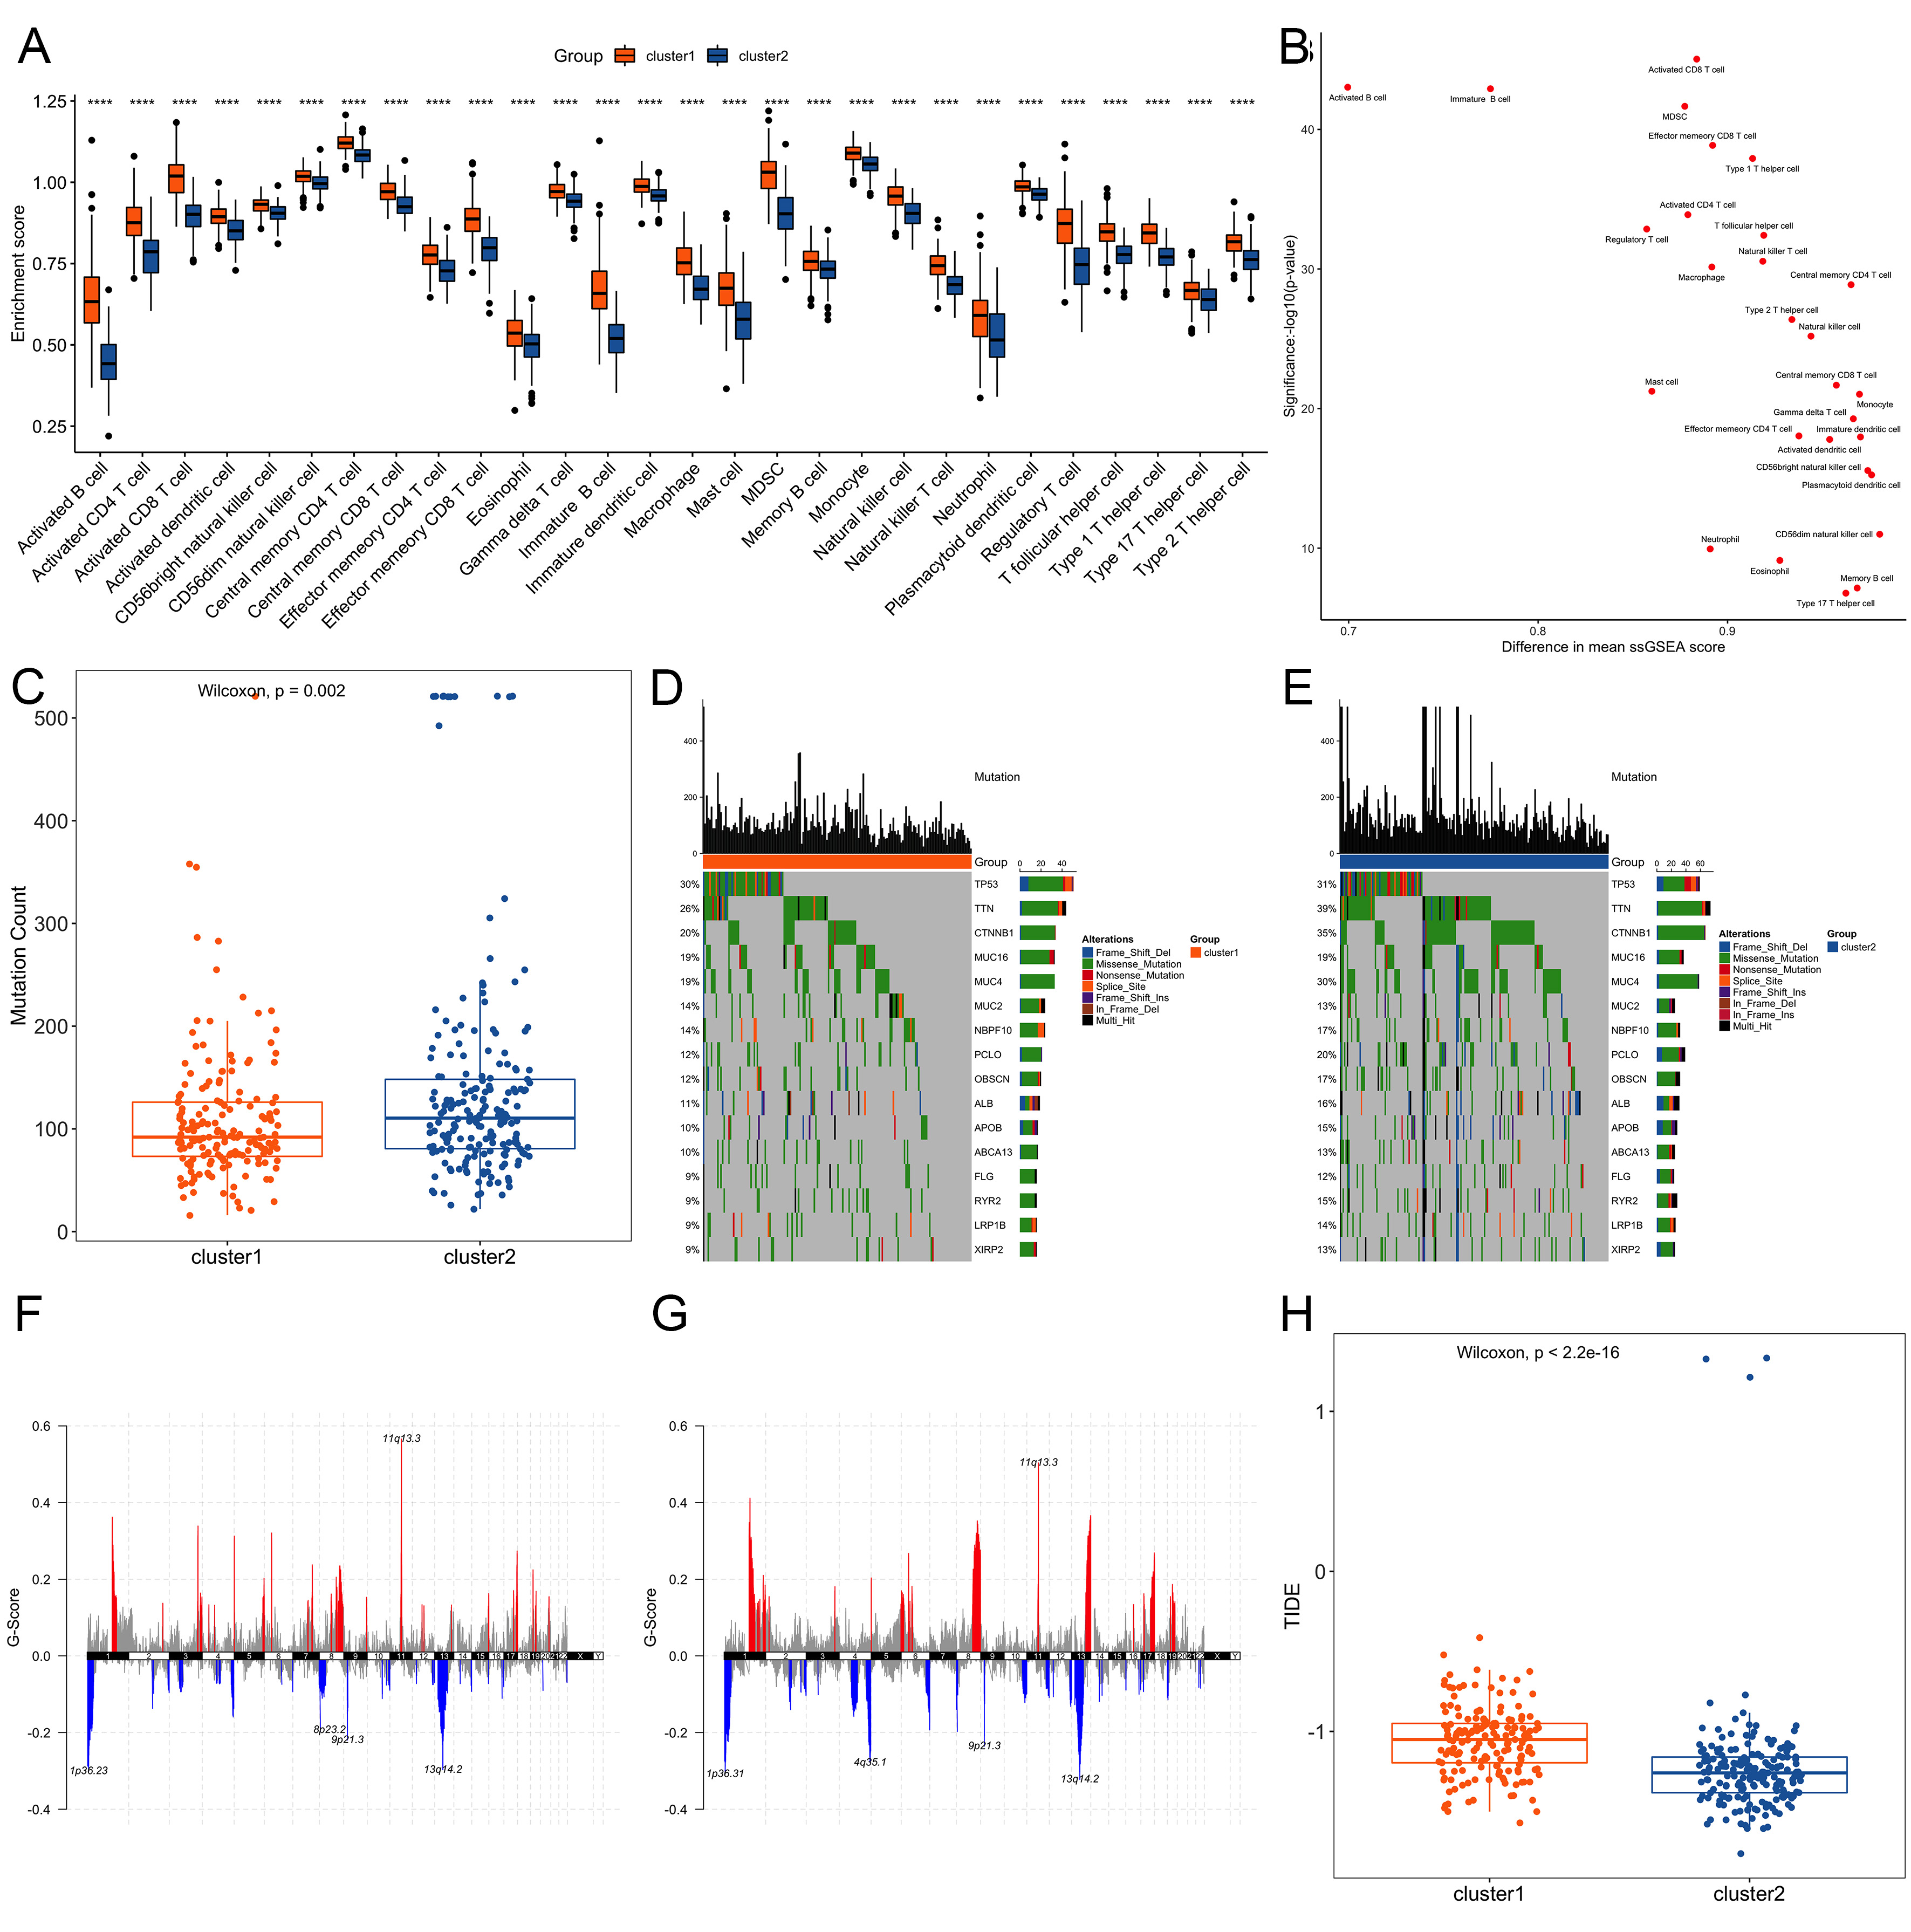
Figure 4. Comparative molecular profiling between Cluster 1 and Cluster 2. (A) Distribution difference of immune cell infiltration ratio between the two clusters. Significance markers are based on nominal P-values from Wilcoxon tests. ***P < 0.001, **P < 0.01, *P < 0.05; (B) Difference distribution scatter plot of the immune cell infiltration ratio in the two clusters; (C) Number of gene mutations between the two clusters; (D and E) Distribution of mutations of 16 intersecting genes in the two clusters; (F and G) Distribution of copy number variation regions in the two clusters; (H) TIDE score of Cluster 1 was significantly higher than that of Cluster 2. TIDE: Tumor immune dysfunction and exclusion.


