


fig3
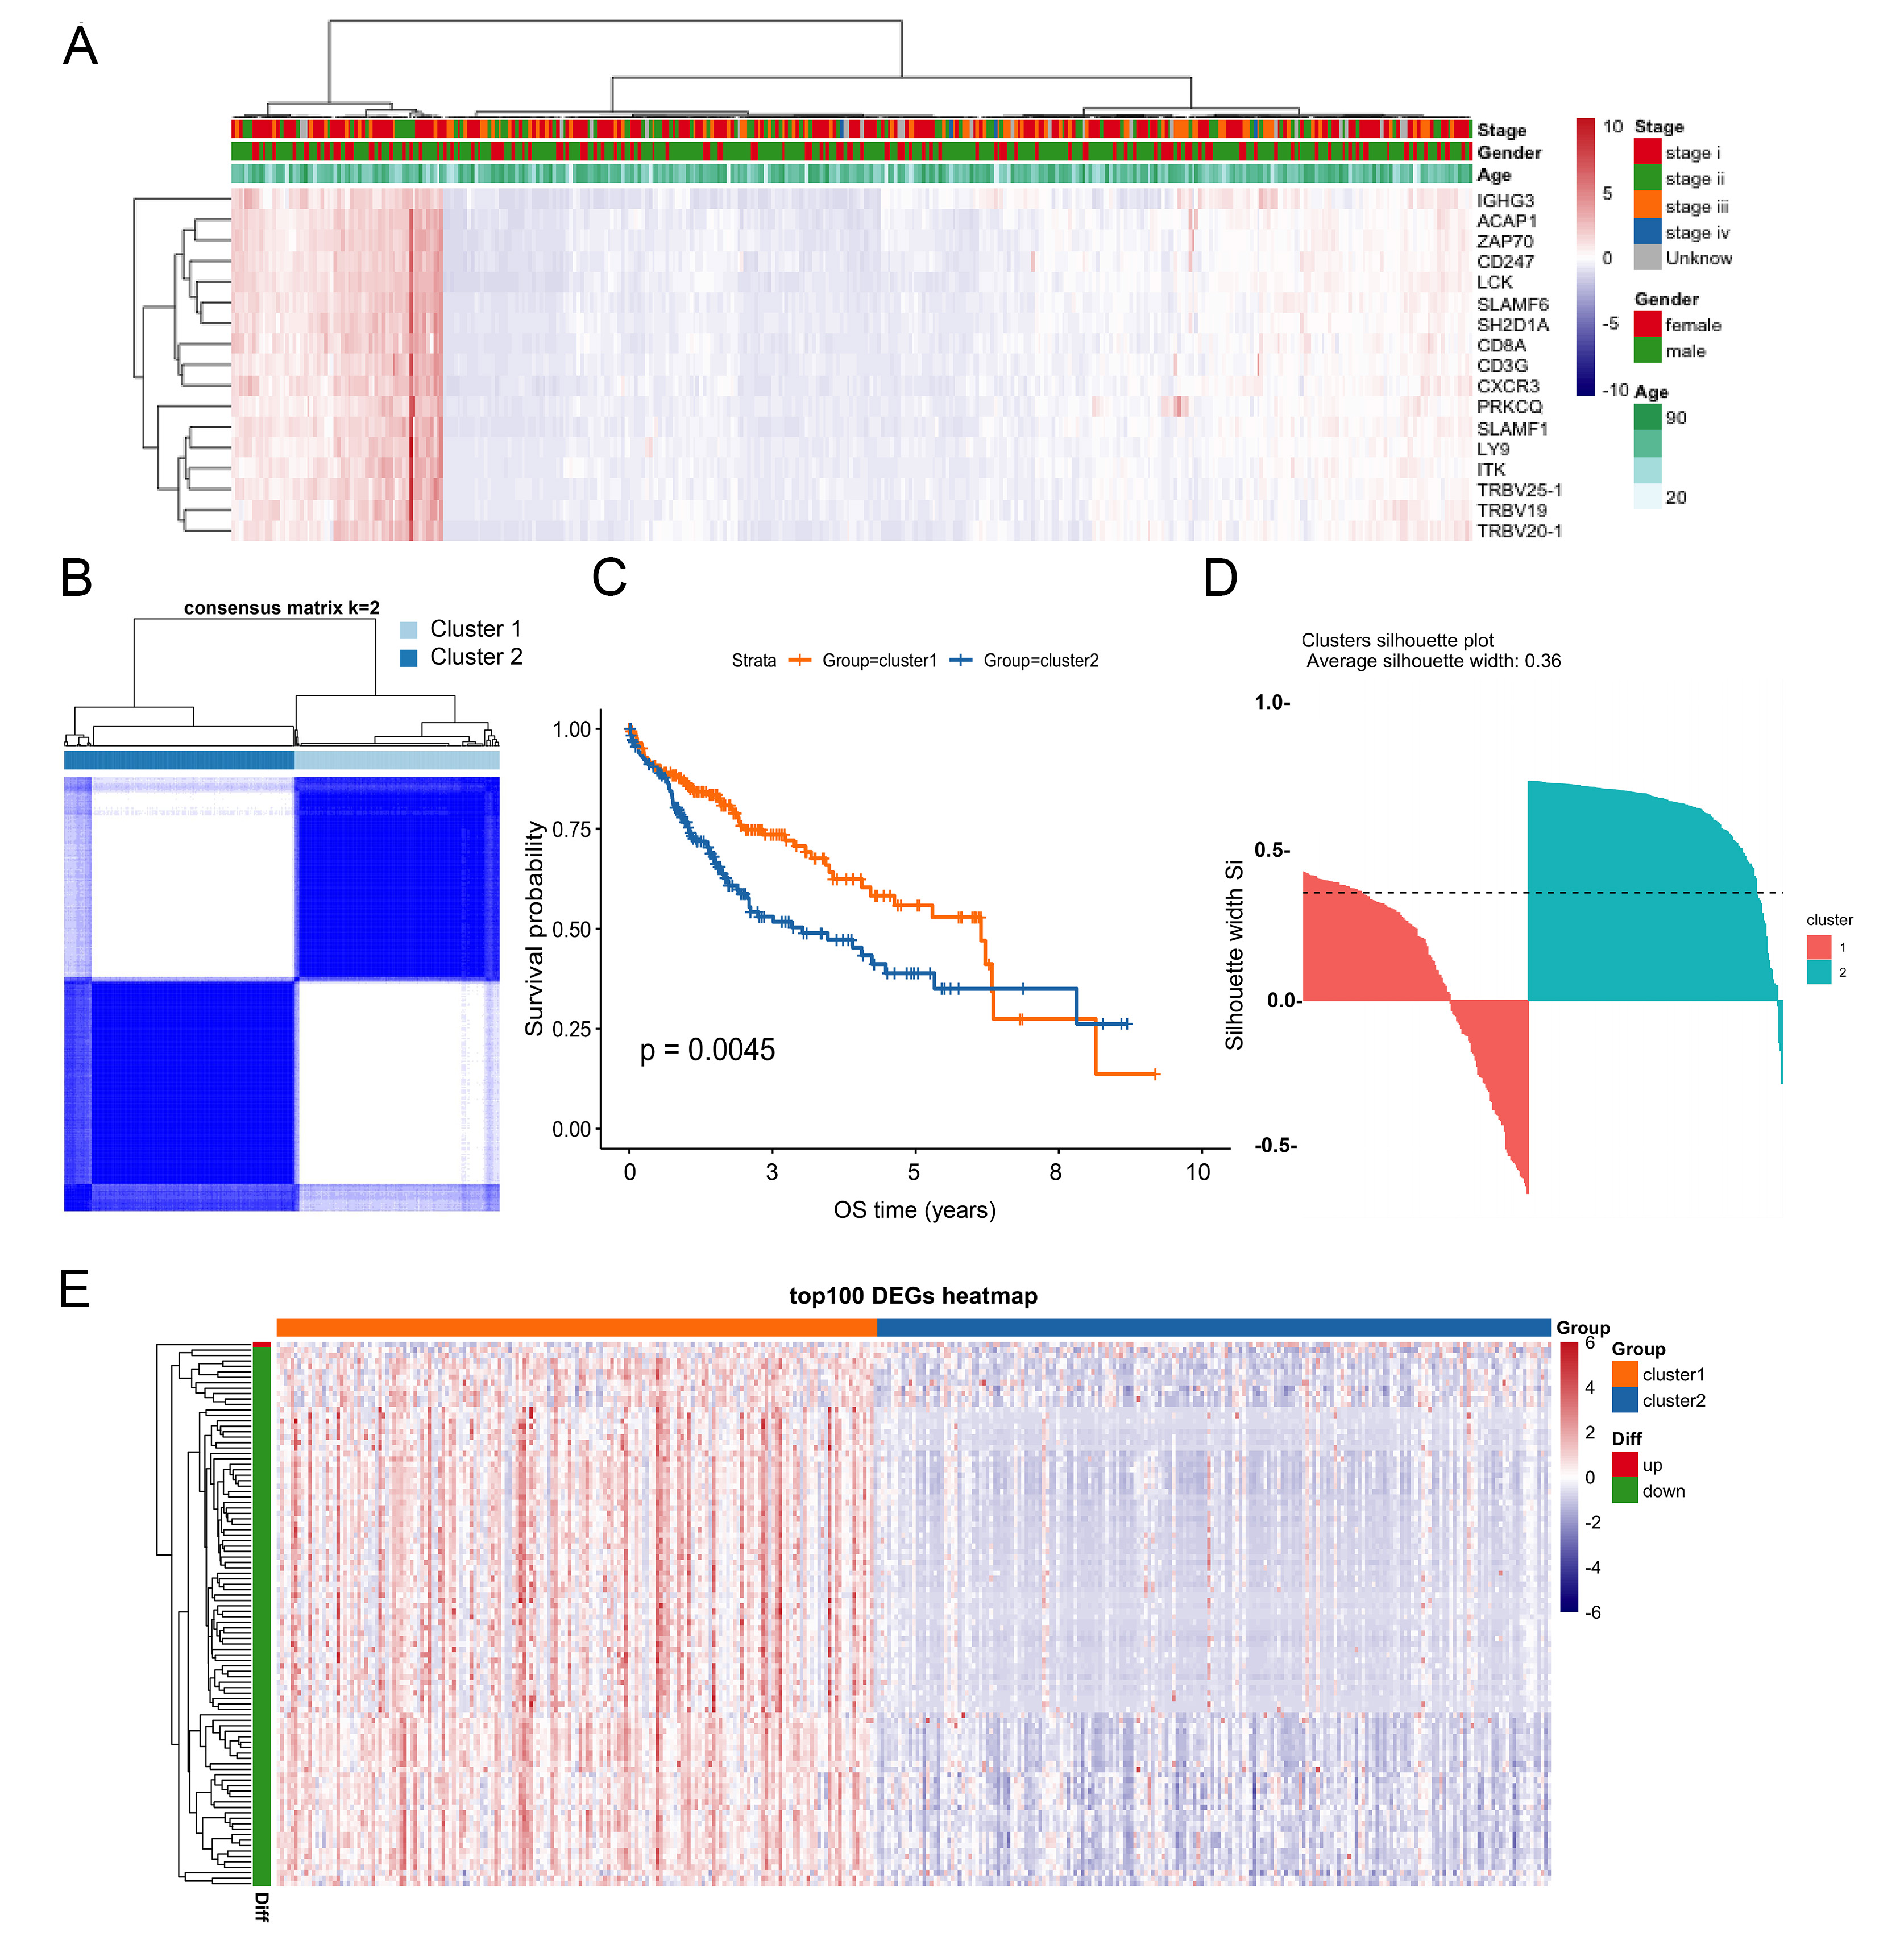
Figure 3. Classification and subtypes based on the hub genes. (A) The heat scale shows the Z-score-normalized hub gene expression; (B) Consensus clustering identified two robust subtypes: Cluster 1 and Cluster 2; (C) Kaplan-Meier survival curves comparing Clusters 1 and 2; (D) Assessment of clustering stability using average silhouette width; (E) The heat scale shows the Z-score-normalized to the top 100 DEGs. DEGs: Differentially expressed genes.


