


fig2
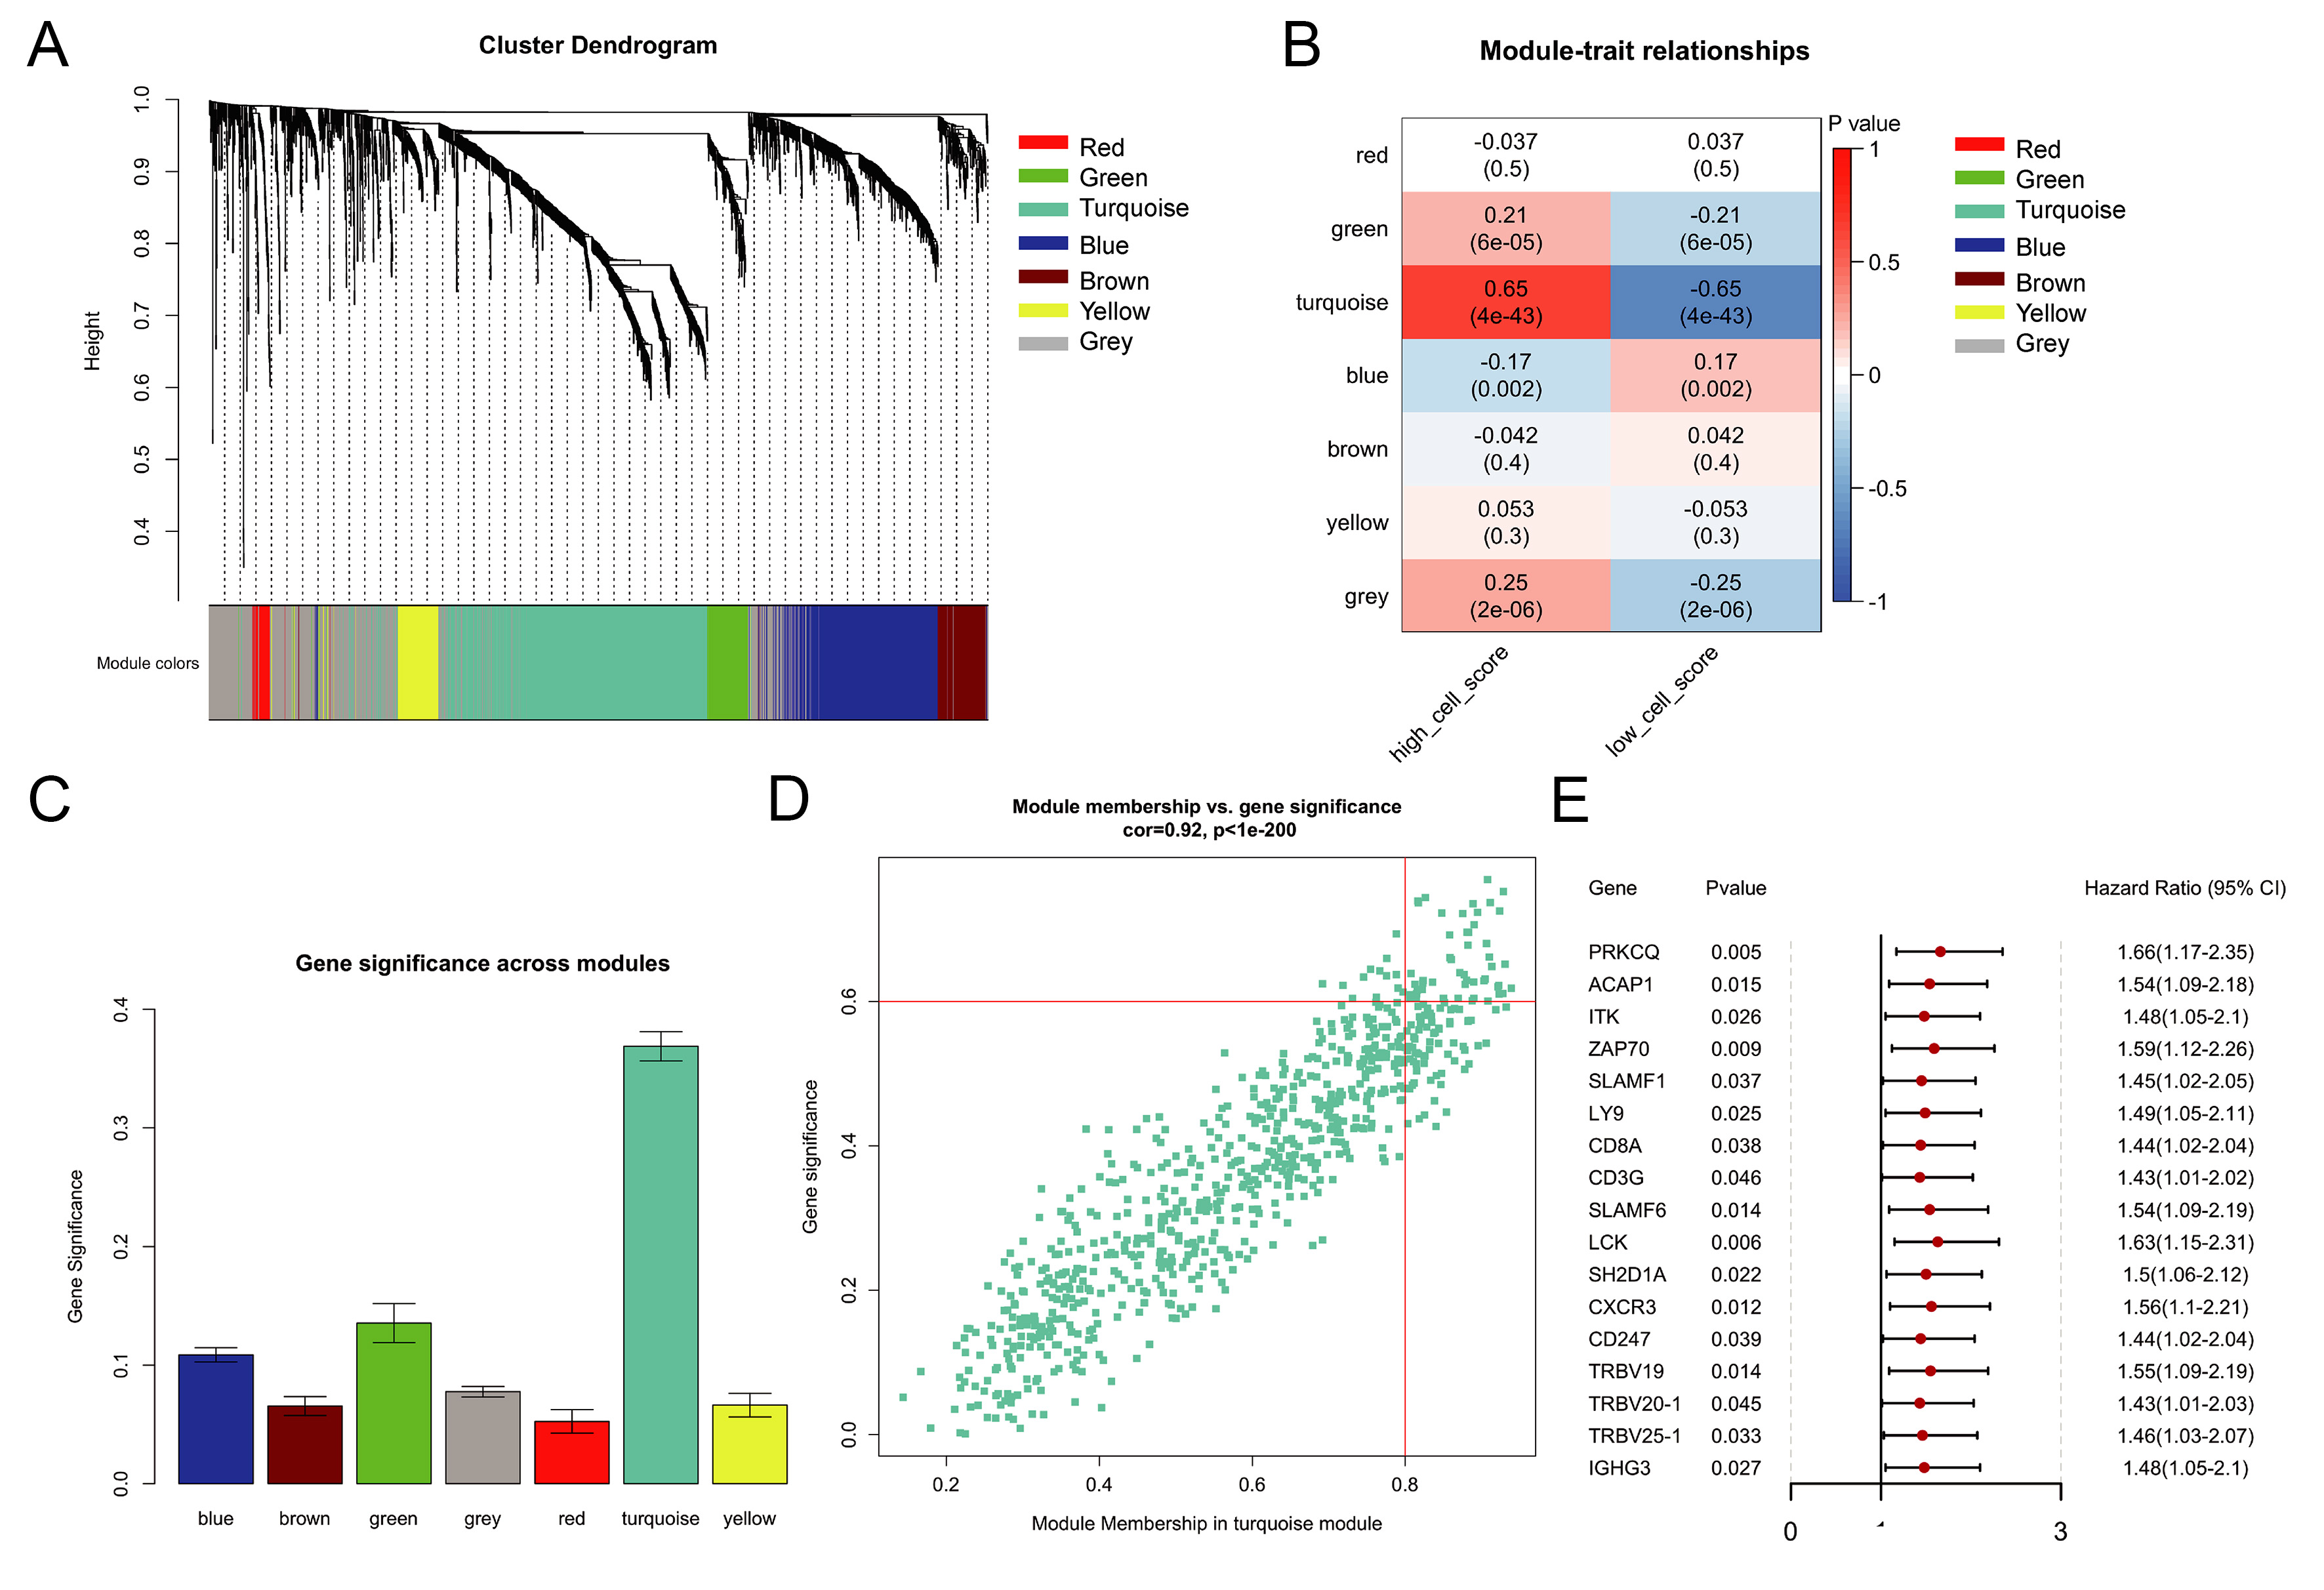
Figure 2. WGCNA co-expression module. (A) Gene dendrogram and module colors; (B) Heatmap of module-trait correlations. Rows represent MEs, columns represent clinical traits. Color intensity reflects Pearson correlation coefficients (red: positive; blue: negative); each cell shows the correlation coefficient and corresponding P-value; (C) GS value for every module; (D) MM value and GS value of turquoise module genes; (E) Forest plot displaying 17 hub genes significantly associated with prognosis (P < 0.05) identified by univariate Cox regression. MEs: Module eigengenes; GS: gene significance; MM: Module Membership.


