


fig1
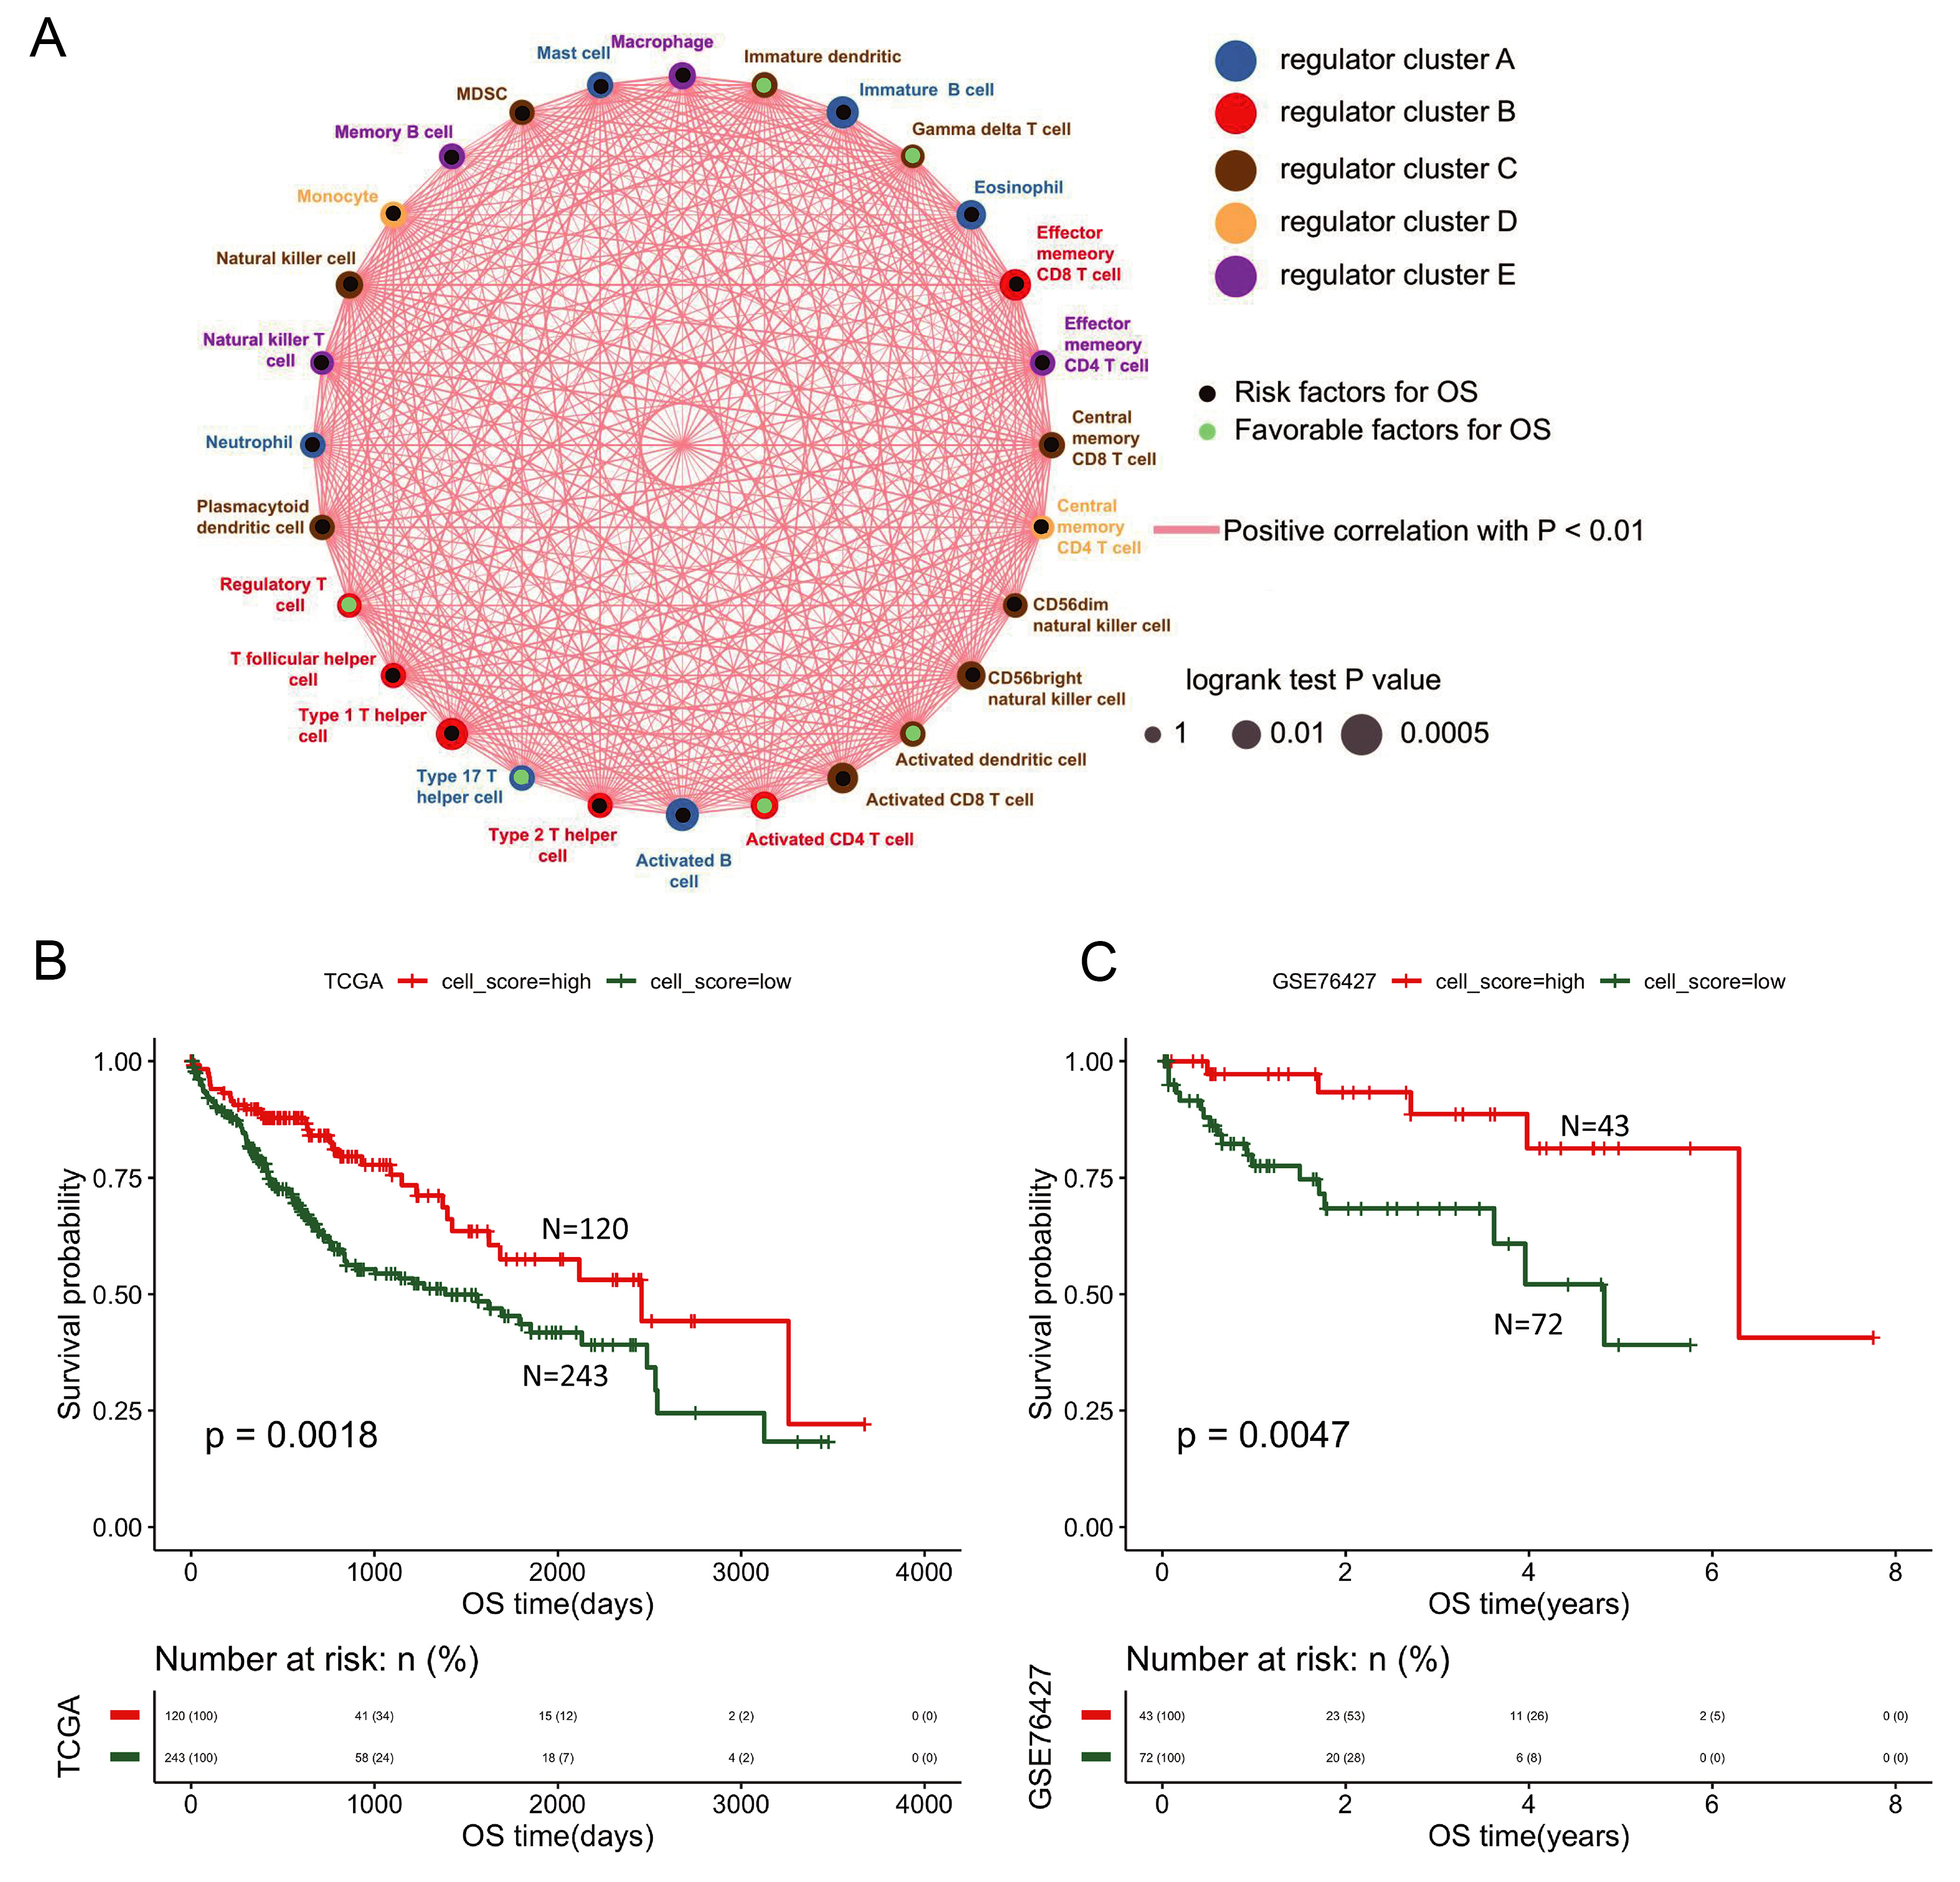
Figure 1. Immune cell network and activated CD8+ T cell infiltration group prognosis. (A) Network depicting interactions among 28 tumor-infiltrating immune cell types. Circle size represents the magnitude of association with OS; green and black nodes indicate favorable and unfavorable prognostic factors, respectively. Connecting lines denote interactions, with red lines representing positive correlations; (B) Prognostic survival curve of activated CD8+ T cell infiltration groups in the TCGA database; (C) Prognostic survival curve of activated CD8+ T cell infiltration groups in the GSE76427 database. OS: Overall survival; TCGA: the Cancer Genome Atlas.


