

Occurrence and distribution of several endocrine-disrupting chemicals in a chemical park: exploring the health risks of multiple pollutants

Abstract
Triclosan (TCS), triclocarban (TCC), parabens, bisphenols (BPAs), tetrabromobisphenol A and its alternatives (TBBPAs), and phthalate esters (PAEs) are typical endocrine-disrupting chemicals (EDCs), which have received increasing attention due to their potential adverse effects on ecological and human health. Human exposure to these EDCs is widespread. However, data regarding the distribution and related health risks of multiple EDCs in chemical parks are relatively scarce. In this study, 28 EDCs were determined in surface soil, sediment, and sludge samples collected from the Yangkou Chemical Industrial Park (Jiangsu, China). With the exception of TBBPAs, the distributions of Σ(TCS + TCC), Σ6parabens, Σ8BPAs, and Σ9PAEs in environmental media were as follows: sludge > sediment ≥ soil. No obvious differences were found regarding the concentrations of Σ9PAEs within the soil samples. Higher levels of Σ(TCS + TCC) (186 μg kg-1 dw) and Σ3TBBPAs (154 μg kg-1 dw) were found in the soil near a chemical manufacturer and the main sewage outlet of a wastewater treatment plant, respectively. The non-carcinogenic risks of EDCs from soil were estimated, and the risk levels were found to be a few orders of magnitude lower than the reported reference dose (RfD) values. The hazard indexes for all the samples were smaller than one, suggesting that the chemical industrial park posed a low risk to the workers. Additionally, the mass inventories of Σ(TCS + TCC), Σ6parabens, Σ8BPAs, Σ3TBBPAs, and Σ9PAEs were estimated to be 507, 90.6, 133, 20.7, and 1090 kg, respectively. These findings help to establish baseline concentrations for EDCs in soil, sediment, and sludge in a chemical industrial park.
Keywords
INTRODUCTION
Synthesized chemicals, triclosan (TCS; antimicrobial) and (TCC; antimicrobial), p-hydroxybenzoic acid esters (parabens; preservatives), bisphenols (BPAs; plastics), tetrabromobisphenol A and its alternatives (TBBPAs; flame retardants), and phthalate esters (PAEs; plasticizers) are widely used in industrial and consumer products[1-5]. There is increasing concern regarding exposure to these endocrine-disrupting chemicals (EDCs) due to their potential adverse impact on wildlife and human health.
TCS and TCC are used as antimicrobials in personal care products (PCPs), including toothpaste, soaps, shampoos, and cosmetic products[6]. The estrogenic activities of TCS and TCC have been reported in in vitro and in vivo experiments[7,8]. The results of previous studies have suggested that TCS has potential endocrine-disrupting effects on aquatic species (e.g., algae, invertebrates, and fish), which manifest as an influence on their thyroid hormone homeostasis and the reproductive axis[9]. Due to its potential adverse effects, in 2010, TCS was banned from being applied in plastic food-contact materials by the European Union (EU)[9]. In 2016, TCC and TCS were removed from the United States Food and Drug Administration (FDA) approved list of over-the-counter consumer antiseptic wash products[10].
Products of parabens are widely used as preservatives in pharmaceuticals, cosmetics, food packaging-commodities, and industrial products[11,12]. Parabens have been reported to elicit adverse effects on different organs and systems in the body, such as the reproductive system, breast tissue, adipose tissue, pancreas, etc.[11]. For example, the results of experimental studies suggest that n-butylparaben could alter the processes of steroidogenesis and spermatogenesis by changing E2 levels in male rats[13]. Denmark banned the use of parabens in cosmetic products for children under three years old in 2011[14]. The European Union, the US FDA, and Health Canada have also proposed a limit of 0.4% for single compounds and 0.8% for mixtures in cosmetics[15,16].
Bisphenol A (BPA) is used in a variety of polycarbonate plastics and epoxy resins, as well as in consumer products including food containers, dental sealants, thermal receipt papers, children’s toys, and medical equipment[17]. BPA is one of the most commonly produced chemicals worldwide. In 2020, the global production volume for BPA was approximately 6.35 million tons, and the annual growth rate from 2020 to 2025 was 5.0%[18]. Recent monitoring studies have shown that BPA is ubiquitous in the environment, and can be found in sediment, water, soil, sludge, and indoor dust[3]. The findings of a few studies that focused on the toxicity of BPA indicated that it has adverse effects on the reproductive systems, and can be a cause of metabolic syndrome and breast cancer[11]. Hence, BPA was added to the list of chemicals prohibited for use in infant bottles by the governmental units of Canada and the EU[19,20]. Due to strict regulations on the application of BPA, structural alternatives have been developed, including bisphenol S (BPS), bisphenol F (BPF), and bisphenol AF (BPAF). Similarly, BPA analogues have attracted considerable attention due to their exposure to humans exposure and their estrogen-like effects. BPF and BPS can exhibit estrogenic and antiandrogenic activities, which are similar to those of BPA[21]. The findings of epidemiological studies have shown associations between human exposure to BPA analogues and adverse health outcomes (e.g., endocrine disrupting effects, cytotoxicity, genotoxicity, reproductive toxicity, and neurotoxicity)[3].
TBBPA is the most commonly used brominated flame retardant (BFR), representing about 60% of the total BFR market[22]. TBBPA alternatives, such as tetrabromobisphenol S (TBBPS) and tetrachlorobisphenol A (TCBPA), are also widely applied in various consumer products. They have been found in air, dust, soil, water, sediment, and sewage sludge[23]. The findings of several studies have shown that the main toxic effect of TBBPA is disruption to thyroid balance[24]. The results of one study indicated that TBBPA, TBBPS, and TCBPA could also disrupt hepatic differentiation, and TCBPA exhibited stronger potential developmental hepatic toxicity than TBBPA and TBBPS[25]. Currently, the production and use of TBBPA, TBBPS, and TCBPA are still permitted worldwide, despite their potential toxicity.
PAEs, the esters of 1,2-benzenedicarboxylic acid, are extensively used as plasticizers in the plastic industry[5]. They are also used in cosmetics, pharmaceuticals, and printing inks[26]. Human exposure to PAEs has been linked to adverse health outcomes, as di-2-ethylhexyl phthalate (DEHP) causes reproductive and developmental toxicities, especially in men[27]. This has prompted the establishment of regulations for PAEs by the United States Environmental Protection Agency (EPA)[28].
The Yangkou Chemical Industrial Park is located in Jiangsu Province, specifically in the northeast Yangtze River Delta. The chemical park contains more than 100 industries in which various chemical products are mainly produced, such as pharmaceuticals, materials, daily necessities, and plastic products. This activity creates emissions of a large number of organic pollutants (e.g., EDCs) around the Yangkou Chemical Industrial Park, leading to ubiquitous environmental contamination and human exposure. To date, regulations regarding the discharge of chemical waste in wastewater or waste gas by the government of China mainly focus on heavy metals (e.g., lead, cadmium, mercury, arsenic, etc.), nitrobenzene, aniline, N,N-dimethylformamide, volatile organic compounds, and among others. However, relatively few regulations exist regarding endocrine-disrupting chemicals. In the national standard of “Emission standard of pollutants for synthetic resin industry” (GB 31572-2015), the discharge threshold of BPA in wastewater for epoxy resin, polycarbonate resin, and polysulfone resin industries is 0.1 mg/L. Two phthalates, di-n-butyl phthalate (DBP) and di-n-octyl phthalate (DNOP), have been identified as common organic pollutants in waste gas in the synthetic leather industry (GB 21902-2008). The findings of a previous study showed high levels of BPA (5450 μg kg-1 dw) and TBBPA (1350 μg kg-1 dw) in sediment in Shouguang, Shandong, China, where various BFR factories are located[29]. High BPA concentrations have also been found in soil surrounding electronic waste recycling areas in Longtang, Guangdong, South China, with a maximum value of 325 μg kg-1 dw[30]. Additionally, people living or working in chemical parks may encounter higher health risks due to long-term exposure to high concentrations of chemicals. The human exposure routes to EDCs are multiple. Although the primary route of human exposure to EDCs has been shown to be the dietary pathway, non-dietary sources, such as soil, need to be more thoroughly identified. Therefore, human health concerns should be raised regarding these chemicals in chemical parks.
In this study, we focused on the Yangkou Chemical Industrial Park, and surface soil, sediment, and sludge samples from this area were analyzed to detect the levels of TCS, TCC, parabens, BPAs, TBBPAs, and PAEs. The composition profiles and distributions were discussed in order to better understand their source and fate in the environment. The non-carcinogenic risks of these chemicals were also evaluated. Mass inventories for EDCs were further estimated. This may provide new insight into the environmental behaviors and health risks related to EDCs in chemical parks.
EXPERIMENTAL SECTION
Sample collection
A total of 20 soil samples (S1-S20) were collected in the Yangkou Chemical Industrial Park. In order to compare the concentrations of pollutants outside and inside the park, three soil samples outside the chemical park were also collected. The sampling sites outside the chemical park were determined based on the distance (~5 km) and prevailing wind direction (southeast wind). The sampling sites of S1 and S8 selected are approximately 5 km away from the chemical park, and S6 is approximately 2.5 km away due to the site near the sea. These three sampling sites are residential areas with no chemical plants nearby. S6 and S8 are located in downwind and upwind directions, respectively. Surface soil samples (0-20 cm deep) were collected with a stainless steel auger. At each site, a diagonal 5-point sampling method was used to collect the surface soil samples, and then the 5 sub-samples were mixed to obtain a single sample. Each sample was wrapped in aluminum foil and transferred to the laboratory. They were freeze-dried, ground, sieved using a stainless steel sieve with a mesh size of 250 μm, and then stored at -20 ℃ until further analysis. Each soil sample from the sampling location and surrounding area was classified as soil from a wastewater treatment plant (WWTP Soil), soil along a canal (Canal Soil), or soil from a roadside (Road Soil)[31]. Three sediment samples (S21-S23) from the surrounding area and a sludge sample from the wastewater treatment plant (WWTP) were collected in the chemical park. The sampling of sediment sites in the chemical park was mainly according to the prevailing wind direction. S21 and S22 are located in downwind and upwind directions, respectively. Referring to the national standard of China (GB 18918-2002), we collected one sludge sample every two hours, and, finally, five sludge samples were collected. The five sludge samples were mixed to obtain a sludge sample with a weight of more than 1 kg. Further details and a map showing the sampling locations are provided in Supplementary Table 1 and Supplementary Figure 1.
Standards and chemicals
In this study, 28 target chemicals were analyzed. Six standards of parabens, including methyl paraben (MeP), ethyl paraben (EtP), propyl paraben (PrP), butyl paraben (BuP), heptyl paraben (HepP), and benzyl paraben (BzP) were purchased from AccuStandard Inc. (New Heaven, CT, USA). Seven BPA standards and three TBBPA standards, including BPA, BPS, BPF, BPAF, 4,4'-(1-phenylethylidene)bisphenol (BPAP),
Sample preparation
The extraction and purification of the target compounds in the soil, sediment, or sludge samples were performed using similar methods to those used in our previous studies[32,33]. For TCS, TCC, parabens, BPAs, and TBBPAs, each sample (~0.1 g, dry weight) was extracted in a 15 mL glass tube. Prior to extraction, mass-labeled standards (MeP-d4, PrP-d4, HepP-d4, BzP-d4, TCS-d3, TCC-d4, BPA-d16, BPAF-d4, and TBBPA-d10, 50 ng each) were added to each sample. A total of 5 mL of a mixed solution of MeOH and ACN (v:v, 1:1) was added to the sample. The mixture was shaken using an orbital shaker (250 r/min; IKA HS 501 digital horizontal shaker, Janke & Kunkel & Co IKA Labortechnik, Staufen, Germany) for 60 min, and centrifuged at 1811 g for 10 min. The supernatant was transferred to another clean glass tube. This extraction process was repeated two more times. The combined extracts were concentrated to approximately 1 mL under nitrogen and reconstituted to 10 mL with the solution containing ultrapure water (99.8%) and formic acid (0.2%). The extract was passed through a solid phase extraction cartridge (Oasis MCX, 60 mg/3 cc, Waters, Milford, MA, USA), which was preconditioned with 6 mL of MeOH and 6 mL of ultrapure water. After the extract was loaded, the cartridge was washed with 15 mL of 30% methanol in ultrapure water (which contained 0.2% formic acid). The residual water in the cartridge was removed under vacuum for 10 min. The target compounds were eluted with 6 mL of MeOH. The elute was concentrated to 1 mL and kept at -20 ℃ prior to UPLC-MS/MS analysis.
For PAEs, each sample (~0.1 g, dry weight) was spiked with 50 ng of surrogate standard (DMP-d4, DBP-d4, and DEHP-d4), and then extracted twice with a 7 mL solution [a mixture of hexane and dichloromethane (v/v, 1:1)] via oscillation extraction (300 r/min) for 60 min, followed by centrifugation at 1811 g for 10 min. The extracted solution was allowed to evaporate under nitrogen to approximately 1 mL and filtered by a 0.22 μm polytetrafluoroethylene (PTFE) membrane filter. Finally, 20 ng of BzBP-d4 was added to the sample prior to GC-MS/MS analysis.
Chemical analysis
For the analysis of TCC, TCS, parabens, BPAs, and TBBPAs, we used a method similar to that used in our previous study[34]. An Exion LC AD Series UPLC system with an API 5500 triple-quadrupole MS/MS system (AB Sciex, Framingham, MA, USA) was used for the quantification of these EDCs. Target analytes were detected using multiple reaction monitoring (MRM). Electrospray ionization (ESI) was operated in the negative mode. Chromatographic separation was carried out using an analytical column (BEH C18,
For PAE analysis, we used a method similar to that used in our previous study[35]. Briefly, target PAEs were determined using a Thermo Scientific TRACE 1300 Series gas chromatograph equipped with a Thermo Scientific TSQ 8000 Evo triple quadrupole mass spectrometer (GC-MS/MS; Thermo Fisher Scientific, San Jose, CA, USA). For separation, a capillary column (TG-5MS, 30 m × 0.25 mm × 0.25 μm; Thermo Fisher Scientific) was used. The selective ion-monitoring (SIM) mode was also adopted. Detailed protocols for the instrumental analysis and optimized parameters of the target analytes are described in
Quality assurance and quality control (QA/QC)
Information regarding QA/QC is described and presented in detail in Supplementary Table 4. The limits of detection (LODs) and quantitation (LOQs) of the target EDCs were 0.0001-0.735 μg kg-1 and
Health risk assessment
The carcinogenic properties of chemicals of interest were estimated using the ADMETlab software[36]. The results showed that among the 28 target chemicals, nine substances, including TCS, TCC, BzP, BPF, BPS, BPAP, BPAF, BzBP, and DEHP, are carcinogenic, and the rest are non-carcinogenic compounds related to human health. The non-dietary pathways for human exposure to EDCs through soil are soil ingestion, inhalation, and dermal contact[37]. The non-carcinogenic risks of EDCs were estimated according to the method recommended by the United States EPA[38], which is as follows:
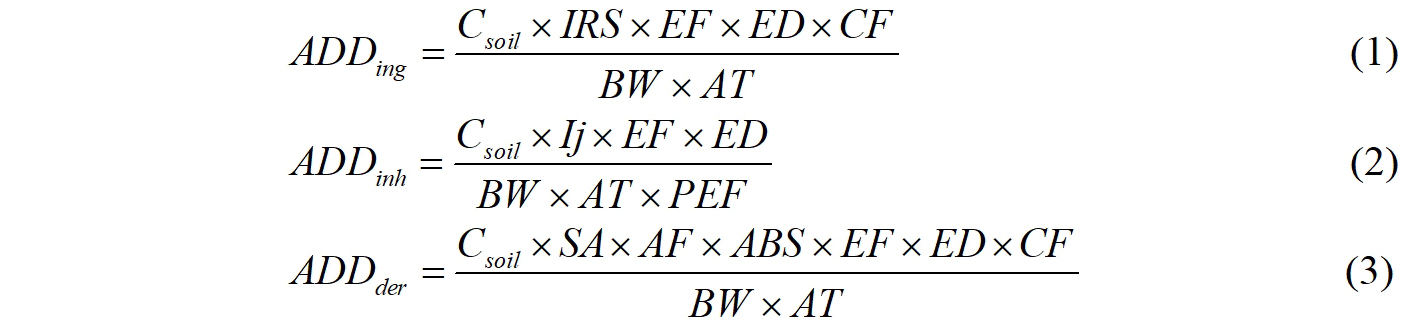
where ADD is the average daily dose, μg kg-1 day-1; Csoil is the concentrations of EDCs in soil, μg kg-1; IRS is the soil ingestion rate, mg day-1; EF is the exposure frequency, days year-1; ED is the exposure duration, year; CF is the unit conversion factor, 10-6 kg mg-1; BW is the body weight, kg; AT is the average time, days; Ij is the respiratory rate, m3 day-1; PEF is the particulate emission factor, m3 g-1; SA is the dermal exposure area, cm2; AF is the soil adherence factor, mg cm-2 day-1; and ABS is the dermal adsorption fraction, unitless. All of the associated parameters used in these models for adults were based on a previous work[39], as shown in Supplementary Table 5.

where HQ is the hazard quotient for a certain contaminant; HI is the hazard index for multiple contaminants; RfD is defined as the daily maximum permissible level of contaminants. Humans are considered to suffer from non-carcinogenic risks if the value of HI > 1 or HQ > 1.
Statistical analysis
Origin 2022b (Origin Lab, USA) and SPSS Statistics 20.0 (IBM Corp., USA) were utilized for graphing and data analysis. The LOQ divided by √2 (LOQ/√2) was used if the data regarding the target chemicals were below the LOQ.
RESULTS AND DISCUSSION
Concentrations, profiles and distributions of EDCs
Table 1 presents a summary of the EDC data in the soil, sediment, and sludge samples. The detection rates of TCS and TCC in all the samples were 100%. The results show that TCS and TCC are widespread in the environment. The GM concentrations of Σ(TCS + TCC) in the soil, sediment, and sludge samples were 146 (range: 127-186) μg kg-1 dw, 159 (118-211) μg kg-1 dw, and 3070 μg kg-1 dw, respectively. It was found that the concentration of Σ(TCS + TCC) in the sludge sample was approximately 20 times higher than those in the soil and sediment samples. As shown in Figure 1, the composition profiles of TCS and TCC in soil were similar to that in sludge, in which TCS was the most dominant congener (> 96%). However, elevated contributions of TCC were found in sediment samples, in which it accounted for 16.6% of the total concentration, which is in contrast to the contributions of TCC found in sediment in the East China Sea[40]. Higher concentrations of TCC in sediment were found at S22 and S23 (21.1 and 58.5 μg kg-1 dw, respectively) than at S21 (1.61 μg kg-1 dw). According to the sampling information

Figure 1. Composition profiles of EDCs in soil, sediment, and sludge samples.
Concentrations (μg kg-1 dw) of several EDCs in soil, sediment, and sludge samples
| Soil (n = 20) | Sediment (n = 3) | Sludge (n = 1) | |||||||
| DRa | Minb | GMc | Maxd | DR | Min | GM | Max | ||
| TCS | 100 | 126 | 144 | 183 | 100 | 117 | 136 | 152 | 2950 |
| TCC | 100 | 0.878 | 1.56 | 3.02 | 100 | 1.61 | 12.6 | 58.8 | 124 |
| Σ(TCS + TCC) | 127 | 146 | 186 | 118 | 159 | 211 | 3070 | ||
| MeP | 100 | 10.1 | 18.3 | 27.5 | 100 | 15.5 | 20.4 | 23.9 | 107 |
| EtP | 95.0 | < LOQe | 0.623 | 8.14 | 100 | 0.578 | 0.714 | 0.986 | 0.722 |
| PrP | 100 | 2.28 | 4.91 | 9.04 | 100 | 3.84 | 5.75 | 8.36 | 6.10 |
| BuP | 100 | 0.390 | 0.610 | 1.21 | 100 | 0.784 | 0.887 | 1.08 | 0.540 |
| HepP | 100 | 0.122 | 0.176 | 0.306 | 100 | 0.167 | 0.182 | 0.212 | < LOQ |
| BzP | 100 | 0.476 | 0.555 | 0.623 | 100 | 0.483 | 0.843 | 2.32 | 6.47 |
| Σ6parabens | 17.5 | 26.0 | 39.9 | 23.6 | 29.4 | 35.1 | 121 | ||
| BPF | 100 | 2.43 | 6.42 | 12.7 | 100 | 7.93 | 15.5 | 34.9 | 20.2 |
| BPA | 100 | 15.8 | 25.1 | 46.9 | 100 | 35.4 | 104 | 233 | 328 |
| BPB | 0 | < LOQ | 1.73 | < LOQ | 0 | < LOQ | < LOQ | < LOQ | < LOQ |
| BPS | 100 | 1.22 | 1.57 | 3.10 | 100 | 2.11 | 13.8 | 80.1 | 3.77 |
| BPZ | 0 | < LOQ | 0.323 | < LOQ | 0 | < LOQ | < LOQ | < LOQ | < LOQ |
| BPAP | 5.00 | < LOQ | 0.337 | 0.956 | 0 | < LOQ | < LOQ | < LOQ | 14.3 |
| BPAF | 100 | 0.351 | 0.689 | 1.05 | 100 | 0.685 | 0.751 | 0.892 | 2.99 |
| BPP | 20.0 | < LOQ | 0.274 | 10.8 | 0 | < LOQ | < LOQ | < LOQ | < LOQ |
| Σ8BPAs | 23.7 | 38.1 | 60.9 | 54.5 | 153 | 259 | 372 | ||
| TCBPA | 75.0 | < LOQ | 0.931 | 2.02 | 100 | 1.42 | 1.92 | 2.46 | 709 |
| TBBPA | 90.0 | < LOQ | 3.15 | 150 | 100 | 1.10 | 6.89 | 70.8 | < LOQ |
| TBBPS | 30.0 | < LOQ | 1.06 | 2.69 | 66.7 | < LOQ | 1.97 | 3.47 | < LOQ |
| Σ3TBBPAs | < LOQ | 5.94 | 154 | 5.99 | 15.9 | 74.0 | 710 | ||
| DMP | 100 | 3.73 | 7.68 | 19.5 | 100 | 5.29 | 6.24 | 7.11 | 10.3 |
| DEP | 100 | 1.81 | 2.96 | 4.97 | 100 | 2.32 | 3.02 | 3.69 | 4.40 |
| DIBP | 100 | 6.99 | 16.6 | 39.2 | 100 | 3.53 | 15.1 | 37.4 | 56.2 |
| DBP | 100 | 39.7 | 67.4 | 100 | 100 | 32.6 | 58.0 | 100 | 207 |
| DNHP | 84.2 | < LOQ | 0.0283 | 0.567 | 66.7 | < LOQ | 0.0070 | 0.064 | < LOQ |
| BzBP | 89.5 | < LOQ | 0.121 | 0.508 | 100 | 0.0987 | 0.241 | 0.408 | 0.729 |
| DCHP | 31.6 | < LOQ | 0.0199 | 0.0461 | 0 | < LOQ | < LOQ | < LOQ | < LOQ |
| DEHP | 100 | 132 | 214 | 518 | 100 | 126 | 792 | 6400 | 1790 |
| DNOP | 47.4 | < LOQ | 0.234 | 1.64 | 0 | < LOQ | < LOQ | < LOQ | 46.6 |
| Σ9PAEs | 196 | 314 | 661 | 170 | 925 | 6550 | 2120 | ||
The concentrations of Σ6parabens in soil samples ranged from 17.5 to 39.9 μg kg-1 dw, with a GM concentration of 26.0 μg kg-1 dw. The concentrations of Σ6parabens in sediment samples were
The detection frequencies of BPF, BPA, BPS, and BPAF were 100% in all of the samples. BPB and BPZ were not detected in any of the samples. The predominant bisphenol detected in the samples was BPA (71.4%, 72.0%, and 88.8%), which demonstrated a GM concentration of 25.1, 104, and 328 μg kg-1 dw in the soil, sediment, and sludge samples, respectively. The concentrations of Σ8BPAs in soils and sediments ranged from 23.7 to 60.9 μg kg-1 dw with an average of 38.1 μg kg-1 dw and from 54.5 to 259 μg kg-1 dw with an average of 153 μg kg-1 dw, respectively. The concentration of Σ8BPAs in the sludge sample was
TBBPS and TBBPA were not detected in the sludge samples. The total concentrations (Σ3TBBPAs) in the soil samples ranged from < LOQ to 154 μg kg-1 dw, with a GM value of 5.94 μg kg-1 dw. The concentrations of Σ3TBBPAs in the sediment samples ranged from 5.99 to 74.0 μg kg-1 dw with a GM value of
Among nine PAEs, DMP, DEP, DIBP, DBP, and DEHP were detected in 100% of the samples. This implies that PAEs were ubiquitous contaminants in the chemical park. The concentrations of Σ9PAEs varied by the environmental matrices, and the highest GM concentrations of Σ9PAEs were obtained in the sludge samples (GM: 2120 μg kg-1 dw), followed by (in decreasing order) the sediment samples (925 μg kg-1 dw) and soil samples (314 μg kg-1 dw). The composition profiles of PAEs in the soil, sediment, and sludge samples were similar. DEHP was the most abundant analogue in soil (68.8%), followed by DBP (21.6%) and DIBP (5.86%). Consistent with the profiles in the soil samples, DEHP, DBP, and DIBP were found to be the most dominant PAE congeners in the sediment and sludge samples; their aggregate accounted for 99.6% and 97.1% of the total PAEs, respectively. Similar results regarding the composition profiles of PAEs in soil and sediment have been reported in various previous studies[32,44]. In addition, an elevated contribution of DNOP of 2.20% was found in sludge, which is consistent with findings that confirmed the presence of DNOP in sludge in Taiwan[45]. No obvious differences were found regarding the PAE concentrations among the soil samples. The concentrations of PAEs in soils were found higher outside (467 μg kg-1 dw) than inside the chemical park (303 μg kg-1 dw) [Supplementary Table 6]. A previous study has determined concentrations of chlorinated paraffins in the same region, and the highest concentration was found in soil near the Bingcha Canal outside the chemical park[31]. The elevated levels of PAE in the soil outside the chemical park may be affected by human activities, such as the discharge of household waste.
In this study, the samples of sludge and sediment were mainly collected in the chemical park. The measured concentrations may reflect the pollution status of several typical EDCs in the park to some extent. However, due to the relatively small sample size, the production capacity of EDCs in chemical plants cannot be accurately assumed. More sludge or sediment samples should be supplemented for clarification in further study.
Comparison of target analyte concentrations
TCS, MeP, BPA, TBBPA, and DEHP are compounds that were found to have relatively higher concentrations and detection rates in this study, and they were selected for comparison. Their concentrations (GM/mean, median, and range) found in soil, sediment and sludge samples in other regions are listed in Table 2.
Concentrations (μg kg-1 dw) of TCS, MeP, BPA, TBBPA, and DEHP in soil, sediment and sludge in other regions.
| Compounds | Sample information | Location | Sample number | GMa/Mean | Median | Range | References |
| TCS | soil | Andalusia, Spain | 2 | 0.289/0.290 | 0.290 | 0.270-0.310 | [46] |
| soil | Michigan, USA | 5 | 0.068/0.155 | 0.025 | ndb-0.52 | [47] | |
| soil | Jiangsu, China, a chemical park | 20 | 144/145 | - | 126-183 | This study | |
| sediment | Andalusia, Spain | 4 | 0.090/0.104 | 0.098 | 0.049-0.170 | [46] | |
| sediment | East China Sea | 28 | -/nd | nd | nd-0.700 | [40] | |
| sediment | Jiangsu, China, a chemical park | 3 | 136/136 | - | 117-152 | This study | |
| sludge | nationwide China | 100 | -/1090 | 770 | nd-4870 | [48] | |
| sludge | 22 provinces in China | 46 | 1280/1660 | 1680 | 107-3890 | [34] | |
| sludge | Changsha, Hunan, China | - | -/199 | 200 | 154-275 | [49] | |
| sludge | Jiangsu, China, a chemical park | 1 | 2950 | - | - | This study | |
| MeP | soil | Spain | 12 | - | - | nd-8.04 | [50] |
| soil | Jiangsu, China, a chemical park | 20 | 18.3/19.0 | - | 10.1-27.5 | This study | |
| sediment | the Yellow River | 74 | -/13.0 | 12.4 | 7.07-27.6 | [51] | |
| sediment | the Huai River | 48 | -/11.6 | 12.0 | 6.97-18.8 | [51] | |
| surface sediment | the Bohai Sea and Yellow Sea | 48 | 1.99/- | 1.97 | 0.962-5.82 | [52] | |
| sediment | Jiangsu, China, a chemical park | 3 | 20.4/20.8 | - | 15.5-23.9 | This study | |
| sludge | nationwide China | 100 | -/66 | 46 | nd-630 | [48] | |
| sludge | 22 provinces in China | 46 | 49.0/59.4 | 48.8 | 8.51-263 | [34] | |
| sludge | Changsha, Hunan, China | - | -/38.6 | 34.2 | 21.6-66.9 | [49] | |
| sludge | Jiangsu, China, a chemical park | 1 | 107 | - | - | This study | |
| BPA | soil | Longtang, Guangdong, South China, a typical electronic waste recycling center | 70 | - | - | 0.50-325 | [30] |
| soil | Shouguang, Shandong, China | 15 | -/4.61 | - | 0.185-18.7 | [29] | |
| soil | Jiangsu, China, a chemical park | 20 | 25.1/26.2 | - | 15.8-46.9 | This study | |
| sediment | Shouguang, Shandong, China | 15 | -/521 | - | 1.03-5450 | [29] | |
| sediment | East China Sea | 28 | -/13.0 | 14.0 | 2.20-34.0 | [40] | |
| sediment | Jiangsu, China, a chemical park | 3 | 104/134 | - | 35.4-233 | This study | |
| sludge | 30 cities in China | 52 | 4.69/- | 9.36 | nd-152 | [43] | |
| sludge | Dalian, China | 1 | 63.6 | - | - | [53] | |
| sludge | 22 provinces in China | 46 | 85.5/172 | 76.9 | 16.7-1210 | [34] | |
| sludge | Jiangsu, China, a chemical park | 1 | 328 | - | - | This study | |
| TBBPA | soil | Ningbo, China | 90 | - | 9.17 | nd-78.6 | [55] |
| soil | Longtang, Guangdong, China, a typical electronic waste recycling center | 70 | - | - | nd-220 | [30] | |
| soil | Qingyuan, Guangdong, China, e-waste dismantling areas | 14 | -/296 | - | 84‒646 | [54] | |
| paddy soils | Liaohe River Basin, China | 17 | - | - | 0.03-4.06 | [58] | |
| soil | Chongqing, China | 81 | -/2.38 | - | nd-33.8 | [56] | |
| soil | Shouguang, Shandong, China | 15 | -/17.9 | - | 0.263-83.7 | [29] | |
| soil | nationwide South Korea | 61 | -/4.4 | - | nd-110 | [57] | |
| soil | Jiangsu, China, a chemical park | 20 | 3.15/11.7 | - | nd-150 | This study | |
| sediment | Qingyuan, Guangdong, China, e-waste dismantling areas | 14 | -/384 | - | 24.7-914 | [54] | |
| sediment | Liaohe River Basin, China | 17 | -/0.59 | - | 0.04-3.00 | [58] | |
| sediment | Shouguang, Shandong, China | 15 | -/261 | 2.08-1350 | [29] | ||
| sediment | East China Sea | 28 | -/nd | nd | nd-0.270 | [40] | |
| sediment | Jiangsu, China, a chemical park | 3 | 6.89/25.4 | - | 1.10-70.8 | This study | |
| sludge | Catalonia, Spain | 17 | -/104 | 96.7 | nd-472 | [59] | |
| sludge | 30 cities in China | 52 | 20.5/- | 24.7 | nd-259 | [43] | |
| sludge | Jiangsu, China, a chemical park | 1 | nd | - | - | This study | |
| DEHP | soil | Nanjing, Jiangsu, China | 61 | 968/983 | 954 | 570-1350 | [60] |
| soil | Yangtze River Delta | 241 | -/546 | 349 | nd-9190 | [61] | |
| soil | Yangtze River Delta | 32 | -/217 | 117 | 29.1-1170 | [32] | |
| soil | Jiangsu, China, a chemical park | 20 | 214/227 | - | 132-518 | This study | |
| sediment | the East China Sea | 19 | 2070/4350 | 3220 | 419-22,160 | [44] | |
| sediment | Hangzhou Bay | 30 | - | - | 0.310-2410 | [62] | |
| sediment | Yangtze River Delta | 32 | -/1000 | 241 | 5.51-15,800 | [32] | |
| sediment | Jiangsu, China, a chemical park | 3 | 792/2380 | - | 126-6400 | This study | |
| sludge | 22 provinces in China | 46 | -/14.7 | 10.0 | 0.326-67.8 | [63] | |
| sludge | western Taiwan | 17 | 5880/8000 | 6470 | 1330-22600 | [45] | |
| sludge | Jiangsu, China, a chemical park | 1 | 1790 | - | - | This study |
The GM concentration of TCS in soils in the chemical park (144 μg kg-1 dw) was three orders of magnitude higher than the concentrations reported in Andalusia, Spain (0.289 μg kg-1 dw)[46] and Michigan, USA
The MeP concentrations (range: 10.1-27.5 μg kg-1 dw) in soil samples in this study were slightly higher than those previously reported in Spain (nd-8.04 μg kg-1 dw)[50]. The GM concentration of MeP in sediment
The concentrations of BPA in soils (range: 15.8-46.9 μg kg-1 dw) were comparable to those reported in Longtang, Guangdong (0.50-325 μg kg-1 dw)[30] and Shouguang, Shandong (0.185-18.7 μg kg-1 dw)[29]. Higher BPA concentrations have been reported to be present in sediments from Shouguang, Shandong at levels of up to 5450 μg kg-1 dw[29]. In this study, the BPA concentrations in sediments (range: 35.4-233 μg kg-1 dw) were about 10-fold higher than the values in sediments from the East China Sea (2.20-34.0 μg kg-1 dw)[40]. In this study, the BPA concentration in sludge (328 μg kg-1 dw) was 70, 5, and 4 times higher than those from 30 cities in China (4.69 μg kg-1 dw)[43], Dalian, China (63.6 μg kg-1 dw)[53], 22 provinces, China
The TBBPA levels in soils in this study (nd-150 μg kg-1 dw) were obviously lower than that reported in Qingyuan, Guangdong (84-646 μg kg-1 dw)[54]; comparable to those reported in Ningbo, China
The concentrations of DEHP in soils ranged from 132 to 518 μg kg-1 dw with a mean value of 227 μg kg-1 dw, which were similar to the concentration in soils from the Yangtze River Delta (mean: 217,
Non-carcinogenic risk assessment of EDCs
Humans are exposed to ubiquitous EDCs every day. It is crucial to assess the potential risk of EDCs around the Yangkou Chemical Industrial Park for local residents. In this study, the non-carcinogenic risks of EDCs were estimated based on measured concentrations of EDCs in soil. The results of the risk assessment are shown in Table 3.
Average daily dose (ADD, μg kg-1 day-1) of EDCs through soil ingestion, inhalation and dermal contact for workers.
| ADDinga | ADDinhb | ADDderc | ADDsoil (ing + inh + der)d | |
| TCS | 1.97E-04 | 1.96E-08 | 7.87E-05 | 2.76E-04 |
| TCC | 2.14E-06 | 2.12E-10 | 8.53E-07 | 2.99E-06 |
| Σ(TCS + TCC) | 1.99E-04 | 1.98E-08 | 7.96E-05 | 2.79E-04 |
| MeP | 2.50E-05 | 2.49E-09 | 9.99E-06 | 3.50E-05 |
| EtP | 8.53E-07 | 8.47E-11 | 3.40E-07 | 1.19E-06 |
| PrP | 6.73E-06 | 6.68E-10 | 2.68E-06 | 9.41E-06 |
| BuP | 8.35E-07 | 8.29E-11 | 3.33E-07 | 1.17E-06 |
| HepP | 2.41E-07 | 2.39E-11 | 9.63E-08 | 3.38E-07 |
| BzP | 7.61E-07 | 7.55E-11 | 3.04E-07 | 1.06E-06 |
| Σ6parabens | 3.57E-05 | 3.54E-09 | 1.42E-05 | 4.99E-05 |
| BPF | 8.80E-06 | 8.73E-10 | 3.51E-06 | 1.23E-05 |
| BPA | 3.44E-05 | 3.41E-09 | 1.37E-05 | 4.81E-05 |
| BPB | 2.37E-06 | 2.36E-10 | 9.47E-07 | 3.32E-06 |
| BPS | 2.15E-06 | 2.13E-10 | 8.57E-07 | 3.01E-06 |
| BPZ | 4.42E-07 | 4.39E-11 | 1.76E-07 | 6.19E-07 |
| BPAP | 4.62E-07 | 4.59E-11 | 1.84E-07 | 6.46E-07 |
| BPAF | 9.44E-07 | 9.37E-11 | 3.77E-07 | 1.32E-06 |
| BPP | 3.76E-07 | 3.73E-11 | 1.50E-07 | 5.26E-07 |
| Σ8BPAs | 5.23E-05 | 5.19E-09 | 2.08E-05 | 7.31E-05 |
| TCBPA | 1.28E-06 | 1.27E-10 | 5.09E-07 | 1.78E-06 |
| TBBPA | 4.32E-06 | 4.29E-10 | 1.72E-06 | 6.04E-06 |
| TBBPS | 1.45E-06 | 1.44E-10 | 5.78E-07 | 2.03E-06 |
| Σ3TBBPAs | 8.13E-06 | 8.07E-10 | 3.24E-06 | 1.14E-05 |
| DMP | 1.05E-05 | 1.04E-09 | 4.20E-06 | 1.47E-05 |
| DEP | 4.05E-06 | 4.02E-10 | 1.62E-06 | 5.67E-06 |
| DIBP | 2.27E-05 | 2.26E-09 | 9.07E-06 | 3.18E-05 |
| DBP | 9.24E-05 | 9.17E-09 | 3.69E-05 | 1.29E-04 |
| DNHP | 3.88E-08 | 3.85E-12 | 1.55E-08 | 5.43E-08 |
| BzBP | 1.66E-07 | 1.65E-11 | 6.64E-08 | 2.33E-07 |
| DCHP | 2.73E-08 | 2.71E-12 | 1.09E-08 | 3.82E-08 |
| DEHP | 2.93E-04 | 2.91E-08 | 1.17E-04 | 4.10E-04 |
| DNOP | 3.20E-07 | 3.18E-11 | 1.28E-07 | 4.48E-07 |
| Σ9PAEs | 4.30E-04 | 4.27E-08 | 1.72E-04 | 6.02E-04 |
In general, the value of the non-carcinogenic risk of total EDC intake from soil was as follows: soil ingestion > dermal contact > inhalation. The total daily doses of EDCs for adults through soil inhalation were
The GM values of non-carcinogenic exposure to EDCs for adults were (from high to low):
The HQ and HI results summarized in this study are shown in Figure 2. Among the 28 EDCs, DEHP had the highest HQ, ranging from 1.27E-05 to 4.97E-05. Regarding parabens, MeP was the predominant compound, followed by PrP. However, the risk of PrP (9.97E-08) was higher than that of MeP + EtP (3.84E-09), which was attributed to the relatively high toxicity of PrP. Among the BPA analogues, BPA, BPF, and BPS were the main analogues. Similarly, the risks of BPA analogues were also related to their toxicities. Their risks were as follows: BPA > BPS > BPF. For all the samples, the non-carcinogenic risks from soil were far less than the recommended allowable level (HQs< 1, HIs< 1), indicating that the chemical park posed a low threat to the exposed population.

Figure 2. Hazard indexes of EDCs.
There are several uncertainties that may have affected the results of the risk assessment[71]. We lacked RfD values for several EDCs, such as TCC, BuP, BPAF, and DIBP. These chemicals were not included in the HQ calculations, which would have led to an underestimation of the health risks. Furthermore, ADD calculations reflected the daily intake rather than the risk of long-term exposure. Finally, interactions between multiple pollutants were not considered in this study, and simply adding up the risks of each compound may have increased the uncertainty.
Preliminary estimation of mass inventory for EDCs
The concentrations of EDCs in soil can reflect their burden in the Yangkou Chemical Industrial Park. To assess the impact of EDCs in the Yangkou Chemical Industrial Park, the mass inventories (I, kg) of EDCs were calculated, as shown in Eq. (6)[72]:

where Ci (μg kg-1 dw) is the mean concentration of EDCs in soils for the sampling area; Ai is the land area (km2), d is the thickness of the sampled soil (cm); ρ is the average density of dry soil particles (g cm-3); and k is the unit conversion factor. The area of the Yangkou Chemical Industrial Park is 11.6 km2, with a soil depth of 20 cm, and the soil density was assumed to be 1.5 g cm-3.
The mass inventories of Σ(TCS + TCC), Σ6parabens, Σ8BPAs, Σ3TBBPAs, and Σ9PAEs were estimated to be 507, 90.6, 133, 20.7, and 1090 kg, respectively. In this study, the total mass inventory of Σ28EDCs was 1840 kg, which was lower than that for Σ10PBDEs (8870 kg) in three districts from the Pearl River Delta[72]. The total soil area of the Yangkou Chemical Industrial Park is only a tiny fraction of the total land area in the Yangtze River Delta, which implies that the potential inventory will be much larger than the estimated inventory.
Conclusions
The occurrence, composition profile, and distribution of 28 EDCs in soil, sediment, and sludge from the Yangkou Chemical Industrial Park were investigated. The distribution showed that the higher level of
DECLARATIONS
Authors’ contributionsConceptualization, methodology, sampling, sample analysis, and writing - original draft: Zhu Q
Data analysis: Fang M
Scientific drawing: Wang X
Writing - review & editing, supervision, and funding acquisition: Liao C
Resources and supervision: Jiang G
All authors contributed extensively to conducting the experiments and revising the paper.
Availability of data and materialsExtra data is published in the Supplementary Materials.
Financial support and sponsorshipThis study was financially supported by the National Key Research and Development Program of China (2020YFA0907500 and 2019YFC1604802), the National Natural Science Foundation of China (22193051 and 22225605), and the K.C. Wong Education Foundation of China (GJTD-2020-03).
Conflicts of interestAll authors declared that there are no conflicts of interest.
Ethical approval and consent to participateNot applicable.
Consent for publicationNot applicable.
Copyright© The Author(s) 2023.
Supplementary MaterialsREFERENCES
1. Dodge LE, Choi JW, Kelley KE, Herńandez-D Iaz S, Hauser R. Medications as a potential source of exposure to parabens in the United States population. Environ Res 2018;164:580-4.
2. Halden RU, Paull DH. Co-occurrence of triclocarban and triclosan in United States water resources. Environ Sci Technol 2005;39:1420-6.
3. Chen D, Kannan K, Tan H, et al. Bisphenol Analogues other than BPA: Environmental occurrence, human exposure, and toxicity-a review. Environ Sci Technol 2016;50:5438-53.
4. Malkoske T, Tang Y, Xu W, Yu S, Wang H. A review of the environmental distribution, fate, and control of tetrabromobisphenol A released from sources. Sci Total Environ 2016;569-570:1608-17.
5. González-toledo E, Compañó R, Granados M, Dolors Prat M. Detection techniques in speciation analysis of organotin compounds by liquid chromatography. Trend Anal Chem 2003;22:26-33.
6. Liao C, Kannan K. A survey of alkylphenols, bisphenols, and triclosan in personal care products from China and the United States. Arch Environ Contam Toxicol 2014;67:50-9.
7. Huang H, Du G, Zhang W, et al. The
8. Jung EM, An BS, Choi KC, Jeung EB. Potential estrogenic activity of triclosan in the uterus of immature rats and rat pituitary GH3 cells. Toxicol Lett 2012;208:142-8.
9. Dann AB, Hontela A. Triclosan: environmental exposure, toxicity and mechanisms of action. J Appl Toxicol 2011;31:285-311.
10. Halden RU, Lindeman AE, Aiello AE, et al. The florence statement on triclosan and triclocarban. Environ Health Perspect 2017;125:064501.
11. Giulivo M, Lopez de Alda M, Capri E, Barceló D. Human exposure to endocrine disrupting compounds: Their role in reproductive systems, metabolic syndrome and breast cancer. A review. Environ Res 2016;151:251-64.
12. Wang W, Kannan K. Fate of parabens and their metabolites in two wastewater treatment plants in New York State, United States. Environ Sci Technol 2016;50:1174-81.
13. Zhang L, Dong L, Ding S, et al. Effects of n-butylparaben on steroidogenesis and spermatogenesis through changed E₂ levels in male rat offspring. Environ Toxicol Pharmacol 2014;37:705-17.
14. SCCS. Clarification on Opinion SCCS/1348/10 in the light of the Danish clause of safeguard banning the use of parabens in cosmetic products intended for children under three years of age. Scientific Committee on Consumer Safety (SCCS) 2011. Available from: http://ec.europa.eu/health/scientific_committees/consumer_safety/docs/sccs_o_069.pdf [Last accessed on 23 Feb 2023].
15. Błędzka D, Gromadzińska J, Wąsowicz W. Parabens. From environmental studies to human health. Environ Int 2014;67:27-42.
16. Official Journal of the European Union. Regulation (EC) no 1223/2009 of the European Parliament and of the Council of 30 November 2009 on cosmetic products. 2009;L342:59-209. Available from: https://eur-lex.europa.eu/legal-content/en/ALL/?uri=CELEX:32009R1223 [Last accessed on 23 Feb 2023].
17. Seachrist DD, Bonk KW, Ho SM, Prins GS, Soto AM, Keri RA. A review of the carcinogenic potential of bisphenol A. Reprod Toxicol 2016;59:167-82.
18. Xu W. The development status and trend of BPA industry. Chem Ind 2021; 39: 28-36 (in Chinese). Available from: https://kns.cnki.net/kcms/detail/detail.aspx?dbcode=CJFD&dbname=CJFDLAST2022&filename=HGJJ202104004&uniplatform=NZKPT&v=OW_FTZdJ5fONUa2p6DLw0Z-dhLdSwkioqnFyylFj4OF8666BBnTdwVl0bbt4EEyj [Last accessed on 23 Feb 2023].
19. The European Commission. Commission directive 2011/8/EU of 28 January 2011 amending directive 2002/72/EC as regards the restriction of use of bisphenol A in plastic infant feeding bottles. Off J Eur Union 10-05-2013 2011. Available from: https://eur-lex.europa.eu/LexUriServ/LexUriServ.do?uri=OJ:L:2011:026:0011:0014:EN:PDF [Last accessed on 23 Feb 2023].
20. Government of Canada. Order amending schedule I to the hazardous products act (Bisphenol A), Part II, 144,7. Government of Canada. 2010. Available from: https://publications.gc.ca/gazette/archives/p2/2010/2010-03-31/pdf/g2-14407.pdf [Last accessed on 23 Feb 2023].
21. Rochester JR, Bolden AL. Bisphenol S and F: a systematic review and comparison of the hormonal activity of bisphenol A substitutes. Environ Health Perspect 2015;123:643-50.
22. Ding K, Zhang H, Wang H, et al. Atomic-scale investigation of the interactions between tetrabromobisphenol A, tetrabromobisphenol S and bovine trypsin by spectroscopies and molecular dynamics simulations. J Hazard Mater 2015;299:486-94.
23. Liu K, Li J, Yan S, Zhang W, Li Y, Han D. A review of status of tetrabromobisphenol A (TBBPA) in China. Chemosphere 2016;148:8-20.
24. Lyche JL, Rosseland C, Berge G, Polder A. Human health risk associated with brominated flame-retardants (BFRs). Environ Int 2015;74:170-80.
25. Yang R, Liu S, Liang X, et al. TBBPA, TBBPS, and TCBPA disrupt hESC hepatic differentiation and promote the proliferation of differentiated cells partly via up-regulation of the FGF10 signaling pathway. J Hazard Mater 2021;401:123341.
26. Net S, Sempéré R, Delmont A, Paluselli A, Ouddane B. Occurrence, fate, behavior and ecotoxicological state of phthalates in different environmental matrices. Environ Sci Technol 2015;49:4019-35.
27. Specht IO, Toft G, Hougaard KS, et al. Associations between serum phthalates and biomarkers of reproductive function in 589 adult men. Environ Int 2014;66:146-56.
28. USEPA. Toxic and priority pollutants under the clean water act. Available from: https://www.epa.gov/eg/toxic-and-priority-pollutants-under-clean-water-act [Last accessed on 23 Feb 2023].
29. Lan J, Shen Z, Gao W, Liu A. Occurrence of bisphenol-A and its brominated derivatives in tributary and estuary of Xiaoqing River adjacent to Bohai Sea, China. Mar Pollut Bull 2019;149:110551.
30. Huang DY, Zhao HQ, Liu CP, Sun CX. Characteristics, sources, and transport of tetrabromobisphenol A and bisphenol A in soils from a typical e-waste recycling area in South China. Environ Sci Pollut Res Int 2014;21:5818-26.
31. Huang D, Gao L, Qiao L, et al. Concentrations of and risks posed by short-chain and medium-chain chlorinated paraffins in soil at a chemical industrial park on the southeast coast of China. Environ Pollut 2020;258:113704.
32. Zhu Q, Xu L, Wang W, Liu W, Liao C, Jiang G. Occurrence, spatial distribution and ecological risk assessment of phthalate esters in water, soil and sediment from Yangtze River Delta, China. Sci Total Environ 2022;806:150966.
33. Zhu Q, Wang M, Jia J, Hu Y, Wang X, Liao C, Jiang G. Occurrence, distribution, and human exposure of several endocrine-disrupting chemicals in indoor dust: a nationwide study. Environ Sci Technol 2020;54:11333-43.
34. Zhu Q, Jia J, Wang Y, et al. Spatial distribution of parabens, triclocarban, triclosan, bisphenols, and tetrabromobisphenol A and its alternatives in municipal sewage sludges in China. Sci Total Environ 2019;679:61-9.
35. Zhu Q, Jia J, Zhang K, Zhang H, Liao C, Jiang G. Phthalate esters in indoor dust from several regions, China and their implications for human exposure. Sci Total Environ 2019;652:1187-94.
36. Dong J, Wang NN, Yao ZJ, et al. ADMETlab: a platform for systematic ADMET evaluation based on a comprehensively collected ADMET database. J Cheminform 2018;10:29.
37. Wang J, Chen G, Christie P, Zhang M, Luo Y, Teng Y. Occurrence and risk assessment of phthalate esters (PAEs) in vegetables and soils of suburban plastic film greenhouses. Sci Total Environ 2015;523:129-37.
38. USEPA. Supplemental guidance for developing soil screening level for superfund sites. OSWER 9355.4-24. Office of Solid Waste and Emergency Response, Washington. 2001. Available from: https://epa-sdcc.ornl.gov/pdfs/SSG_nonrad_supplemental.pdf [Last accessed on 23 Feb 2023].
39. Tao H, Wang Y, Liang H, Zhang X, Liu X, Li J. Pollution characteristics of phthalate acid esters in agricultural soil of Yinchuan, northwest China, and health risk assessment. Environ Geochem Health 2020;42:4313-26.
40. Xie J, Zhao N, Zhang Y, Hu H, Zhao M, Jin H. Occurrence and partitioning of bisphenol analogues, triclocarban, and triclosan in seawater and sediment from East China Sea. Chemosphere 2022;287:132218.
41. Lozano N, Rice CP, Ramirez M, Torrents A. Fate of Triclocarban, Triclosan and Methyltriclosan during wastewater and biosolids treatment processes. Water Res 2013;47:4519-27.
42. Soni MG, Carabin IG, Burdock GA. Safety assessment of esters of p-hydroxybenzoic acid (parabens). Food Chem Toxicol 2005;43:985-1015.
43. Song S, Song M, Zeng L, et al. Occurrence and profiles of bisphenol analogues in municipal sewage sludge in China. Environ Pollut 2014;186:14-9.
44. Zhang ZM, Yang GP, Zhang HH, Shi XZ, Zou YW, Zhang J. Phthalic acid esters in the sea-surface microlayer, seawater and sediments of the East China Sea: spatiotemporal variation and ecological risk assessment. Environ Pollut 2020;259:113802.
45. Wang MH, Chen CF, Albarico FPJB, Chen CW, Dong CD. Occurrence and distribution of phthalate esters and microplastics in wastewater treatment plants in Taiwan and their toxicological risks. Chemosphere 2022;307:135857.
46. Azzouz A, Ballesteros E. Combined microwave-assisted extraction and continuous solid-phase extraction prior to gas chromatography-mass spectrometry determination of pharmaceuticals, personal care products and hormones in soils, sediments and sludge. Sci Total Environ 2012;419:208-15.
47. Cha J, Cupples AM. Determination of triclocarban and triclosan in biosolid and soil samples by application of pressurized liquid extraction and liquid chromatography with tandem mass spectrometry. Geosystem Engineering 2012;15:280-91.
48. Chen J, Meng XZ, Bergman A, Halden RU. Nationwide reconnaissance of five parabens, triclosan, triclocarban and its transformation products in sewage sludge from China. J Hazard Mater 2019;365:502-10.
49. Mao H, Li H, Li Y, Li L, Yin L, Yang Z. Four typical personal care products in a municipal wastewater treatment plant in China: Occurrence, removal efficiency, mass loading and emission. Ecotoxicol Environ Saf 2020;188:109818.
50. Pérez RA, Albero B, Miguel E, Sánchez-Brunete C. Determination of parabens and endocrine-disrupting alkylphenols in soil by gas chromatography-mass spectrometry following matrix solid-phase dispersion or in-column microwave-assisted extraction: a comparative study. Anal Bioanal Chem 2012;402:2347-57.
51. Feng J, Zhao J, Xi N, Guo W, Sun J. Parabens and their metabolite in surface water and sediment from the Yellow River and the Huai River in Henan Province: Spatial distribution, seasonal variation and risk assessment. Ecotoxicol Environ Saf 2019;172:480-7.
52. Liao C, Shi J, Wang X, Zhu Q, Kannan K. Occurrence and distribution of parabens and bisphenols in sediment from northern Chinese coastal areas. Environ Pollut 2019;253:759-67.
53. Sun X, Peng J, Wang M, et al. Determination of nine bisphenols in sewage and sludge using dummy molecularly imprinted solid-phase extraction coupled with liquid chromatography tandem mass spectrometry. J Chromatogr A 2018;1552:10-6.
54. Wang J, Liu L, Wang J, et al. Distribution of metals and brominated flame retardants (BFRs) in sediments, soils and plants from an informal e-waste dismantling site, South China. Environ Sci Pollut Res Int 2015;22:1020-33.
55. Tang J, Feng J, Li X, Li G. Levels of flame retardants HBCD, TBBPA and TBC in surface soils from an industrialized region of East China. Environ Sci Process Impacts 2014;16:1015-21.
56. Lu JF, He MJ, Yang ZH, Wei SQ. Occurrence of tetrabromobisphenol a (TBBPA) and hexabromocyclododecane (HBCD) in soil and road dust in Chongqing, western China, with emphasis on diastereoisomer profiles, particle size distribution, and human exposure. Environ Pollut 2018;242:219-28.
57. Jeon JW, Kim CS, Kim HJ, Lee CH, Hwang SM, Choi SD. Spatial distribution, source identification, and anthropogenic effects of brominated flame retardants in nationwide soil collected from South Korea. Environ Pollut 2021;272:116026.
58. Li F, Jin J, Tan D, et al. Hexabromocyclododecane and tetrabromobisphenol A in sediments and paddy soils from Liaohe River Basin, China: levels, distribution and mass inventory. J Environ Sci (China) 2016;48:209-17.
59. Gorga M, Martínez E, Ginebreda A, Eljarrat E, Barceló D. Determination of PBDEs, HBB, PBEB, DBDPE, HBCD, TBBPA and related compounds in sewage sludge from Catalonia (Spain). Sci Total Environ 2013;444:51-9.
60. Ma TT, Wu LH, Chen L, Zhang HB, Teng Y, Luo YM. Phthalate esters contamination in soils and vegetables of plastic film greenhouses of suburb Nanjing, China and the potential human health risk. Environ Sci Pollut Res Int 2015;22:12018-28.
61. Sun J, Pan L, Zhan Y, et al. Contamination of phthalate esters, organochlorine pesticides and polybrominated diphenyl ethers in agricultural soils from the Yangtze River Delta of China. Sci Total Environ 2016;544:670-6.
62. Wang LY, Gu YY, Zhang ZM, et al. Contaminant occurrence, mobility and ecological risk assessment of phthalate esters in the sediment-water system of the Hangzhou Bay. Sci Total Environ 2021;770:144705.
63. Zhu Q, Jia J, Zhang K, Zhang H, Liao C. Spatial distribution and mass loading of phthalate esters in wastewater treatment plants in China: An assessment of human exposure. Sci Total Environ 2019;656:862-9.
64. Geens T, Aerts D, Berthot C, et al. A review of dietary and non-dietary exposure to bisphenol-A. Food Chem Toxicol 2012;50:3725-40.
65. Liao C, Chen L, Kannan K. Occurrence of parabens in foodstuffs from China and its implications for human dietary exposure. Environ Int 2013;57-58:68-74.
66. Liao C, Chen L, Kannan K. Occurrence of parabens in foodstuffs from China and its implications for human dietary exposure. Environ Int 2013;57-58:68-74.
67. Silano V, Bolognesi C, Castle L, et al. Panel on Food Contact Materials; Enzymes; Flavourings and Processing Aids (CEF). A statement on the developmental immunotoxicity of bisphenol A (BPA): answer to the question from the Dutch Ministry of Health, Welfare and Sport. EFSA J 2016;14:e04580.
68. Fitzgerald R, Loveren HV, Civitella C, Castoldi AF, Bernasconi G. European Food Safety Authority (EFSA). Assessment of new information on Bisphenol S (BPS) submitted in response to the Decision 1 under REACH Regulation (EC) No 1907/2006. EFS3 2020:17.
69. Higashihara N, Shiraishi K, Miyata K, Oshima Y, Minobe Y, Yamasaki K. Subacute oral toxicity study of bisphenol F based on the draft protocol for the “Enhanced OECD Test Guideline no. 407”. Arch Toxicol 2007;81:825-32.
70. Wikoff D, Thompson C, Perry C, et al. Development of toxicity values and exposure estimates for tetrabromobisphenol A: application in a margin of exposure assessment. J Appl Toxicol 2015;35:1292-308.
71. Li X, Zhong Y, He W, et al. Co-exposure and health risks of parabens, bisphenols, triclosan, phthalate metabolites and hydroxyl polycyclic aromatic hydrocarbons based on simultaneous detection in urine samples from guangzhou, south China. Environ Pollut 2021;272:115990.
Cite This Article
How to Cite
Download Citation
Export Citation File:
Type of Import
Tips on Downloading Citation
Citation Manager File Format
Type of Import
Direct Import: When the Direct Import option is selected (the default state), a dialogue box will give you the option to Save or Open the downloaded citation data. Choosing Open will either launch your citation manager or give you a choice of applications with which to use the metadata. The Save option saves the file locally for later use.
Indirect Import: When the Indirect Import option is selected, the metadata is displayed and may be copied and pasted as needed.
About This Article
Copyright


Comments
Comments must be written in English. Spam, offensive content, impersonation, and private information will not be permitted. If any comment is reported and identified as inappropriate content by OAE staff, the comment will be removed without notice. If you have any queries or need any help, please contact us at [email protected].