

Ethylbenzene exposure in North America - an update

Abstract
Chronic ethylbenzene exposures and attendant potential health risks for United States children and prospective parents were first evaluated under the United States Environmental Protection Agency’s Voluntary Children’s Chemical Evaluation Program. Using updated data and methods, a 2015 reevaluation observed declines in ethylbenzene releases and concentrations in ambient and indoor air. Both assessments identified inhalation as the dominant exposure route and smoking as the greatest contributor, with dietary intake much lower. Children’s exposure concentrations were similar to that of adults, but their intakes were higher. Neither breastfeeding nor toy mouthing was a significant source. This report updates the previous assessments, summarizing current ethylbenzene concentrations in air and foods, exposures during the use of household and consumer products, nationally representative biomonitoring data, including expanded demographic groups, and a new survey of worker exposures in styrene production facilities. General population ethylbenzene exposures appear to have declined for all age groups. The ethylbenzene/styrene chain of commerce contributes an estimated 0.1% to total air emissions and 7%-12% to dietary concentrations. Total estimated ethylbenzene intakes are consistent with biomonitoring data. Lactational transfer is not a significant exposure pathway for breastfed infants. Production workers’ exposure is well below occupational guidelines. Updated exposure estimates for each pathway suitable for potential health risk assessment are proposed.
Keywords
INTRODUCTION
The Voluntary Children’s Chemical Evaluation Program (VCCEP) was intended to provide the information needed to protect children from chemicals to which they have a high likelihood of exposure[1]. Companies that manufactured or imported these chemicals were asked to volunteer to sponsor their chemicals and provide available information on health effects, exposure, risk, and data needs for the first tier of the pilot program. The key questions to be addressed were (1) whether the potential hazards, exposures, and risks to children had been adequately characterized; and (2) if not, what additional data were necessary[2]. The Tier 1 hazard, exposure, and risk assessments prepared by sponsors were to be submitted to the United States Environmental Protection Agency (USEPA) and evaluated by an independent group of experts with extensive experience in toxicity testing and exposure evaluations convened by Toxicology Excellence for Risk Assessment (TERA). Following the peer consultation process, the USEPA would make a data needs determination, and request collection of up to two more tiers of increasingly detailed information as necessary to adequately characterize exposure and risks to children[2].
Ethylbenzene (CAS No. 100-41-4), a natural component of crude oil and refined petroleum products and some natural gas streams, as well as an important industrial chemical, is one of the highest production volume chemicals in the United States. It was one of 23 chemicals selected for the VCCEP pilot in 2000, and one of 15 carried through the Tier 1 peer consultation process. Ethylbenzene was selected because substantial hazard data were available, it was present in petroleum products, consumer products, and environmental media, and it was detected in human blood in the United States Centers for Disease Control and Prevention’s (CDC’s) National Health and Nutrition Examination Survey (NHANES)[3] and in expired air in the Total Exposure Assessment Methodology (TEAM) monitoring programs[4]. The American Chemistry Council (ACC) Ethylbenzene Panel sponsored the Tier 1 assessment for ethylbenzene, which was submitted in December 2006[5]. Following peer consultation in February 2007, a revised version was submitted[6]. However, a data needs decision was never issued by the USEPA[7].
The ethylbenzene industry is closely tied to the styrene industry because most of the manufactured ethylbenzene (approximately 98%) is consumed internally for the manufacture of styrene, or in the co-production of styrene monomer with propylene oxide[8,9]. Styrene monomer is an intermediate in the production of a number of commercially important homopolymers and co-polymers used to make a wide variety of products of industrial, consumer, and medical importance, including polystyrene (building construction and food packaging and contact materials), styrene-butadiene rubber (tires and automotive parts), unsaturated polyester resins (boats and tubs/shower stalls), styrene-butadiene latexes (carpet backings and paper coatings), acrylonitrile-butadiene-styrene (household and office appliances), and styrene-acrylonitrile (housewares and battery casings)[9-13]. Releases associated with the ethylbenzene/styrene chain of commerce can occur from sites of ethylbenzene/styrene production, from the processing of styrene monomer into polymers, and from the further processing of the styrenic polymers to make articles. As commercially important styrenic polymers may contain residual amounts of ethylbenzene from the production process, releases are also possible during a product’s lifetime and following disposal of the articles.
As a natural constituent of petroleum, ethylbenzene is often found in petroleum products (including asphalt, naphtha, and automotive and aviation fuels). Ethylbenzene has been added to motor and aviation fuels because of its anti-knock properties, with concentrations in gasoline ranging from < 1% to 5.4% by weight. Emissions can occur from industrial activities related to upstream oil and gas production (glycol dehydrators, oil sands upgrading, and fugitive equipment leaks) and petroleum refining (manufacture, processing, use, storage, and disposal)[8,13-15]. It is a component of hydrocarbon solvents, particularly mixed xylenes, which may contain up to 25% of ethylbenzene by volume. As part of these mixtures, ethylbenzene may be found in the solvents used to formulate varnishes, wood stains, primers, paints, paint removers and thinners, lacquers, household and automotive cleaners, as well as those used in the rubber and chemical manufacturing industries[8,13,14]. Ethylbenzene from these sources constitutes the refinery chain of commerce.
Ethylbenzene is mobile in all environmental media, with a strong tendency to migrate to the atmosphere regardless of the mode of release. The physicochemical characteristics and behavior of ethylbenzene in the environment thus indicate that the predominant route of human exposure is inhalation[8]. Widespread human exposure can also occur via ingestion of food items into which ethylbenzene has migrated from food packaging and contact materials or partitioned from the atmosphere. The strategy used to evaluate exposures to ethylbenzene involved elements of both chain of commerce and receptor-centered approaches, attempting to distinguish between ethylbenzene’s two discrete commerce chains. Receptors of interest included (1) the general population (particularly prospective parents and children of different age groups); and (2) workers involved in ethylbenzene production and styrene/polystyrene manufacture. Exposure pathways unique to young children were ingestion of mother’s milk and mouthing of plastic toys made of styrene-containing polymers. An effort was made to distinguish, on a semi-quantitative basis, the proportion of each exposure pathway that was directly attributable to the ethylbenzene/styrene chain of commerce.
The major findings of the VCCEP Tier 1 exposure assessment were:
● The major source of exposure is automotive emissions.
● The major exposure microenvironment is the home (residential indoor air).
● Although ethylbenzene is found in food (partly due to migration from styrenic food packaging and contact materials), the major exposure route for all receptors is inhalation.
● Although groundwater and surface water can be affected by localized spills and other releases, available data consistently indicate low detection frequency and low concentrations of ethylbenzene in both groundwater and surface water resources used for drinking. Accordingly, ethylbenzene intakes via drinking water are considered negligible for the general population.
● Potential exposure to children mouthing plastic toys (which are usually composed of polyvinyl chloride rather than styrene-containing polymers) was four to five orders of magnitude lower than those associated with the other identified sources.
● The contributions of the ethylbenzene/styrene chain of commerce to inhalation and dietary exposures are relatively small.
When the VCCEP submission was prepared, nationally representative indoor or personal air data were not available. As a result, inhalation exposures to ethylbenzene were estimated for important microenvironments (homes, schools, offices, and motor vehicles) by applying literature-based indoor/outdoor ratios to central tendency and upper-bound urban and rural outdoor air ethylbenzene concentrations. In accordance with contemporaneous USEPA guidance, ethylbenzene intakes via inhalation were calculated based on assumed times spent in these microenvironments by various age groups, and default estimates of their inhalation rates and body weights. In the absence of data allowing a clear distinction of the original source(s) of ethylbenzene present in air and food, emission contribution estimates and models predicting migration from food-contact materials were applied to estimate the proportion of total exposure that may be attributable to the ethylbenzene/styrene chain of commerce.
As documented in the USEPA’s AirData database, ethylbenzene emissions and concentrations in ambient air have continued to decline[16]. Multiple large studies examining indoor and personal exposures to VOCs in North America and elsewhere were published, and the CDC expanded its biomonitoring program to include more demographic and age groups. Personal air monitoring data provide a more robust estimate of inhalation exposure to ethylbenzene than the previously used method by integrating exposure magnitude and duration in all areas that individuals spend time in, also accounting for individual characteristics and varying activity levels. Biomonitoring data are the “gold standard” for exposure assessment, integrating exposures by all routes and providing a robust basis for identifying exposures that may be elevated relative to the general population. Biomonitoring data can also be linked to external exposures by regression analysis and/or physiologically based pharmacokinetic (PBPK) modeling to both predict internal doses and to compare these with biomonitoring equivalents (BEs) (concentrations of a biomarker of chemical exposure in blood or urine corresponding to a chronic toxicological criterion in a relevant exposure medium). In addition, substantive changes occurred in relevant USEPA exposure and toxicity assessment guidance. Current USEPA guidance prescribes that potential inhalation hazards and risks are to be computed based on a comparison of exposure concentrations with inhalation-based toxicity criteria[17].
New exposure information through early 2014 was included in the ethylbenzene exposure and risk assessment update published in 2015[18]. USEPA’s revised inhalation exposure and risk assessment guidance was applied to nationally representative personal exposure data, which both simplified and substantially reduced uncertainty in the exposure assessment by obviating the need for (1) separate consideration of urban and rural settings; (2) time apportionment in microenvironments; and (3) assumptions regarding age-specific inhalation rates, body weights, and uptake efficiency. However, biomonitoring data were not considered, and no data were available to update estimated dietary intakes. The major objectives of this third comprehensive ethylbenzene exposure assessment are to (1) summarize current North American data trends regarding ethylbenzene concentrations in environmental media and foodstuffs, occupational exposure levels, and exposures during the use of household and consumer products; (2) develop updated central tendency and upper-bound exposure estimates for each source and pathway suitable for assessment of potential health risks associated with environmental ethylbenzene exposures according to the conceptual site model shown in Figure 1; (3) characterize biomonitoring data and trends, and their relationship to external exposure measures; and (4) estimate the proportion of each exposure pathway that is directly attributable to the ethylbenzene/styrene chain of commerce. Available drinking water data continue to indicate low exposure potential, and a recent review of chemicals in plastic toys did not identify ethylbenzene as one of the 126 chemicals of concern[19]. Therefore, these sources were again not considered quantitatively.

Figure 1. Exposure pathway conceptual site model for ethylbenzene.
An effort was made to more fully characterize potential demographic (age, sex, racial/ethnic group) differences and the ranges of exposures in different work environments, including a new survey of personal exposures to ethylbenzene in styrene production facilities. The relative contributions of inhalation and dietary exposure routes, undertaken in the VCCEP submission but not considered by Sweeney et al., are also reexamined[18]. It is hoped that this updated and expanded information will be useful in characterizing potential human health risks to both the general population (including children and older adults) and workers. Differences between this update and the previous evaluations are highlighted.
LITERATURE SEARCH STRATEGY
The online databases PubMed and Google Scholar were repeatedly searched to identify English-language publications (peer-reviewed articles and academic theses) related to ethylbenzene exposure published since the previous review (2015 to 2022). Over 15,000 publications were identified and screened for relevance. Emphasis was placed on North American publications, but data from several European and Asian countries were also reviewed. Updates to relevant reports and databases produced by the United States [Agency for Toxic Substances and Disease Registry (ATSDR), CDC, USEPA, Food and Drug Administration (FDA), Occupational Safety and Health Administration, and United States Department of Agriculture (USDA)], Canadian (Health Canada and Environment Canada), and international (World Health Organization and International Agency for Research on Cancer) governmental agencies were also identified through website searches. Additionally, many resources were identified through chain searching from the previous reviews and relevant literature. Approximately 450 references provided source material for this updated review.
GENERAL POPULATION EXPOSURES
Indoor air
Ambient monitoring data are appropriate for broadly assessing the exposures of large populations to chemicals in outdoor air. However, such data arbitrarily homogenize exposure concentrations across multiple microenvironments, and, more critically, fail to capture indoor exposures. Indoor air quality is a complex function of a building’s location, characteristics, composition, content, and uses. Indoor VOC concentrations are a function of both outdoor sources (such as motor vehicle and industrial emissions) and indoor sources such as construction materials, interior surfaces and coatings, environmental tobacco smoke (ETS), consumer products, and cooking emissions. Not surprisingly, air quality impacts associated with indoor sources are exacerbated by modern energy-efficient building and ventilation practices that enhance energy conservation at the expense of infiltration air exchange[20-22]. The indoor environment has become the major venue for exposure assessment not only because concentrations of most VOCs, including ethylbenzene, are typically higher in buildings than in outdoor air, but because most individuals, including children, spend 60% to 80% of their time indoors, primarily at home[23-32]. Therefore, this review is focused on residential and personal exposure data.
Residences
The USEPA TEAM studies, conducted in eight urban areas in the 1980s, were the first major United States exposure assessments to measure indoor air and individual personal exposures (measurement of airborne chemicals in a person’s breathing zone) within a probability-based sampling framework[4,33-41]. TEAM results have been corroborated and expanded in other large-scale investigations of exposure to environmental chemicals among the general population in North America, Europe, Asia, and Australia[23,25,29,30,32,42-51]. Key insights from these studies are (1) for many of the sampled VOCs, including ethylbenzene, outdoor concentrations are considerably lower than indoor concentrations, which are in turn lower than personal concentrations (discussed below); and (2) although personal activities and indoor sources may not exert the strongest influence on indoor concentrations, they are the dominant sources of personal exposure.
Several studies reporting that smoking is a determinant of ethylbenzene concentrations in indoor microenvironments were discussed in the VCCEP submission[6] and updated by Sweeney et al.[18]. However, there is substantial evidence that the influence of smoking on indoor air concentrations of ethylbenzene is not strong. Xie et al. examined the influence of ETS on concentrations of ethylbenzene and other VOCs in a test room[52]. Factor and correlation analyses showed that ethylbenzene concentrations “are not evidently correlated” with ETS markers[52]. Although Kim et al. reported increased ethylbenzene concentrations in UK smoking homes, factor analysis did not identify ethylbenzene as tobacco-related[21]. Heavner et al. measured ethylbenzene concentrations using personal air samplers worn by women married to smokers and non-smokers[53]. The average ethylbenzene concentration in homes with a smoker was slightly lower but not significantly different from the average concentration detected in non-smoker homes. The fact that ethylbenzene was significantly elevated in homes where gasoline was stored suggests that any influence of smoking could have been overwhelmed by the stronger petroleum-related source. In a similar study involving non-smoking women in the greater Philadelphia area, ethylbenzene concentrations detected using personal air samplers were not significantly different for women married to smokers vs. non-smokers[54]. The authors also found no difference between ethylbenzene concentrations measured for women working in smoking vs. non-smoking environments. They concluded, based on 3-ethenylpyridine/ethylbenzene ratios, that only 3.4% of personal exposure to ethylbenzene in the home and 2.7% in the workplace were attributable to ETS[54]. Also, using 3-ethenylpyridine as a tracer for ETS, Hodgson et al. (1996) found that ETS contributed less than 50% of the ethylbenzene concentrations detected in designated smoking areas in office buildings[55]. The EXPOLIS-Helsinki studies indicated only marginally significantly higher personal ethylbenzene exposures for ETS-exposed participants[45]. Ethylbenzene concentrations were slightly but non-significantly higher in Detroit homes with ETS (objectively defined using ETS tracers)[56]. The authors noted that apparently minor VOC exposure differences due to smoking, as evidenced by area sampling, are more clearly demonstrated with more precise personal exposure measurements[56]. Despite observing significantly higher ethylbenzene concentrations in smoking vs. non-smoking dwellings in the 2009-2011 CHMS survey[50], ethylbenzene concentrations were not correlated with smoking[49]. Ethylbenzene was also not associated with ETS in Alberta, Canada homes[47]. Moreover, in the 2012-2013 CHMS survey, ethylbenzene concentrations were not significantly higher in smoking homes[48].
Dawson and McAlary combined statistics from studies of North American residential indoor air (non-smoking) published between 1990 and 2005 by computing the means of the percentiles reported in individual studies, weighted by sample size[57]. Subsequently published studies of North American residences in which the sampling duration was 12 hours or greater (summarized in Supplementary Table 1) were compiled in a similar manner for this review [Table 1]. Because ETS does not appear to play a major role in determining indoor ethylbenzene concentrations, both non-smoking (the great majority) and smoking homes were included in this tabulation. It should be noted that the purposes, sampling strategies, and sample collection and analytical methodologies vary among these studies, and none of them purport to be nationally representative. Nonetheless, they provide a broad picture of residential ethylbenzene concentrations in a variety of settings.
Trends in weighted summary statistics for indoor air concentrations of ethylbenzene in North American residences and personal air (μg/m3)
| Years | n | Percentile | ||||
| 25 | 50 | 75 | 90 | 95 | ||
| Residences | ||||||
| 1981-2004a | 2298 | 1.6 | 2.7 | 5.2 | 9.9 | 15.2 |
| 1990-2005b | 1484 | 0.8 | 2.0 | 3.0 | 8.6 | 14.0 |
| 1991-2000c | 2449 | 1.2 | 1.7 | 2.7 | 7.7 | 10.6 |
| 2001-2005c | 1782 | 0.8 | 1.5 | 3.4 | 14.0 | 13.7 |
| 2006-2009c | 1524 | 0.7 | 1.3 | 2.9 | 10.9 | 19.3 |
| 2010-2017c | 7772 | 0.6 | 1.1 | 2.6 | 6.5 | 11.3 |
| Personal aird | ||||||
| 1999-2001 | 1187 | 1.2 | 2.2 | 3.9 | 9.6 | 16.0 |
| 2004-2009 | 2552 | 1.1 | 1.7 | 3.4 | Na | 11.9 |
Median residential ethylbenzene concentrations appear to have trended downward (around 39%) since the mid-2000s, and median ethylbenzene concentrations in the past ten years have been below USEPA’s chronic non-cancer residential RSL for ethylbenzene of 1000 µg/m3[59]. Median and 95th percentile concentrations from data collected from 2010 to 2014 (including the nationwide Canadian studies) are
Personal air
Sampling of personal air concentrations in an individual’s breathing zone throughout daily activities provides a highly accurate estimate of inhalation exposures because exposure concentrations in all areas are inherently time- and activity-integrated[24,46,60]. The nationally representative NHANES VOC Study[42], published shortly after the VCCEP submissions, was selected by Sweeney et al. as the most appropriate data set for the characterization of ethylbenzene exposure to the general United States adult population[18]. Approximately 27% of NHANES subjects were determined to be smokers or have regular exposure to ETS based on serum cotinine levels. Sweeney et al. identified central tendency and upper-bound personal exposure estimates for non-smoking adults from the NHANES data set at the geometric mean (2.9 μg/m3) and 90th percentile (14.2 μg/m3), respectively. These values are conservative because of the inclusion of smokers and people with regular exposure to ETS in the sampled group. Comparing weighted geometric mean personal ethylbenzene exposure levels in smokers vs. non-smokers in the NHANES data set, Symanski et al. reported a non-significantly higher (1.4-fold) weighted geometric mean for smokers of
Published summary statistics from available studies (including one conducted in the U.K.) measuring ethylbenzene concentrations in adults’ and children’s personal air from 1999 to 2009 (the latest general population data found) are summarized in Supplementary Table 2. Sampling durations in these studies ranged from 24 hours to five days. The fact that ethylbenzene emissions and outdoor and indoor air concentrations have all decreased since the mid-2000s suggests that personal air concentrations may also have declined, but a downward trend is not clearly evident in the limited and variable data that are available. The estimated central tendency and upper-bound general population personal exposure estimates used by Sweeney et al. are updated here to reflect post-2004 studies. Resultant central tendency and upper bound personal exposure concentrations are the weighted mean median and 95th percentile of studies conducted from 2004 onwards, 1.7 and 11.9 µg/m3, respectively [Table 1].
Exposure during hobby/home maintenance activities
Use of products containing ethylbenzene in and around the home can result in transient high concentrations that may not be captured by long-term air or biomarker monitoring data. People using small gasoline-powered engines for residential yard work can be exposed to ethylbenzene via evaporation during refueling and from the exhaust of un-combusted fuel. Average short-term (15-minute) personal ethylbenzene exposures for people using conventional gasoline-powered equipment were 0.95 µg/m3 for mowing and 2.95 µg/m3 for trimming. The authors suggested that the higher exposures during trimming could be due to the closer proximity of the trimmer mower to the operator’s breathing zone[63]. The average eight-hour time-weighted average (TWA) personal ethylbenzene concentration was higher (3.95 µg/m3) because exposure during refueling (91 µg/m3, not included in the short-term activities) contributed 61% of the total 8-hour exposure. These concentrations are similar to those encountered at gas stations and riding in motor vehicles[6,31,64,65].
Ethylbenzene is also present in numerous household and consumer products used in a wide variety of exposure scenarios. Under USEPA’s Exposure Forecasting (ExpoCast) initiative, models for making high-throughput exposure predictions are under active development[66-70]. Using USEPA’s Chemicals and Products Database (data on consumer product composition and functional use) and mass-balance-based exposure models, Jolliet et al. estimated consumer exposure to ethylbenzene via inhalation, ingestion, and dermal contact may occur during the use of a broad array of products[71]. Intakes for each exposure route were obtained by combining the chemical mass in the product with the product intake fractions. Modeled exposures from the use of 25 products ranged from 0.02 mg/kg BW-day to 13 mg/kg BW-day for adult users, with the highest potential exposures associated with paints and strippers [Supplementary Table 3]. Inhalation is the dominant exposure route (70% to 100%) for all products. Applying the standard default exposure parameter values of 70 kg adult body weight (used in Jolliet et al.’s spreadsheet calculations) and the default adult inhalation rate of 16 m3/day [72], corresponding air concentrations of 37 µg/m3 (wood adhesive spray) to almost 40,000 µg/m3 (stripper) can be calculated.
Similar results were obtained by Environment and Climate Change Canada/Health Canada[13] using the multi-tiered predictive model ConsExpo to estimate inhalation and dermal exposures to ethylbenzene from consumer use of spray and liquid paints, paint remover, lacquer/stain/varnish, and joint sealant by adults
Food
Ethylbenzene does not appear to be naturally occurring in plants[74] and is not expected to bioaccumulate in the aquatic (or terrestrial) food web[8]. Studies reviewed in previous evaluations showed that foods are subject to the accumulation of low levels of ethylbenzene by partitioning from ambient atmospheric sources. As a key component in the production of styrene, the monomer used in the production of a wide variety of polystyrene-based packaging materials for numerous foods and food products, ethylbenzene can become occluded in polystyrene products during the production process. Thus, a more important source of ethylbenzene exposure via the diet, also considered in the previous evaluations, is migration from food packaging and contact materials. Major factors affecting ethylbenzene migration into food are diffusion within the polymer, solvation and the polymer-food interface, and dispersion into the food. These processes are in turn influenced by polymer type, exposure time, temperature, and food composition (especially fat content)[75-80]. Moderate heating does not result in significant migration of ethylbenzene into packaged foods, but microwaving or other intense heating of food in polystyrene (and other plastic) containers can increase the possibility of migration[74,75,77,81-89]. In a recent study using headspace GC/MS to quantify VOCs in water and acidic, alcoholic, and fatty food simulants (30 minutes at 100 °C for water and acidic simulant; 30 minutes at 70 °C for alcoholic simulant; 60 minutes at 25 °C for fatty simulant), no migration of ethylbenzene from samples of paper/paperboard, polyethylene, polypropylene, polystyrene, and polyethylene terephthalate was detected[90].
Migration from food packaging materials is the subject of national and international regulation[78,91-98]. There is no United States standard for migration of ethylbenzene, but the European Union derived a specific migration limit (SML) (maximum permitted amount of a substance in food) of 600 µg/kg, noting that “…the SCF(Scientific Committee on Food) considers it unlikely that intakes of …ethylbenzene… via food, including olive oil, at the contamination levels reported to the Committee would contribute significantly to the risk to human health from other sources. In general, intakes from other sources, especially via inhalation, are more important”[99]. Recently, Song et al. calculated a theoretical health-based maximum migration amount (1800 µg/kg) for comparison with migration results[95].
The VCCEP submission presented the results of kinetic modeling performed by the Polystyrene Work Group (PWG)[100] based on Lickly et al.’s modification of the United States Food and Drug Administration (FDA) protocol[101,6]. This modeling effort was based on the relatively substantial body of measured migration data available for styrene from polystyrene. The total concentration of ethylbenzene estimated to be present in the diet due to migration from styrenic food-contact materials was 0.45 µg/kg. The FDA’s Cumulative Estimated Daily Intakes (CEDI) database provides a higher dietary migration-derived dietary concentration of 3 µg/kg, but the basis of this value is not provided[102].
Population-based surveys of chemical concentrations in foods and ingestion rates can provide a more robust basis for exposure and risk assessment. The VCCEP submission[6] and Sweeney et al. summarized data available through the mid-2000s and mid-2010s, respectively[18]. The primary data source at that time was the FDA Total Diet Study (TDS), an ongoing program that determines levels of various nutrients and chemicals in table-ready foods representing the major components of the United States diet[103]. Ethylbenzene was detected above “trace” levels [concentration greater than or equal to the limit of detection(LOD) but less than the limit of quantitation] in less than 10% of sampled foods, with concentrations ranging from 2 to 224 µg/kg. In a more recent Belgian study of VOC concentrations in 377 foods in 14 categories obtained from supermarkets, ethylbenzene was detected in 13 of 14 categories and 80% of samples (all except alcoholic beverages)[104]. Only maximum concentrations were presented in the publication; they ranged from 0.1 µg/kg in egg to 10 µg/kg in “fish and fish products”.
Most informative concerning current total dietary exposure in the United States are recent results from the Canadian Total Diet Study (CTDS)[105], selected as the basis for this updated exposure assessment. Ethylbenzene was detected in 139 of 153 composite food samples (91%). Summary statistics for the various food groups computed using USEPA’s ProUCL software[106] are presented in Supplementary Table 5. Infant formulas in the FDA TDS data sets considered in the VCCEP submission had ethylbenzene concentrations of 34 to 50 µg/kg. No detections in these products occurred in the 2002-2003 data sets available for the Sweeney et al. update, so the previous concentrations were used. Infant formulas sampled in the CTDS and used in the present assessment contained substantially lower concentrations of
Biomonitoring data
Ethylbenzene is not only well absorbed by oral and inhalation exposure routes and rapidly distributed throughout the body, but also metabolized and eliminated rapidly. However, because of its ubiquity in the environment, it and/or its metabolites are consistently detected in human tissues and excreta, including breath, blood, urine, and milk[8,15]. Thus, biomonitoring of blood and urine can provide a reliable dosimeter[107-109]. The availability of multiple two-year cycles of nationally representative blood and urine sampling conducted under the NHANES program in the United States and the Canadian Health Measures Survey (CHMS) in Canada provide objective exposure characterization in multiple demographic groups.
Blood
Nationally representative data for the United States and Canadian general populations from 2001 to 2018 are summarized in Supplementary Table 6. The lower LODs used in the Canadian studies enable the provision of central tendency (geometric mean) concentrations across sexes and all age groups of the general population. Although the lack of geometric mean concentrations in the NHANES data after the 2005-2006 cycle (due to non-detect rates greater than 40%) hinders international comparisons, 90th and 95th percentile values averaged over the three comparable cycles are similar in the two countries. Evaluating trends in five cohorts of cotinine-adjusted NHANES data from 1988-1991 vs. 1990-2000, Su et al. observed significant reductions in 50th, 75th, and 95th percentile ethylbenzene concentrations in blood, with a more pronounced reduction between 1999-2000 and 2003-2004 data sets (6.5% to 11.1%, depending on quantile) than between 1988-1991 and 2003-2004 data sets (4.2% to 4.9%)[110]. The 75th percentile ethylbenzene concentrations in subsequent NHANES data sets not included in the Su et al. analysis show further reductions after the 2005-2006 cycle, with 2017-2018 results 51% lower than those from 2003-2004[111,112]. From 2005-2012, ethylbenzene detection rates declined by more than 50% among both adolescents and adults, and unadjusted ethylbenzene concentrations declined by 19.3% in adolescents and 20% in adults for every two-year survey cycle[113]. Geometric mean blood ethylbenzene concentrations declined slightly but not significantly over the three CHMS cycles[114], and the 75th percentile declined to a similar modest extent over the past three NHANES cycles [Supplementary Table 6]. No notable differences between the countries in male and female blood ethylbenzene concentrations were apparent [Supplementary Table 7]. Concentrations in females were around 16% to 24% lower than those in males in both countries, depending on the percentile.
Less information is available on ethylbenzene levels in the tissues of children and older adults. The CHMS evaluated adult age ranges in more detail than NHANES, but increased ethylbenzene concentrations with age were apparent in both countries, which were comparable [Supplementary Table 8]. The Canadian data suggest an increase with age, peaking in the 40- to 59-year age group, and falling off slightly in the oldest group. This pattern may reflect greater traffic exposure during active working years. These data do not suggest that children’s internal exposure to ethylbenzene is greater than that of adults, but are insufficient to draw definitive conclusions. Data addressing potential racial/ethnic variation in ethylbenzene exposure are also sparse. Median ethylbenzene concentrations in samples from Mexican Americans, non-Hispanic Blacks, and non-Hispanic Whites were very similar in the three NHANES cycles between 2001 and 2006
In the TEAM studies, ethylbenzene concentrations were two to seven times higher in the exhaled breath of smokers vs. non-smokers in five United States cities[36]. In an evaluation of data from NHANES III (1988-1994), participants who smoked more than 20 pack-years had a three-fold increase in the likelihood of having elevated blood levels of ethylbenzene relative to non-smokers[117]. Although ethylbenzene concentrations in personal air samples did not differ significantly between smokers and non-smokers in the NHANES VOC study, Lin et al. reported significantly higher concentrations in smokers’ blood[43]. This is likely due to the fact that smokers receive concentrated exposures by inhaling mainstream smoke, while VOCs in side-stream smoke dissipate rapidly. Elevated ethylbenzene concentrations in blood were clearly associated with smoking in several more recent nationally representative studies in the United States and Canada [Table 2].
Comparison of ethylbenzene concentrations in blood of smokers vs. non-smokers (µg/L)
| Study | Statistic | Smoker | Non-smoker | Smoker: | Source |
| NHANES cycle | |||||
| 2003-2004 | GM | 0.068 | 0.028 | 2.4 | [118] |
| P95 | 0.160 | 0.071 | 2.3 | ||
| 2005-2006 | GM | 0.071 | 0.031 | 2.3 | [119] |
| 2005-2008 | GM | 0.083 | 0.026 | 3.2 | [120] |
| P95 | 0.210 | 0.075 | 2.8 | ||
| 2005-2012 (adults) | GM | 0.056 | 0.016 | 3.5 | [113] |
| 2013-2014 | GM | 0.062 | * | [121] | |
| P75 | 0.104 | < LOD | |||
| P90 | 0.15 | 0.035 | 4.3 | ||
| P95 | 0.189 | 0.054 | 3.5 | ||
| 2015-2016 | GM | 0.068 | * | ||
| P75 | 0.117 | < LOD | |||
| P90 | 0.167 | 0.034 | 4.9 | ||
| P95 | 0.202 | 0.056 | 3.6 | ||
| CHMS Cycle 4 (2014-2015) | GM | 0.061 | 0.022 | 2.8 | [122] |
| P95 | 0.13 | 0.068 | 3.1 | ||
| ATSDR health and exposure investigation (1993) | AMg | 0.170 | 0.100 | 1.7 | [123] |
| P50g | 0.160 | 0.048 | 3.3 | ||
| GuLF STUDY (2011-2013) | GM | 0.056 | 0.026 | 2.2 | [120] |
| P95 | 0.199 | 0.104 | 1.9 | ||
Chambers et al.[118] determined that cigarette smoke exposure was an “important” source of blood ethylbenzene in the NHANES 2003-2004 data set as determined by (1) differences in central tendency and interquartile VOC blood levels between smokers and non-smokers; (2) correlation between ethylbenzene and smoking biomarker (2,5-dimethylfuran) concentrations in the blood of daily smokers; and (3) regression modeling of ethylbenzene blood levels versus categorized cigarette consumption rate. Similar results were reported for subsequent NHANES data sets[113,119,120]. Jain observed that spending more than ten minutes in the presence of a smoker was associated with a 17.1% increase in blood ethylbenzene[113].
Based on NHANES 2005-2006 data, Jain identified “cutoff points” for distinguishing smokers from non-smokers ranging from 0.035 µg/L in the 12- to 19-year-old age group to 0.045 µg/L for non-Hispanic Whites and males[119]. Blood ethylbenzene concentrations were also higher among smoking participants in the Gulf Long-Term Follow-up Study (GuLF STUDY) [a prospective cohort study of individuals who participated in the Deepwater Horizon oil spill cleanup sponsored by the National Institute of Environmental Health Sciences(NIEHS)] than in combined NHANES 2005-2008 data sets, even after adjustment for blood 2, 5- dimethylfuran[120]. The CDC recently provided smoking-stratified data from the 2013-2014 and 2015-2016 cycles, also distinguishing the results by sex and age[121] [Table 2]. Concentrations of ethylbenzene in non-smokers’ blood could not be quantified at percentiles lower than the 90th, which were lower than geometric mean and median concentrations in smokers’ blood in all categories in both cycles. Examining 2014-2015 data from the CHMS, Faure et al. observed higher concentrations of ethylbenzene in blood from smokers vs. non-smokers, and the lower LODs allowed characterization of central tendency (geometric mean) concentrations. Ratios of geometric mean concentrations in smokers’ vs. non-smokers’ blood range from 2.2 to 3.2[122] [Table 2].
Given the much greater feasibility, and hence availability, of air measurements, efforts have been made to establish a distribution coefficient between ethylbenzene concentrations in air and blood for use in exposure and risk assessment. Lin et al. found a significant association between personal ethylbenzene concentrations in air and blood measured in the NHANES VOC study data set[43]. However, the linear correlation between air and blood concentrations was poor, indicating that large proportions of the variation in blood levels were related to factors other than the corresponding air concentrations. Values of R2 for correlation of ethylbenzene concentrations in blood and air increased significantly following adjustment for smoking, age, gender, body mass index (BMI), race/ethnicity, and alcohol consumption[43]. According to the calculated regression coefficient, blood ethylbenzene concentration would be 3.9 times higher in smokers than non-smokers. Jia et al. obtained a better fit between the same set of air and blood concentrations of ethylbenzene using multivariate linear regression to derive population-based blood/air distribution coefficients (popK; the ratio of blood to air concentrations)[124]. Primary determinants of ethylbenzene popKs were personal air concentration and smoking status; BMI and drinking water concentrations were not influential. According to the calculated regression coefficient, the average blood ethylbenzene concentration would be 2.7 times higher in smokers than non-smokers. This value accords well with geometric mean ratios [Table 2].
Based on CHMS data, Health Canada recently adopted a non-smoking population-level human biomonitoring reference value (RV95) of 0.078 µg/L for ethylbenzene[125]. The RV95 is defined as the 95th percentile concentration of the substance in the reference non-smoking population in cycle 3 (2012-2013), indicating the upper margin of the background exposure of the general population, thus enabling the comparison of the exposure of individuals or sub-populations to that of the general population[125]. Non-smokers’ 95th percentile blood ethylbenzene concentrations in both CHMS cycle 4 (0.068 µg/L) and the 2013-2014 and 2015-2016 NHANES cycles (0.054 and 0.056 µg/L, respectively) remain below the RV95 [Table 2]. In addition, all reported ethylbenzene blood concentrations in North American general populations (including smokers) are below the health-based BE of 0.45 µg/L[122].
Urine
Ethylbenzene exposure can also be biomonitored in urine by measuring either the parent compound[126-129] or urinary metabolites mandelic acid (MA) and phenylglyoxylic acid (PGA) [130-132]. To account for differences in urinary water content, results are often normalized by dividing by the urinary content of creatinine[133]. An advantage of urinary biomonitoring for VOC exposure is that metabolites have a longer biological half-life than parent chemicals in blood, and are more stable during storage and handling[134]. However, there are also significant disadvantages: (1) MA and PGA are metabolites of styrene as well as ethylbenzene; (2) the rate of ethylbenzene metabolism is strongly influenced by co-exposure to other common chemicals; and (3) urinary creatinine concentration varies with age, sex, and race/ethnicity (among other factors)[8,133], complicating attribution of group differences in urinary concentrations to differential exposure. Creatinine concentrations in urine samples from 22,245 participants in the Third NHANES (1988-1994) were consistently higher in males than females and in non-Hispanic Blacks than Whites and Mexican Americans, with the same pattern across age categories in all groups (lowest in children, highest in young adults, decreasing with age)[133].
Urinary MA and PGA have been measured in the NHANES program since 2005[111,121,135]. Sample-weighted median concentrations of the creatinine-normalized molar sum of MA + PGA from five rounds of nationally representative data collected under NHANES (2005-2016) are summarized in Supplementary Table 10. Variations by age, sex, and race/ethnicity are apparent, but, as noted above, the fact that urinary creatinine also varies with age, sex, and race/ethnicity complicates the interpretation of the differences. Thus, unadjusted geometric mean MA + PGA concentrations were slightly lower in females than males, but higher in females after creatinine adjustment[136]. No sex differences were observed in 6- to 11-year-olds in the 2011-2012 cycle[137].
Jain et al. reported that adolescents in the 2011-2012 data set had significantly lower urinary concentrations of creatinine-adjusted MA (but not PGA) than adults, while urinary MA concentrations were similar in 6- to 11-year-olds vs. adults[138,137]. The 2011-2012 VOC and metabolites in urine subsamples were withdrawn in May 2017 due to lot-to-lot variations in standard materials, and a corrected data set was republished in July 2017[139]. Any impacts on Jain’s determination of statistical significance are unknown, but qualitatively similar relationships are apparent in the NHANES 2015-2016 data, and creatinine-normalized MA + PGA were highest in the youngest age category (3 to 5 years) were slightly lower than those in 6- to 11-year-olds, over 20-year-olds, and the total population, and slightly higher than those in 12- to 19-year-olds. Not surprisingly, given the lower creatinine levels in children, 3- to 5-year-olds had the lowest unadjusted MA and PGA concentrations at all percentiles (data not shown). These data do not suggest higher exposures in younger children, but are insufficient to draw any conclusions.
Averaging geometric mean creatinine-adjusted summed molar MA + PA concentrations over the 2011-2012, 2013-2014, and 2015-2016 cycles, concentrations were lowest in Mexican Americans and similar in non-Hispanic Whites and non-Hispanic Blacks. Unadjusted concentrations were higher in non-Hispanic Blacks than non-Hispanic Whites (data not shown). Creatinine-normalized PGA (but not MA) concentrations were significantly higher in non-Hispanic White than non-Hispanic Black 6- to 11-year-olds in the 2011-2012 cycle[137].
Capella et al. reported that urinary levels of creatinine-normalized MA, PGA, and MA + PGA were all higher in smokers than non-smokers in the 2005-2006 and 2010-2011 NHANES cycles, around two-fold overall[136] [Supplementary Table 11]. Regression analysis showed that both MA and PGA correlated with serum cotinine in smokers in a concentration-related manner. They concluded that smoking is a significant source of ethylbenzene exposure. Urinary concentrations of creatinine-normalized MA were reported to be non-significantly elevated in smokers vs. non-smokers in both adults and adolescents in the 2011-2012 NHANES data set[138,140]. A clear difference between smokers and non-smokers was evident in all demographic categories in the 2012-2013 and 2014-2015 cycles [Table 3]. Smoking was also positively associated with creatinine-normalized MA in pregnant women surveyed in the 2009-2010 National Children’s Vanguard Study[141]. Creatinine-normalized MA and PGA were measured in urine samples from adult tobacco users and non-users participating in Wave 1 of the Population Assessment of Tobacco and Health (PATH) study conducted in 2013-2014[142]. Four user groups with established exclusive tobacco consumption habits were compared: combustible product users, electronic nicotine delivery systems(ENDS) users, smokeless product users, and never users. Creatinine-normalized MA and PGA concentrations followed the pattern Smokers > ENDS Users ≈ Smokeless Users > Never Users, with concentrations in smokers around twice those in non-smokers. The fact that the difference in concentrations of ethylbenzene itself in urine samples from smokers vs. non-smokers in a recent Italian study was only 1.2-fold (although statistically significant)[143] may reflect the contribution of styrene and/or enhanced ethylbenzene metabolism to elevated MA and PGA concentrations in the smokers’ urine.
Comparison of sample-weighted creatinine-normalized ethylbenzene metabolite concentrations in urine of smokers vs. non-smokers, NHANES survey years 2013 to 2016
| Demographic group | NHANES | MA Median (GM, 75th %ile) | PGA Median (GM, 75th %ile) | Molar sum MA + PGA Median (GM, 75th %ile) (µmol/g creatinine) | |||
| Non-smoker | Smoker | Non-smoker | Smoker | Non-smoker | Smoker | ||
| Total population | 2013-14 | 119 (116, 170) | 233 (228, 358) | 183 (175, 251) | 312 (307, 457) | 2.00 (1.93, 2.79) | 3.61 (3.54, 5.40) |
2015-16 | 123 (124, 166) | 269 (259, 384) | 208 (200, 275) | 353 (341, 483) | 2.19 (2.15, 2.92) | 4.12 (3.97, 5.74) | |
| 20-49 years | 2013-14 | 117 (113, 168) | 215 (215, 342) | 170 (164, 226) | 290 (284, 426) | 1.90 (1.84, 2.61) | 3.34 (3.30, 5.09) |
2015-16 | 119 (121, 162) | 234 (229, 349) | 186 (183, 258) | 316 (300, 416) | 2.02 (2.01, 2.78) | 3.64 (3.50, 5.06) | |
| 50+ years | 2013-14 | 122 (120, 174) | 285 (268, 400) | 202 (189, 272) | 373 (365, 506) | 2.15 (2.05, 2.96) | 4.36 (4.19, 6.00) |
2015-16 | 129 (129, 174) | 308 (320, 442) | 229 (223, 292) | 421 (421, 542) | 2.37 (2.33, 3.09) | 4.83 (4.91, 6.52) | |
| Female | 2013-14 | 130 (126, 191) | 254 (254, 373) | 185 (187, 270) | 342 (337, 495) | 2.09 (2.07, 3.05) | 3.95 (3.91, 5.75) |
2015-16 | 132 (133, 178) | 299 (290, 409) | 218 (215, 294) | 369 (375, 520) | 2.32 (2.31, 3.13) | 4.42 (4.40, 6.15) | |
| Male | 2013-14 | 108 (105, 151) | 196 (205, 335) | 170 (162, 229) | 287 (282, 415) | 1.84 (1.77, 2.52) | 3.20 (3.23, 4.97) |
2015-16 | 115 (114, 148) | 233 (235, 347) | 191 (183, 252) | 331 (314, 450) | 2.03 (1.97, 2.65) | 3.74 (3.64, 5.28) | |
A study comparing urinary analyte concentrations in non-smokers across three NHANES cycles (2005-2006, 2011-2012, and 2013-2014) reported that creatinine-normalized PGA concentrations increased significantly from 2005 to 2014 (around two-fold), the highest increase of all metabolites examined), leading the authors to conclude that ethylbenzene/styrene exposure to the general population had increased despite decreasing ambient concentrations[144]. However, the fact that concentrations of MA remained unchanged over this interval appears incompatible with this interpretation. Examining data from each cycle, concentrations of both metabolites in 2015-2016 were similar to those in 2011-2012 and 2013-2014; the increase in PGA occurred only between 2005-2006 and 2011-2012, and was not continued in later cycles. A smaller increase was seen in unadjusted PGA. Overall, these results appear more suggestive of an anomaly related to PGA quantitation in the 2005-2006 cycle than a significant change in ethylbenzene/styrene exposure over this period.
Milk
Because volatile compounds such as ethylbenzene can readily partition from blood into human milk, breastfeeding is a potentially complete exposure pathway for nursing infants[145-147]. There are few data available concerning the transfer of ethylbenzene from maternal tissues to young infants via breastfeeding. In 1980, the USEPA reported the detection of ethylbenzene in eight samples of milk from women in five United States cities[148]. Pellizzari et al. detected ethylbenzene in eight of 12 milk samples of human milk collected in four urban areas[149]. Ethylbenzene was detected in the majority of milk samples from twelve women in the Baltimore, MD metropolitan area at concentrations ranging from 0.053 to 0.58 µg/L, with a mean of 0.232 µg/L and median of 0.149 µg/L[150]. Detection of several VOCs, including ethylbenzene, in control samples left exposed to room air while study participants collected their samples demonstrated the propensity for partitioning of environmental VOCs into expressed milk. No information was provided as to the smoking status of these participants. It is likely that women who smoke would have higher concentrations of ethylbenzene in milk than non-smokers, but no relevant data were identified to confirm or refute this supposition.
In the previous ethylbenzene exposure assessments, ethylbenzene concentrations in milk were conservatively estimated for both the general population and production workers assuming that ethylbenzene concentrations in milk are at equilibrium with those in maternal blood, with an estimated milk:blood partition coefficient of 3 based on analogy to the structurally similar compounds benzene, toluene, xylenes, and styrene, which had measured milk: blood partition coefficients of 2.04-2.98[145].
Central tendency ethylbenzene concentrations in milk for the general population and occupationally exposed mothers were 0.11 µg/L and 2.2 µg/L, respectively, and upper bound concentrations were 0.25 µg/L and 21 µg/L, respectively. As discussed previously, ethylbenzene concentrations in both air and blood have decreased over time. Thus, it is likely that the general population milk concentrations used in the previous assessments overestimate current concentrations. Nonetheless, these values are retained in the current assessment.
STYRENE PRODUCTION WORKER EXPOSURES
A survey of United States manufacturers of ethylbenzene conducted by the Styrene and Ethylbenzene Association, referred to in the 1990 ATSDR Toxicological Profile for Ethylbenzene (superseded) as a written communication dated 1990, indicated that typical workplace exposure levels of ethylbenzene in styrene and/or ethylbenzene processing plants were in the range of 0.1-1 parts per million (ppm) (434-4,343 μg/m3) for an 8-hour TWA. More recent survey data were available for this exposure assessment. Personal exposure concentrations at ten styrene production facilities collected over the 20-year period 2000 to 2020 were compiled and evaluated to characterize current ethylbenzene exposures to production workers. The complete data analysis report, including all the individual exposure measurements together with the sampling and analytical methods used, is provided in Supplementary Attachment A. Both short-term (59 minutes or less) and long-term (one to 12 hours) measurements were gathered, along with ancillary information on job description, sampling duration, engineering controls, and analytical methods. Monitored workers were engaged in six job categories with varying potentials for exposure. The measurements associated with each job category were segregated according to the sampling duration. The stratified values from each company were then pooled according to the job description and sample duration, then randomized to anonymize their source. If the sampling duration was greater or less than 15 minutes for short-term samples or 480 minutes for long-term samples, the TWA was commensurately adjusted by dividing the concentration-duration cross product by an averaging time of either 15 or 480 minutes(since many of the examined datasets included an appreciable number of samples with exposure durations greater than 15 or 480 minutes, this normalization approach yielded conservative estimates of the actual TWA) using standard assumptions[151,152].

Because the focus of this assessment is long-term exposure, only the 527 8-hour TWA results are further discussed here (complete data sets are provided in Supplementary Attachment A). Sample sizes ranged from 7 to 280 for the different job categories, with the largest number of samples collected for System Operators (280). As in the previous survey, a high percentage of results was below the LOD: the non-detect percentage for the entire long-term dataset was 87%, ranging from 57% to 90% for individual job categories. This high percentage of non-detects precluded the use of robust statistical substitution techniques[153]. Therefore, non-detected samples were assigned a usable value by the simple substitution method of dividing the LOD by the square root of two (1.414)[154]. The resulting uncensored and time-normalized values were analyzed using USEPA’s ProUCL software (v 5.1)[155,156]. Statistical outliers were flagged for each dataset, but retained in the absence of justification for their removal. Likely due to the high percentage of non-detect values, goodness-of-fit tests showed that the distribution pattern for many of the individual job function datasets could not be determined. If a dataset was lognormally distributed, then a Chebyshev minimum variance unbiased estimate (MVUE) of the upper confidence limits was reported, since it provides the best estimates of the high-end exposure values with this type of distribution[156,157]. In those instances where the distributions were not lognormal, a nonparametric method was applied that was not dependent on the distribution type. In these cases, the nonparametric Chebyshev Inequality method was used to obtain values at the 75th, 90th, and 95th percentiles[157,158]. Descriptive statistical summaries were generated for each dataset
Statistical summary of 8-hour time-weighted average personal ethylbenzene concentrations in styrene production plants by job category, 2000 to 2020
| Job category | Sample size | Detection frequency | Range (ppm) | Minimum variance unbiased estimate (ppm) | |
| Mean (SD) | 95% UCL | ||||
| Supervisors/Administrators | 10 | 20% | 0.03-1.20 | 0.20 (0.36) | 0.407 |
| System Operators | 280 | 13% | 0.003-2.67 | 0.13 (0.28) | 0.200 |
| Maintenance Mechanics | 81 | 16% | 0.002-9.90 | 0.30 (1.20) | 0.853 |
| Equipment Cleaners | 128 | 10% | 0.007-2.00 | 0.12 (0.25) | 0.215 |
| Sampling Technicians | 7 | 43% | 0.010-0.34 | 0.13 (0.11) | 0.411 |
| Laboratory Personnel | 21 | 10% | 0.006-0.21 | 0.12 (0.08) | 0.196 |
Personal 8-hour TWA ethylbenzene concentrations for the six job categories were notably similar, with means ranging from 0.12 to 0.30 ppm (434 to 999 µg/m3) and 95% UCL personal 8-hour TWA ethylbenzene concentrations ranging from 0.12 to 0.30 ppm (521 to 1,303 µg/m3) and 95% UCL personal 8-hour TWA ethylbenzene concentrations ranging from 0.196 to 0.853 ppm (851 to 3704 µg/m3). A comparison of the results from this earlier survey with those described in this report show relatively good agreement
Given the similarity of the recent styrene production worker survey with previous results, it is reasonable to retain the production worker exposure estimates used in the VCCEP submission and the update by Sweeney et al.: 0.1 ppm (434 µg/m3) as the central tendency, and 1 ppm (4343 µg/m3) as the upper bound.
INTAKE ESTIMATION
Inhalation intake estimation
Current USEPA guidance recommends that potential inhalation hazards and risks should be computed based on exposure concentrations rather than estimated intakes, and states that no adjustment of exposure concentrations is necessary for children other than activity-weighting[17]. However, in order to estimate the relative contribution of the inhalation vs. dietary routes to overall ethylbenzene intake, daily intakes were calculated from representative personal air concentrations using recommended default age-specific inhalation rates and body weights[72].
Two important modifying factors should be accounted for in calculating absorbed intakes of ethylbenzene via inhalation: (1) a pulmonary absorption fraction (PAF) representing the degree of uptake across the respiratory tract; and (2) a smoking adjustment factor (SAF) representing the contribution from smoking that is evident in biomonitoring if not air monitoring data. In the absence of human data at relatively low environmental ethylbenzene concentrations and/or widely accepted values, the previously used default PAF of 100% was chosen for this assessment. This conservative assumption is considered appropriate given the broad scope of the assessment as well as its comparability with earlier works. Measured and modeled smoking-related increases in geometric mean blood ethylbenzene concentrations due to smoking ranged from 2.2- to 3.2-fold [Table 2], and increases in urinary metabolites were around two-fold [Table 3]. Jia et al. quantified an inverse relationship between log popK (ratio of blood: air concentration) and log air concentration for ethylbenzene and other VOCs based on the nationally representative NHANES VOC subsample data set[124]. These results support the application of SAFs for airborne ethylbenzene concentrations of 2.7 (ratio of mean smoking: smoking popKs) for the central tendency and 2.0 [ratio of minimum smoking: smoking popKs (representative of higher air concentrations)] for the upper bound. Central tendency and upper bound estimates of absorbed ethylbenzene intake via inhalation are therefore calculated as:

where:
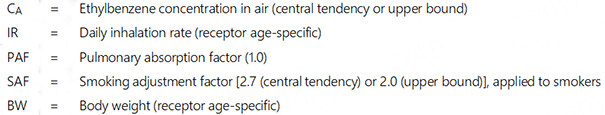
Occupational exposure is of course much higher than that experienced by the general population, and the effect of smoking decreases with airborne concentration. Therefore, occupational exposures were not adjusted for smoking. They were adjusted by the default occupational exposure frequency of 250 days per year[159]. Calculated age-specific central tendency and upper-bound ethylbenzene intakes via inhalation are presented in Supplementary Table 12.
The proportion of quantified emissions currently attributable to the ethylbenzene/styrene production chain of commerce in the latest available USEPA National Emissions Inventory data (2017) is very small (around 0.1% of total emissions when considering the major NAICS categories 325211, 325212, and 326140[160], an order of magnitude lower than assumed in both the VCCEP submission and Sweeney et al.[18]). Because the chain of commerce contribution to outdoor levels is very small, and that to indoor air has not been specifically quantified but also appears to be very small, the assumption that the chain of commerce contributes about 0.1% of total ambient ethylbenzene levels appears reasonable. Thus, the ethylbenzene/styrene chain of commerce is likely to contribute no more than one one-thousandth of the general population’s total inhalation exposure to ethylbenzene.
Dietary intake estimation
Young children
The VCCEP submission calculated central tendency and upper-bound ethylbenzene intakes in breastfed (0.009 and 0.02 µg/kg, respectively) and formula-fed infants (0.18 and 1.7 µg/kg, respectively). Using the same ethylbenzene concentrations in milk and formula, Sweeney et al. calculated infants’ intakes according to USEPA’s currently recommended infant age groups (0 to < 1 month; 1 to < 3 months; 3 to < 6 months; and 6 to < 12 months)[72,161]. Their one-year time-weighted central tendency and upper-bound ethylbenzene intakes were 0.012 and 0.02 µg/kg, respectively, for breastfed infants and 3.6 and 5.2 µg/kg BW-day for formula-fed infants. Despite relying on the same source media concentrations, estimated ethylbenzene intakes were higher in the Sweeney et al. evaluation due to the relatively high intake rates by infants less than six months old. With regard to breastfed infants, the current calculations differ from those of Sweeney et al. only in using 95th percentile rather than central tendency milk/formula ingestion rates for the upper bound calculations. Estimated intakes by formula-fed infants, based on CTDS data, are only slightly higher than those in breastfed infants. Of course, the breastfed worker’s infant has a much greater intake
Young children’s consumption of foods other than formula or mother’s milk was not accounted for in the previous assessments. For this updated evaluation, dietary intakes of ethylbenzene for children in the birth to one-year and 1- to < 2-year-old age groups were obtained by matching foods containing ethylbenzene identified by Cao et al.[105] with mean and 95th percentile food category intake rates derived in USEPA’s Exposure Factors Handbook from data from the 2006-2006 NHANES[72]. Formula dominated exposure in bottle-fed infants, while the greatest contributors to ethylbenzene intake were total fats and dairy in breastfed infants [Supplementary Figure 1]. Lactational transfer of ethylbenzene therefore appears not to be an exposure pathway of concern for the general population. However, intakes could be substantially higher (20- and 84-fold at central tendency and upper bound, respectively) if a breastfeeding mother is heavily exposed at work [Supplementary Table 13].
As in the previous assessments, children older than one year were assumed to no longer be breastfed or receive formula. Central tendency and upper bound dietary intakes of ethylbenzene for children in the 1- to < 2-year age group were evaluated by multiplying mean and 95th percentile food category intake rates recommended by USEPA[72] by ethylbenzene concentrations in corresponding foodstuffs reported by Cao et al.[105]. Dairy products provided the greatest exposure in these young children, followed by meats and total fats [Supplementary Figure 2]. These central tendency and upper bound total dietary intakes, 0.11 and 0.23 µg/kg BW-day, respectively, are around three to six times lower than those calculated in the VCCEP submission (0.07 and 0.8 µg/kg BW-day, respectively) and by Sweeney et al. (0.65 and 1.25 µg/kg BW-day, respectively) based on older FDA food concentrations and intake assumptions[18].
Older children and adults
In the VCCEP submission[6], central tendency and upper-bound estimates of total ethylbenzene intake from the diet were calculated for prospective parents and children by combining the mean and maximum concentrations of ethylbenzene measured in FDA market basket surveys for the four years 1998 to 2001 with age group-specific estimates of the daily consumption rates of each food. A similar analysis was performed by Sweeney et al., with dietary intakes estimated using an additional year of FDA market basket data and adjusted to comport with USEPA’s recommended age groups for risk assessment (1 to < 2 years, 2 to < 3 years, 3 to < 6 years, 6 to < 11 years, 11 to < 16 years, and 16 to < 21 years)[18,72,161]. Very similar results were obtained using both approaches, with intakes decreasing with age, from about 0.7 to 0.07 µg/kg BW-day for central tendency and about 1.2 to 0.15 µg/kg BW-day for upper bound. This upper bound is similar to the FDA CEDI daily intake estimate of 0.15 µg/kg BW-day via migration from food packaging and contact materials, although the underlying assumptions for this value were not provided[102].
To provide updated estimates across the entire life span, the present evaluation calculated mean ethylbenzene intakes from major food groups for people over two years of age by matching foods containing ethylbenzene identified by Cao et al. with the USDA’s most recent (2007-2008) sex- and age group-specific consumption rates for corresponding foods[105,162]. This data set is based on national estimates of the amounts of retail-level commodities consumed per person estimated in the What We Eat in America National Health and Nutrition Examination Survey (WWEIA, NHANES). Although there is an incomplete overlap of foods and the USDA age groupings differ from USEPA’s, the greater definition of foods ingested allows for a clearer understanding of which dietary items are relatively significant sources of dietary ethylbenzene exposure. A similar approach has been used to estimate dietary exposure to styrene[163,164].
Lacking both upper bound concentrations in foods and intake rates, only central tendency dietary intake rates for males and females over two years of age were calculated. Female intakes were slightly lower than those of males in all age groups. For broad applicability, results for the sexes were averaged. Mean age-dependent ethylbenzene intakes by major food types are shown in Supplementary Figure 3. As observed in the previous evaluations, the total dietary intake of ethylbenzene decreased with age, with central tendency values ranging from 0.01 to 0.04 µg/kg BW-day. The animal protein category (meat, poultry, fish, eggs) was the major dietary source in all age groups. These ethylbenzene dietary intakes for older children and adults are around an order of magnitude lower than those calculated in the previous evaluations, but similar to other published values. Given the improved accuracy of both concentrations in food and intake rates, the present results provide a reasonable estimate of total dietary exposure to ethylbenzene. However, because only central tendency intake estimates could be calculated, the range of possible dietary intakes is unknown.
Ethylbenzene/styrene chain of commerce contribution to dietary intake
Ethylbenzene concentrations in the total diet as consumed were calculated from FDA TDS data in the VCCEP submission (central tendency and upper bound ranges of around 2 to 8 µg ethylbenzene/kg total diet and 5 to 12 µg ethylbenzene/kg total diet, respectively), allowing calculation of a range of fractions attributable to migration of 6 to 21% (increasing with age)[6]. The FDA’s CEDI database estimated an order-of-magnitude higher dietary migration-derived concentration of 3 µg/kg[102], which would imply a much larger contribution from food packaging and contact materials, exceeding 100% in some cases. As-consumed whole-diet ethylbenzene concentrations were not calculated in the present assessment, but the average and 95th percentile ethylbenzene concentrations in CTDS foods of 3.8 and 6.1 µg/kg, respectively, can be compared to estimates of contributions via migration. Based upon the Lickly estimate (0.45 µg/kg), average and 95th percentile contributions from migration would be 7% to 12%, respectively (in keeping with the VCCEP estimate), and 49% to 79%, respectively, based upon the FDA’s estimate. As the basis of the CEDI value was not provided, it is considered less reliable than Lickly’s estimate. The fact that estimated central tendency dietary intakes for people aged 2 years and up (0.01 to 0.04 µg/kg BW-day)
Total intake estimation
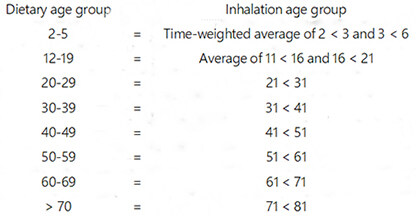
Because the age groupings used to calculate inhalation and dietary intakes for the general population differ slightly, inhalation age groupings were adjusted for compatibility as follows:
Calculated ethylbenzene intakes to the general population via inhalation and ingestion were summed in order to: (1) estimate total intakes for the various age groups; (2) determine the relative contributions of the two main exposure routes considered; and (3) identify any notable relationships of exposure patterns with age. Central tendency and upper bound inhalation and dietary intakes for all age groups, including the breastfed infants of working mothers, are summarized in Table 5. The relative contributions of the central tendency values for inhalation (non-smoking and smoking adult) and ingestion intakes in the various age groups are depicted in Figure 2. Both inhalation and ingestion intakes decreased with increasing age, but inhalation is clearly the strongly dominant route of exposure for all age groups. Because smoking multiplies ethylbenzene intake by at least a factor of two, it appears to be the largest source of ethylbenzene exposure for adults. There is an approximately 12-fold difference between total central tendency intakes by non-smokers and upper bound intakes by smokers in all relevant age groups. These intake estimates are substantially lower than those calculated in the prior two exposure assessments due to decreases in both airborne and dietary concentrations.

Figure 2. Age-dependence and relative contribution of the ingestion and inhalation exposure routes to total central tendency ethylbenzene intakes (µg/kg BW-day).
Central tendency and upper bound total ethylbenzene intake estimates for all age groups (µg/kg BW-day)
| Age group | Central tendency | Upper bound | ||||||||
| Inhalationa | Ingestionb | Total | Inhalationa | Ingestionb | Total | |||||
| Non-smoking | Smoking | Non-smoking | Smoking | Non-smoking | Smoking | Non-smoking | Smoking | |||
| 0-1 | 1.01 | 0.07 | 1.08 | 1.08 | 6.70 | 0.20 | 6.91 | 6.91 | ||
| 0-1 (worker) | 1.01 | 0.23 | 1.24 | 1.24 | 6.70 | 3.20 | 9.90 | 9.90 | ||
| 0-1 (formula) | 1.01 | 0.10 | 1.11 | 1.11 | 6.70 | 0.26 | 6.96 | 6.96 | ||
| 1-2 | 1.19 | 0.11 | 1.30 | 1.30 | 7.93 | 0.23 | 8.16 | 8.16 | ||
| 2-5 | 0.97 | 0.04 | 1.01 | 1.01 | 6.42 | 0.04 | 6.47 | 6.47 | ||
| 6-11 | 0.40 | 0.02 | 0.42 | 0.42 | 2.64 | 0.03 | 2.67 | 2.67 | ||
| 12-19 | 0.42 | 1.04 | 0.01 | 0.44 | 1.06 | 2.80 | 3.19 | 0.02 | 2.81 | 3.21 |
| 20-29 | 0.33 | 0.90 | 0.01 | 0.35 | 0.91 | 2.22 | 4.44 | 0.01 | 2.23 | 4.45 |
| 30-39 | 0.34 | 0.92 | 0.01 | 0.35 | 0.93 | 2.26 | 4.52 | 0.01 | 2.27 | 4.53 |
| 40-49 | 0.34 | 0.92 | 0.01 | 0.35 | 0.93 | 2.26 | 4.52 | 0.01 | 2.27 | 4.53 |
| 50-59 | 0.33 | 0.90 | 0.01 | 0.35 | 0.91 | 2.22 | 4.44 | 0.01 | 2.23 | 4.45 |
| 60-69 | 0.30 | 0.81 | 0.01 | 0.31 | 0.83 | 2.01 | 4.01 | 0.01 | 2.02 | 4.02 |
| > 70 | 0.27 | 0.74 | 0.01 | 0.28 | 0.75 | 1.82 | 3.64 | 0.01 | 1.83 | 3.66 |
It is informative to compare them with median and 95th percentile estimates of average (geometric mean) ethylbenzene intakes for general population subgroups calculated using a meta-model developed as part of USEPA’s ExpoCast initiative [Supplementary Table 14][165]. A consensus meta-model was created using the Systematic Empirical Evaluation of Models framework, in which a variety of predictors of human exposure were combined by exposure pathway and weighted according to the predictive ability for chemical intake rates inferred from human biomonitoring data. The differences between median and 95th percentile estimates range from around 50- to 100-fold, much greater than the results of this assessment, which are arrayed between them (the 20- to 65-year-old age group approximated by averaging groups between 20 to 29 and 60 to 69, and equating > 70 to 65 + ) [Supplementary Figure 4]. This comparison suggests that calculations based on diet and personal air, even with adjustment for smoking, are reasonable for estimates of central tendency but may not capture extreme exposures.
The ExpoCast model is a screening tool for the rapid identification of potential risks and has not been empirically validated. A more definitive means of evaluating the results of this assessment and gauging the ranges of ethylbenzene to the general population is provided by the nationally representative concentrations of ethylbenzene in blood, a direct measure of internal exposure. As discussed previously, Aylward et al. (2010) derived a pharmacokinetic regression coefficient relating steady-state blood concentrations of ethylbenzene with steady-state oral intakes of 21 µg/L per mg/kg BW-day. Because CHMS data provide more complete distributions than NHANES (and the two are very similar in upper percentiles), median and 95th percentile ethylbenzene 95% confidence intervals for all age groups averaged over three CHMS cycles (2012-2017) were used to calculate corresponding daily ethylbenzene intakes. Calculated intakes in the present assessment were adjusted to match CHMS age groups by averaging age groups 20 to 29 and 30 to 39, 40 to 49 and 50 to 59, and 60 to 69 and > 70.
Because the blood data included smokers, the fact that intakes calculated for non-smokers were below the lower 95% confidence intervals of the median and 95th percentile blood-based estimates is not surprising

Figure 3. Comparison of calculated central tendency and upper-bound ethylbenzene intakes with ranges of 95% confidence intervals of median (A) and 95th percentile (B) intakes estimated from CHMS blood monitoring data (2012 to 2017).
DISCUSSION
This document updates two comprehensive exposure assessments conducted in the past 15 years for the principal purpose of characterizing sources, pathways, magnitudes, and trends in ethylbenzene exposures experienced by adults and children in the general population and ethylbenzene/styrene production workers[6,18]. The VCCEP’s limited success was in large part an inevitable function of the pioneering nature of the endeavor, and the sparsity of necessary data rendered its goals more aspirational than achievable. The fact that considerable new data have been gathered and modeling strategies have evolved over the ensuing 15 years, allowing more detailed and accurate exposure and risk characterization, must be credited in some probably large part to the questions raised, data gathered, and lessons learned from the VCCEP.
Whereas the VCCEP submission applied literature-derived indoor/outdoor ratios to ambient air data and time apportionment in microenvironments to calculate inhalation exposures, Sweeney et al. and the present assessment were able to use personal exposure data that inherently integrates contributions from all sources[18]. As such, personal air concentrations are considered the most accurate basis for evaluating inhalation exposure to ethylbenzene for the general population. Central tendency and upper bound concentrations used in the present assessment, 1.7 and 11.9 µg/m3, respectively, are 41% and 20% lower than those used by Sweeney et al. External exposure decreases are complemented by biomonitoring data, reflecting (and presumably due to) reductions in emissions and airborne concentrations. It is noteworthy that (1) children’s personal air concentrations do not appear to differ from those of cohabiting adults; and (2) ethylbenzene concentrations in children’s blood (albeit limited) appear to be lower than those in adults across both NHANES and CHMS cycles. Unlike older age groups (which include smokers), the average 95t percentile ethylbenzene concentration in children aged 12 to 19 years over the past seven NHANES cycles (2005-2018) is below Health Canada’s biomonitoring RV95 of 0.078 µg/L, as is the average 95t percentile of this age group in the three CHMS cycles (2012-2017).
Although smoking does not notably increase indoor or even personal air concentrations, it is a major contributor to internal ethylbenzene exposure, as evidenced by elevated biomarkers of exposure in smokers’ blood and urine. Interpretation of urinary metabolite data is complicated by their non-exclusive relationship to ethylbenzene and the effects of age-, sex-, and race/ethnicity-related variations in urinary creatinine levels[133], but their elevation in smokers is unequivocal. Maximum 95th percentile ethylbenzene concentrations in blood from all groups in all NHANES cycles since at least 1988, as well as all available CHMS cycles, including available samples from smokers in both countries, are below the BE of 0.45 µg/L. Like those in personal air, ethylbenzene concentrations in nationally representative North American blood samples do not indicate higher exposures in children. The new survey of workplace concentrations did not alter the conservatively estimated central tendency and upper-bound ethylbenzene concentrations for production workers (434 and 4343 µg/m3, respectively) used previously. These concentrations are well below the ACGIH occupational exposure guideline [20 ppm (86,855 µg/m3)].
Limited data indicate that home use of products in both the refinery and ethylbenzene/styrene chains of commerce, such as small engines, paints, lacquers, stains, varnishes, and sealers, can result in transient “near-field” exposures to both adults and children that may rival some occupational exposure levels. In addition, highly sophisticated models designed for rapid screening of large numbers of products predict high ethylbenzene exposures to home users, especially children. However, while useful for identifying products with the highest exposure potential (as expected, certain paints, strippers, and sealers), modeled exposure estimates have not yet been validated empirically.
In both the VCCEP submission and the update by Sweeney et al., United States styrene production workers’ exposures to ethylbenzene were used on account of their (1) relatively comprehensive characterization of occupational exposures in the ethylbenzene/styrene chain of commerce (of greatest relevance in the VCCEP); and (2) their relevance with regard to exposure levels in many other workplaces[18]. An updated survey of personal exposure concentrations at ten styrene production facilities collected over the 20-year period 2000 to 2020 available for this assessment yielded similar results. As in the previous survey, high percentages of results were below the LOD, ranging from 57% to 90% for individual job categories. Given this fact, retaining the prior production worker exposure estimates [0.1 ppm (434 µg/m3) as the central tendency and 1 ppm (4343 µg/m3) as the upper bound] is clearly conservative for ethylbenzene/styrene production workers.
Dietary ethylbenzene intakes for infants, children, and adults of various ages were calculated based on concentrations in food and default age-specific ingestion rates. Because there are few empirical data available concerning the transfer of ethylbenzene from maternal tissues to young infants via breastfeeding, a PBPK model was developed for the VCCEP submission to conservatively estimate exposure for children up to one year old (for both the general population and production workers). In the absence of superseding information, it was also adopted by Sweeney et al. and for the present assessment. The VCCEP submission calculated central tendency and upper-bound ethylbenzene intakes for infants assuming a constant consumption rate and body weight over the first year. Using the same ethylbenzene concentrations in milk and formula, Sweeney et al. calculated infants’ intakes according to infant age groupings (0 to < 1 month; 1 to < 3 months; 3 to < 6 months; and 6 to < 12 months) established by USEPA to better characterize young children’s exposures. Despite relying on the same milk and formula concentrations, estimated ethylbenzene intakes were higher in Sweeney et al. than the VCCEP submission on account of the relatively high intake rates by infants less than six months old. With regard to breastfed infants, the present calculations differ from those of Sweeney et al. only in using 95th percentile rather than central tendency milk/formula ingestion rates for the upper bound calculations. A key feature of the CTDS data set is much lower ethylbenzene concentrations in infant formula than in the TDS. The present intake estimates for formula-fed infants are thus considerably lower than those in the previous assessments. Whereas ethylbenzene intakes via formula previously dwarfed those from mother’s milk in the general population, they only slightly exceed those from breastfeeding in the present assessment. However, workers’ infants have much higher estimated ethylbenzene intakes via breastfeeding.
Young children’s consumption of foods other than formula or mother’s milk was not accounted for in the previous assessments. Although much less than previously, formula dominated ethylbenzene exposure in bottle-fed infants, while the greatest contributors in breastfed infants were total fats and dairy. Lactational transfer of ethylbenzene therefore appears not to be an exposure pathway of concern for the general population, but may be for workers’ infants, given the large differences in airborne ethylbenzene concentrations. Dairy products provided the greatest exposure in children older than one year, followed by meats and total fats. These dietary intakes are around three to six times lower than those calculated in the previous assessments based on older FDA food concentrations and intake assumptions. As observed in the previous assessments, dietary intake of ethylbenzene decreased with age. Female intakes were slightly lower than those of males in all age groups, and animal protein (meat, poultry, fish, eggs) was the major dietary source. Intakes for older children and adults are around an order of magnitude lower than those calculated in the previous assessments, but similar to other published values. Given the improved accuracy of both concentrations in food and intake rates, the present results are considered to provide an adequate estimate of total dietary exposure to ethylbenzene.
Ethylbenzene concentrations in the total diet as consumed were calculated from FDA TDS data in the previous assessments, allowing the calculation of a range of fractions attributable to migration from food packaging and contact materials of 6% to 21% (increasing with age group). As-consumed whole-diet ethylbenzene concentrations were not calculated in the present assessment, but based on the average and 95th percentile ethylbenzene concentrations in CTDS foods, average and 95th percentile contributions from migration would be 7% and 12%, respectively.
Comparing intakes via inhalation and ingestion, inhalation is the strongly dominant route of exposure for all age groups, contributing 93% to 95% of the estimated total central tendency intake across age groups. Because smoking multiplies ethylbenzene exposure by at least a factor of two, it is the largest source of ethylbenzene exposure for adults. The present ethylbenzene intake estimates are substantially lower than those calculated in the previous two exposure assessments due to decreases in both airborne and dietary concentrations. The fact that they are between median and 95th percentile estimates of geometric mean intakes derived from a high-throughput meta-model designed for rapid exposure assessment screening suggests that they do not capture upper bound exposures, perhaps such as those associated with household and consumer product use. However, the highly complex screening meta-model is heuristic, and the validity of its results for actual ethylbenzene exposures has not been established. Biomarkers of exposure, such as ethylbenzene concentrations in blood and urine, offer a more definitive means of evaluating exposure levels and trends, although given ethylbenzene’s rapid disposition, the nationally representative monitoring data sets are not directly informative with regard to transient high exposures.
Biomonitoring data are the “gold standard” of exposure assessment, and the expansion of demographic categories surveyed in the NHANES program provides much-needed insight into potential exposure differences across them. Particularly valuable with respect to the VCCEP are data for children. Given the higher inhalation and dietary intakes calculated for younger children, biomonitoring data to determine their internal exposures would be most informative. However, blood monitoring data are only available for older children (aged 12 to 19 years), and central tendency data in this group (and all others except smokers) have not been available in NHANES since the 2005-2006 cycle. In the CHMS cycles, blood ethylbenzene levels in 12- to 19-year-olds are the lowest of the four age categories, but this trend cannot be assumed to apply to younger children. The only relevant biomonitoring data located for younger children are the urinary metabolite sampling results in 3- to 5-year-olds in the 2015-2016 NHANES cycle. Neither creatinine-adjusted nor unadjusted data suggest higher internal exposure in this youngest group, but are not definitive. Although the sum of available external and internal ethylbenzene exposure data does not suggest health risks for any age group, additional biomonitoring data would fill an obvious data gap.
Lacking central tendency NHANES data, intakes corresponding to median and 95th percentile ethylbenzene blood concentrations in the CHMS survey were calculated using a steady-state regression coefficient for comparison with calculated intakes in the present assessment. The fact that intakes calculated for non-smokers were below the lower 95% confidence intervals of the median and 95th percentile blood-based estimates may be due to the inclusion of smokers in the sampled population. That calculated central tendency and upper bound results for smokers were within the median and 95th percentile ranges of intakes based on blood concentrations tends to support their validity and usefulness for risk assessment.
Based on current personal air monitoring, diet, and biomonitoring data, ethylbenzene exposures appear to have decreased for all age groups. Inhalation is the dominant route of exposure, and smoking is the dominant source. Children’s calculated ethylbenzene intakes from inhalation and the diet are greater than adults’, but both are low and have apparently decreased since the VCCEP submission. The assumed upper bound exposure concentration for ethylbenzene/styrene production workers is a twentieth of the lowest occupational guideline. Although an effort has been made to be comprehensive, the exposure pathways considered using traditional human health risk assessment methods may not capture all important exposures, especially those occurring “near-field” during the use of household and consumer products. The present results depict “typical” exposures reasonably well, as ascertained by comparison with nationally representative biomonitoring data and heuristic modeling results, but more work is needed to (1) ascertain children’s internal exposures via biomonitoring; and (2) identify and mitigate the source(s) contributing to upper bound exposures.
DECLARATIONS
Acknowledgments
We thank three anonymous reviewers for their helpful comments.
Authors’ contributions
Provided the updated worker exposure analysis and overall manuscript review: Morgott DA
Wrote other sections and was responsible for manuscript production: Kester JE
Availability of data and materials
Not applicable.
Financial support and sponsorship
The preparation of the manuscript was financially supported by the Styrene Information and Research Center (SIRC).
Conflicts of interest
This work was sponsored by the Styrene Information & Research Center (SIRC). The views expressed in this article are those of the authors, and do not necessarily reflect the official policy or position of SIRC.
Ethical approval and consent to participate
Not applicable.
Consent for publication
Not applicable.
Copyright
© The Author(s) 2023.
Supplementary Materials
REFERENCES
1. U.S. Environmental Protection Agency (USEPA). Voluntary Children’s Chemical Evaluation Program; notice. 2000. Available from: https://www.govinfo.gov/content/pkg/FR-2000-12-26/pdf/00-32767.pdf. [Last accessed on 9 Nov 2022].
2. Williams PR, Patterson J, Briggs DW. VCCEP pilot: progress on evaluating children’s risks and data needs. Risk Anal 2006;26:781-801.
3. Ashley DL, Bonin MA, Cardinali FL, McCraw JM, Wooten JV. Blood concentrations of volatile organic compounds in a nonoccupationally exposed US population and in groups with suspected exposure. Clin Chem 1994;40:1401-4.
4. Wallace LA, Pellizzari ED, Hartwell TD, et al. The TEAM study: personal exposures to toxic substances in air, drinking water, and breath of 400 residents of New Jersey, North Carolina, and North Dakota. Environ Res 1987;43:290-307.
5. Toxicology Excellence for Risk Assessment (TERA). Voluntary Children’s Chemical Evaluation Program (VCCEP) peer consultation meeting on ethylbenzene. Available from: https://tera.org/Peer/VCCEP/Ethylbenzene/EBWelcome.html. [Last accessed on 9 Nov 2022].
6. American Chemistry Council Ethylbenzene Panel (ACC). Voluntary Children’s Chemical Evaluation Program (VCCEP) Tier 1 pilot submission for ethylbenzene (CAS No. 100-41-4) 2007. Available from: https://tera.org/Peer/VCCEP/Ethylbenzene/VCCEP%20Ethylbenzene%20Revised%20Doc%20-august%2010%202007.pdf [Last accessed on 9 Nov 2022].
7. U.S. Environmental Protection Agency Office of the Inspector General (USEPA OIG). EPA’s Voluntary Chemical Evaluation Program Did Not Achieve Children’s Health Protection Goals. Report No. 11-P-0379. 2011. Available from: https://www.epa.gov/sites/default/files/2015-10/documents/20110721-11-p-0379.pdf [Last accessed on 9 Nov 2022].
8. Agency for Toxic Substances and Disease Registry (ATSDR). Toxicological profile for ethylbenzene. Available from: https://www.atsdr.cdc.gov/ToxProfiles/tp110.pdf [Last accessed on 9 Nov 2022].
9. IHS Markit. Ethylbenzene. Chemical economics handbook. Available from: https://ihsmarkit.com/products/ethylbenzene-chemical-economics-handbook.html. [Last accessed on 9 Nov 2022].
10. Miller R, Newhook R, Poole A. Styrene production, use, and human exposure. Crit Rev Toxicol 1994;24:S1-S10.
11. International Agency for Research on Cancer (IARC). IARC monographs on the evaluation of carcinogenic risks to humans. Volume 82: some traditional herbal medicines, some mycotoxins, naphthalene, and styrene. Available from: https://monographs.iarc.who.int/wp-content/uploads/2018/06/mono82.pdf [Last accessed on 9 Nov 2022].
12. Agency for Toxic Substances and Disease Registry (ATSDR), Department of Health and Human Services PHS. Toxicological Profile for Styrene. Available from: https://www.atsdr.cdc.gov/toxprofiles/tp53.pdf [Last accessed on 9 Nov 2022].
13. Environment and Climate Change Canada/Health Canada. Screening Assessment Report Ethylbenzene Chemical Abstracts Service Registry Number 100-41-4. 2016. Available from: https://www.ec.gc.ca/ese-ees/FE722725-DA50-458C-91C8-558DFEC57996/FSAR_Ethylbenzene_EN.pdf [Last accessed on 9 Nov 2022].
14. World Health Organization (WHO). Ethylbenzene; 1996. Available from: https://apps.who.int/iris/handle/10665/41867?locale-attribute=pt [Last accessed on 9 Nov 2022].
15. International Agency for Research on Cancer (IARC), World Health Organization. IARC monographs on the evaluation of carcinogenic risks to humans. Volume 77: some industrial chemicals. Available from: https://monographs.iarc.who.int/wp-content/uploads/2018/06/mono77.pdf [Last accessed on 9 Nov 2022].
16. U.S. Environmental Protection Agency (USEPA). Air Data: Annual Summary Data. Last Modified 11/24/2021. Accessed December 2021. Available from: https://aqs.epa.gov/aqsweb/airdata/download_files.html#Annual. [Last accessed on 9 Nov 2022].
17. U.S. Environmental Protection Agency (USEPA). Risk Assessment Guidance for Superfund Volume I: Human Health Evaluation Manual (Part F). Available from: https://www.epa.gov/sites/default/files/2015-09/documents/rags_a.pdf [Last accessed on 9 Nov 2022].
18. Sweeney LM, Kester JE, Kirman CR, et al. Risk assessments for chronic exposure of children and prospective parents to ethylbenzene (CAS No. 100-41-4). Crit Rev Toxicol 2015;45:662-726.
19. Aurisano N, Huang L, Milà I Canals L, Jolliet O, Fantke P. Chemicals of concern in plastic toys. Environ Int 2021;146:106194.
20. Willem H, Singer BC. Chemical emissions of residential materials and products: review of available information. 2010.
21. Kim YM, Harrad S, Harrison RM. Concentrations and sources of VOCs in urban domestic and public microenvironments. Environ Sci Technol 2001;35:997-1004.
22. Derbez M, Wyart G, Le Ponner E, Ramalho O, Ribéron J, Mandin C. Indoor air quality in energy-efficient dwellings: levels and sources of pollutants. Indoor Air 2018;28:318-38.
23. Saarela K, Tirkkonen T, Laine-ylijoki J, Jurvelin J, Nieuwenhuijsen M, Jantunen M. Exposure of population and microenvironmental distributions of volatile organic compound concentrations in the EXPOLIS study. Atmospheric Environ 2003;37:5563-75.
24. Harrison R, Delgado-Saborit J, Baker S, Aquilina N, Meddings C, et al. Measurement and modeling of exposure to selected air toxics for health effects studies and verification by biomarkers. Res Rep Health Eff Inst 2009;3-96:9-100.
25. Delgado-Saborit JM, Aquilina NJ, Meddings C, Baker S, Harrison RM. Relationship of personal exposure to volatile organic compounds to home, work and fixed site outdoor concentrations. Sci Total Environ 2011;409:478-88.
26. Borghi F, Spinazzè A, Mandaglio S, et al. Estimation of the inhaled dose of pollutants in different micro-environments: a systematic review of the literature. Toxics 2021;9:140.
27. Vardoulakis S, Giagloglou E, Steinle S, et al. Indoor exposure to selected air pollutants in the home environment: a systematic review. Int J Environ Res Public Health 2020;17:8972.
28. Klepeis NE, Nelson WC, Ott WR, et al. The national human activity pattern survey (NHAPS): a resource for assessing exposure to environmental pollutants. J Expo Anal Environ Epidemiol 2001;11:231-52.
29. Schweizer C, Edwards RD, Bayer-Oglesby L, et al. Indoor time-microenvironment-activity patterns in seven regions of Europe. J Expo Sci Environ Epidemiol 2007;17:170-81.
30. Edwards R, Schweizer C, Llacqua V, et al. Time-activity relationships to VOC personal exposure factors. Atmospheric Environment 2006;40:5685-700.
31. Jia C, Fu X, Chauhan B, Xue Z, Kedia RJ, Mishra CS. Exposure to volatile organic compounds (VOCs) at gas stations: a probabilistic analysis. Air Qual Atmos Health 2022;15:465-77.
32. Dodson RE, Levy JI, Spengler JD, Shine JP, Bennett DH. Influence of basements, garages, and common hallways on indoor residential volatile organic compound concentrations. Atmospheric Environment 2008;42:1569-81.
33. Wallace LA, Pellizzari E, Leaderer B, Zelon H, Sheldon L. Emissions of volatile organic compounds from building materials and consumer products. Atmospheric Environment (1967) 1987;21:385-93.
34. Wallace LA, Pellizzari ED. Personal air exposures and breath concentrations of benzene and other volatile hydrocarbons for smokers and nonsmokers. Toxicol Lett 1986;35:113-6.
35. Wallace LA, Pellizzari ED, Hartwell TD, Davis V, Michael LC, Whitmore RW. The influence of personal activities on exposure to volatile organic compounds. Environ Res 1989;50:37-55.
36. Wallace L, Pellizzari E, Hartwell TD, Perritt R, Ziegenfus R. Exposures to benzene and other volatile compounds from active and passive smoking. Arch Environ Health 1987;42:272-9.
37. Wallace LA, Pellizzari ED, Hartwell TD, Sparacino CM, Sheldon LS, et al. Personal exposures, indoor-outdoor relationships, and breath levels of toxic air pollutants measured for 355 persons in New Jersey. Atmos Environ 1985;19:1651-61.
38. Wallace LA, Pellizzari ED, Hartwell TD, Whitmore R, Sparacino C, Zelon H. Total exposure assessment methodology (team) study: personal exposures, indoor-outdoor relationships, and breath levels of volatile organic compounds in New Jersey. Environ Int 1986;12:369-87.
39. Wallace LA, Pellizzari ED, Hartwell TD, Whitmore R, Zelon H, et al. The California TEAM study: breath concentrations and personal exposures to 26 volatile compounds in air and drinking water of 188 residents of Los Angeles, Antioch, and Pittsburg, CA. Atmos Environ 1988;22:2141-63.
40. Wallace LA. Comparison of risks from outdoor and indoor exposure to toxic chemicals. Environ Health Perspect 1991;95:7-13.
41. Wallace LA. Personal exposure to 25 volatile organic compounds. EPA’s 1987 team study in Los Angeles, California. Toxicol Ind Health 1991;7:203-8.
42. Jia C, D’Souza J, Batterman S. Distributions of personal VOC exposures: a population-based analysis. Environ Int 2008;34:922-31.
43. Lin YS, Egeghy PP, Rappaport SM. Relationships between levels of volatile organic compounds in air and blood from the general population. J Expo Sci Environ Epidemiol 2008;18:421-9.
44. Adgate JL, Eberly LE, Stroebel C, Pellizzari ED, Sexton K. Personal, indoor, and outdoor VOC exposures in a probability sample of children. J Expo Anal Environ Epidemiol 2004;14 Suppl 1:S4-S13.
45. Edwards RD, Jurvelin J, Saarela K, Jantunen M. VOC concentrations measured in personal samples and residential indoor, outdoor and workplace microenvironments in EXPOLIS-Helsinki, Finland. Atmospheric Environt 2001;35:4531-43.
46. Weisel CP, Zhang J, Turpin BJ, Morandi MT, Colome S, et al. Relationships of indoor, outdoor, and personal air (RIOPA). Part I. Collection methods and descriptive analyses. Res Rep Health Eff Inst 2005;1-107: discussion109-27.
47. Bari MA, Kindzierski WB, Wheeler AJ, Héroux M-È, Wallace LA. Source apportionment of indoor and outdoor volatile organic compounds at homes in Edmonton, Canada. Build Environ 2015;90:114-24.
48. Li Y, Cakmak S, Zhu J. Profiles and monthly variations of selected volatile organic compounds in indoor air in Canadian homes: results of Canadian national indoor air survey 2012-2013. Environ Int 2019;126:134-44.
49. Wheeler AJ, Wong SL, Khouri C, Zhu J. Predictors of indoor BTEX concentrations in Canadian residences. Health Rep 2013;24:11-7.
50. Zhu J, Wong SL, Cakmak S. Nationally representative levels of selected volatile organic compounds in Canadian residential indoor air: population-based survey. Environ Sci Technol 2013;47:13276-83.
51. Xu J, Szyszkowicz M, Jovic B, Cakmak S, Austin CC, Zhu J. Estimation of indoor and outdoor ratios of selected volatile organic compounds in Canada. Atmospheric Environ 2016;141:523-31.
52. Xie J, Wang X, Sheng G, Bi X, Fu J. Determination of tobacco smoking influence on volatile organic compounds constituent by indoor tobacco smoking simulation experiment. Atmos Environ 2003;37:3365-74.
53. Heavner DL, Morgan WT, Ogden MW. Determination of volatile organic compounds and ETS apportionment in 49 homes. Environ Int 1995;21:3-21.
54. Heavner DL, Morgan WT, Ogden MW. Determination of volatile organic compounds and respirable suspended particulate matter in New Jersey and Pennsylvania homes and workplaces. Environ Int 1996;22:159-83.
55. Hodgson AT, Daisey JM, Mahanama KRR, Ten Brinke J, Alevantis LE. Use of volatile tracers to determine the contribution of environmental tobacco smoke to concentrations of volatile organic compounds in smoking environments. Environ Int 1996;22:295-307.
56. Chin JY, Godwin C, Parker E, et al. Levels and sources of volatile organic compounds in homes of children with asthma. Indoor Air 2014;24:403-15.
57. Dawson HE, Mcalary T. A compilation of statistics for VOCs from post-1990 indoor air concentration studies in North American residences unaffected by subsurface vapor intrusion. Ground Water Monit Remediat 2009;29:60-9.
58. U.S. Environmental Protection Agency (USEPA). Background indoor air concentrations of volatile organic compounds in North American residences (1990-2005): a compilation of statistics for assessing vapor intrusion. Available from: https://www.epa.gov/sites/default/files/2015-09/documents/oswer-vapor-intrusion-background-report-062411.pdf [Last accessed on 9 Nov 2022].
59. U.S. Environmental Protection Agency (USEPA). Regional screening levels for chemical contaminants at superfund sites (november 2021). last modified november 17, 2021. Available from: https://www.epa.gov/risk/regional-screening-levels-rsls-generic-tables. [Last accessed on 9 Nov 2022].
60. Steinle S, Reis S, Sabel CE. Quantifying human exposure to air pollution-moving from static monitoring to spatio-temporally resolved personal exposure assessment. Sci Total Environ 2013;443:184-93.
61. Symanski E, Stock TH, Tee PG, Chan W. Demographic, residential, and behavioral determinants of elevated exposures to benzene, toluene, ethylbenzene, and xylenes among the U.S. population: results from 1999-2000 NHANES. J Toxicol Environ Health A 2009;72:915-24.
62. Buckley T, Payne-Sturges D, Kim S, Weaver V. VOC exposure in an industry-impacted community. 2005. (Report No. NUATRC Research Report Number 4). Available from: https://cfpub.epa.gov/ncer_abstracts/index.cfm/fuseaction/display.files/fileID/13927. [Last accessed on 9 Nov 2022].
63. Avens HJ, Maskrey JR, Insley AL, Unice KM, Reid RCD, Sahmel J. Characterization of airborne BTEX exposures during use of lawnmowers and trimmers. Arch Environ Occup Health 2019;74:197-205.
64. Fontes T, Manso MC, Prata JC, Carvalho M, Silva C, Barros N. Exposure to BTEX in buses: the influence of vehicle fuel type. Environ Pollut 2019;255:113100.
65. Allahabady A, Yousefi Z, Ali Mohammadpour Tahamtan R, Payandeh Sharif Z. Measurement of BTEX (benzene, toluene, ethylbenzene and xylene) concentration at gas stations. Environ Health Eng Manag 2022;9:23-31.
66. Cohen Hubal EA, Richard A, Aylward L, et al. Advancing exposure characterization for chemical evaluation and risk assessment. J Toxicol Environ Health B Crit Rev 2010;13:299-313.
67. Egeghy PP, Sheldon LS, Isaacs KK, et al. Computational exposure science: an emerging discipline to support 21st-century risk assessment. Environ Health Perspect 2016;124:697-702.
68. Ring CL, Arnot JA, Bennett DH, et al. Consensus modeling of median chemical intake for the U.S. population based on predictions of exposure pathways. Environ Sci Technol 2019;53:719-32.
69. Wambaugh JF, Setzer RW, Reif DM, et al. High-throughput models for exposure-based chemical prioritization in the ExpoCast project. Environ Sci Technol 2013;47:8479-88.
70. Wambaugh JF, Wang A, Dionisio KL, et al. High throughput heuristics for prioritizing human exposure to environmental chemicals. Environ Sci Technol 2014;48:12760-7.
71. Jolliet O, Huang L, Hou P, Fantke P. High throughput risk and impact screening of chemicals in consumer products. Risk Anal 2021;41:627-44.
72. U.S. Environmental Protection Agency (USEPA). Exposure Factors Handbook: 2011 Edition. Washington, D.C.; 2011. Available from: https://cfpub.epa.gov/ncea/risk/recordisplay.cfm?deid=236252 [Last accessed on 9 Nov 2022].
73. Licina D, Morrison GC, Bekö G, Weschler CJ, Nazaroff WW. Clothing-mediated exposures to chemicals and particles. Environ Sci Technol 2019;53:5559-75.
74. Tang W, Hemm I, Eisenbrand G. Estimation of human exposure to styrene and ethylbenzene. Toxicology 2000;144:39-50.
75. Sanagi MM, Ling SL, Nasir Z, Ibrahim W, Abu Naim A. Determination of residual volatile organic compounds migrated from polystyrene food packaging into food simulant by headspace solid phase microextraction-gas chromatography. Malaysian J Anal Scis 2008;12:542-51.
76. Bhunia K, Sablani SS, Tang J, Rasco B. Migration of chemical compounds from packaging polymers during microwave, conventional heat treatment, and storage. Compr Rev Food Sci Food Saf 2013;12:523-45.
77. Melski K, Zabielski J, Kubera H. Model study on intensified migration of volatile substances from food contacting plastic materials during repeated microwaving. Available from: http://www.ejpau.media.pl/volume6/issue1/food/art-09.html [Last accessed on 9 Nov 2022].
78. Marć M, Zabiegała B. An investigation of selected monoaromatic hydrocarbons released from the surface of polystyrene lids used in coffee-to-go cups. Microchem. J 2017;133:496-505.
79. Pajaro-Castro N, Caballero-Gallardo K, Olivero-Verbel J. Identification of volatile organic compounds (VOCs) in plastic products using gas chromatography and mass spectrometry (GC/MS). Rev Ambient Agua 2014;9:610-20.
80. Lin QB, Song XC, Fang H, Wu YM, Wang ZW. Migration of styrene and ethylbenzene from virgin and recycled expanded polystyrene containers and discrimination of these two kinds of polystyrene by principal component analysis. Food Addit Contam Part A Chem Anal Control Expo Risk Assess 2017;34:126-32.
81. Ehret-Henry J, Ducruet V, Luciani A, Feigenbaum A. Styrene and ethylbenzene migration from polystyrene into dairy products by dynamic purge-and trap gas chromatography. J Food Sci 1994;59:990-1001.
82. Gramshaw JW, Vandenburg HJ. Compositional analysis of samples of thermoset polyester and migration of ethylbenzene and styrene from thermoset polyester into pork during cooking. Food Addit Contam 1995;12:223-34.
83. Nerín C, Acosta D. Behavior of some solid food simulants in contact with several plastics used in microwave ovens. J Agric Food Chem 2002;50:7488-92.
84. Nerín C, Acosta D, Rubio C. Potential migration release of volatile compounds from plastic containers destined for food use in microwave ovens. Food Addit Contam 2002;19:594-601.
85. Wittrig B. Monitoring volatiles in food contact packaging. Excerpted from Food Quality. Available from: https://pdf2.chromtech.net.au/pres-2001-food-pk.pdf. [Last accessed on 9 Nov 2022].
86. Fleming-Jones ME, Smith RE. Volatile organic compounds in foods: a five year study. J Agric Food Chem 2003;51:8120-7.
87. Bradley E, Gonzalez P, Layfield E, Read W, Speck D, et al. Investigation of Chemical Migration into Take-Away and Snack Foods. 2004. (Report No. A03033).
88. Chiesa LM, Soncin S, Panseri S, Cantoni C. Release of ethylbenzene and styrene from plastic cheese containers. Vet Res Commun 2008;32 Suppl 1:S319-21.
89. López P, Batlle R, Salafranca J, Nerín C. Efficiency of whole and skimmed powdered milk for trapping volatile compounds released from plastic containers in high-temperature applications. J Food Prot 2008;71:1889-97.
90. Hwang JB, Lee S, Yeum J, et al. HS-GC/MS method development and exposure assessment of volatile organic compounds from food packaging into food simulants. Food Addit Contam Part A Chem Anal Control Expo Risk Assess 2019;36:1574-83.
91. Arvanitoyannis IS, Bosnea L. Migration of substances from food packaging materials to foods. Crit Rev Food Sci Nutr 2004;44:63-76.
92. Begley T, Castle L, Feigenbaum A, et al. Evaluation of migration models that might be used in support of regulations for food-contact plastics. Food Addit Contam 2005;22:73-90.
93. Lau O, Wong S. Contamination in food from packaging material. J Chromatography A 2000;882:255-70.
94. Mercea P. Migration of Substances from Plastic Food Contact Materials into Foods and Food Simulants. In. SpecialChem. Available from: https://www.productip.com/kb/productipedia/compliance-resources/plastic-food-contact-materials [Last accessed on 9 Nov 2022].
95. Song X, Wrona M, Nerin C, Lin Q, Zhong H. Volatile non-intentionally added substances (NIAS) identified in recycled expanded polystyrene containers and their migration into food simulants. Food Packag Shelf Life 2019;20:100318.
96. Muncke J, Andersson AM, Backhaus T, et al. Impacts of food contact chemicals on human health: a consensus statement. Environ Health 2020;19:25.
97. Ernstoff AS, Fantke P, Huang L, Jolliet O. High-throughput migration modelling for estimating exposure to chemicals in food packaging in screening and prioritization tools. Food Chem Toxicol 2017;109:428-38.
98. Hahladakis JN, Velis CA, Weber R, Iacovidou E, Purnell P. An overview of chemical additives present in plastics: Migration, release, fate and environmental impact during their use, disposal and recycling. J Hazard Mater 2018;344:179-99.
99. European Commission (EC). Opinion on certain aromatic hydrocarbons present in food (expressed on 20/1/1999). Available from: https://food.ec.europa.eu/system/files/2020-12/sci-com_scf_out24_en.pdf [Last accessed on 9 Nov 2022].
100. Polystyrene Work Group (PWG). Potential Exposure to Ethylbenzene from Food-Contact Use of Polystyrene Resins. 1997. Available from: https://documen.site/download/document-1463136_pdf [Last accessed on 9 Nov 2022].
101. Lickly TD, Breder CV, Rainey ML. A model for estimating the daily dietary intake of a substance from food-contact articles: styrene from polystyrene food-contact polymers. Regul Toxicol Pharmacol 1995;21:406-17.
102. U.S. Food & Drug Administration (FDA). Cumulative Estimated Daily Intakes (CEDI) database. Last Modified December 14, 2017. Available from: https://www.fda.gov/food/packaging-food-contact-substances-fcs/cedi-database. [Last accessed on 9 Nov 2022].
103. U.S. Food and Drug Administration (FDA). Total Diet Study. Last Modified 2/23/2018. Accessed August 2019. Available from: https://www.fda.gov/food/science-research-food/total-diet-study. [Last accessed on 9 Nov 2022].
104. Vinci RM, Jacxsens L, De Meulenaer B, Deconink E, Matsiko E, et al. Occurrence of volatile organic compounds in foods from the Belgian market and dietary exposure assessment. Food Control 2015;52:1-8.
105. Cao XL, Sparling M, Dabeka R. Occurrence of 13 volatile organic compounds in foods from the Canadian total diet study. Food Addit Contam Part A Chem Anal Control Expo Risk Assess 2016;33:373-82.
106. U.S. Environmental Protection Agency (USEPA). Statistical Software ProUCL 5.1.00 for Environmental Applications for Data Sets with and without Nondetect Observations. 2016. Available from: https://www.epa.gov/land-research/proucl-software. [Last accessed on 9 Nov 2022].
107. Aylward LL, Kirman CR, Blount BC, Hays SM. Chemical-specific screening criteria for interpretation of biomonitoring data for volatile organic compounds (VOCs)-application of steady-state PBPK model solutions. Regul Toxicol Pharmacol 2010;58:33-44.
108. Aylward LL, Kirman CR, Schoeny R, Portier CJ, Hays SM. Evaluation of biomonitoring data from the CDC National Exposure Report in a risk assessment context: perspectives across chemicals. Environ Health Perspect 2013;121:287-94.
109. Kirman CR, Aylward LL, Blount BC, Pyatt DW, Hays SM. Evaluation of NHANES biomonitoring data for volatile organic chemicals in blood: application of chemical-specific screening criteria. J Expo Sci Environ Epidemiol 2012;22:24-34.
110. Su FC, Mukherjee B, Batterman S. Trends of VOC exposures among a nationally representative sample: analysis of the NHANES 1988 through 2004 data sets. Atmos Environ (1994) 2011;45:4858-67.
111. Centers for Disease Control and Prevention (CDC). Fourth National Report on Human Exposure to Environmental Chemicals Updated Tables, March 2021, Volume Two: NHANES 2011-2016. 2021. Available from: https://www.cdc.gov/exposurereport/ [Last accessed on 9 Nov 2022].
112. Centers for Disease Control and Prevention (CDC). National Report on Human Exposure to Environmental Chemicals. Available from: https://www.cdc.gov/exposurereport/index.html. [Last accessed on 9 Nov 2022].
113. Jain RB. Detection rates, trends in and factors affecting observed levels of selected volatile organic compounds in blood among US adolescents and adults. Environ Toxicol Pharmacol 2017;56:21-8.
114. Pollock T, Karthikeyan S, Walker M, Werry K, St-Amand A. Trends in environmental chemical concentrations in the Canadian population: Biomonitoring data from the Canadian Health Measures Survey 2007-2017. Environ Int 2021;155:106678.
115. Belova A, Greco SL, Riederer AM, Olsho LE, Corrales MA. A method to screen US environmental biomonitoring data for race/ethnicity and income-related disparity. Environ Health 2013;12:1-17.
116. Nguyen VK, Kahana A, Heidt J, et al. A comprehensive analysis of racial disparities in chemical biomarker concentrations in United States women, 1999-2014. Environ Int 2020;137:105496.
117. Churchill JE, Ashley DL, Kaye WE. Recent chemical exposures and blood volatile organic compounds in a large population-based sample. Arch Environ Health 2001;56:157-66.
118. Chambers DM, Ocariz JM, McGuirk MF, Blount BC. Impact of cigarette smoking on volatile organic compound (VOC) blood levels in the U.S. population: NHANES 2003-2004. Environ Int 2011;37:1321-8.
119. Jain RB. Selected volatile organic compounds as biomarkers for exposure to tobacco smoke. Biomarkers 2016;21:342-6.
120. Doherty BT, Kwok RK, Curry MD, Ekenga C, Chambers D, et al. Associations between blood BTEXS concentrations and hematologic parameters among adult residents of the US Gulf States. Environ Res 2017;156:579-87.
121. Centers for Disease Control and Prevention (CDC). Fourth National Report on Human Exposure to Environmental Chemicals Updated Tables, March 2021, Volume Four: Analysis of Chemicals Found in Cigarette Smoke in a Special Sample of U.S. Adults, NHANES 2011-2016. 2021. Available from: https://www.cdc.gov/exposurereport/ [Last accessed on 9 Nov 2022].
122. Faure S, Noisel N, Werry K, Karthikeyan S, Aylward LL, St-Amand A. Evaluation of human biomonitoring data in a health risk based context: an updated analysis of population level data from the Canadian Health Measures Survey. Int J Hyg Environ Health 2020;223:267-80.
123. Ashley DL, Bonin MA, Hamar B, McGeehin MA. Removing the smoking confounder from blood volatile organic compounds measurements. Environ Res 1995;71:39-45.
124. Jia C, Yu X, Masiak W. Blood/air distribution of volatile organic compounds (VOCs) in a nationally representative sample. Sci Total Environ 2012;419:225-32.
125. Khoury C, Werry K, Haines D, Walker M, Malowany M. Human biomonitoring reference values for some non-persistent chemicals in blood and urine derived from the Canadian health measures survey 2009-2013. Int J Hyg Environ Health 2018;221:684-96.
126. Kawai T, Sakurai H, Ikeda M. Biological monitoring of occupational ethylbenzene exposure by means of urinalysis for un-metabolized ethylbenzene. Ind Health 2019;57:525-9.
127. Janasik B, Jakubowski M, Wesołowski W, Kucharska M. Unmetabolized VOCs in urine as biomarkers of low level occupational exposure. Int J Occup Med Environ Health 2010;23:21-6.
128. Kawai T, Yasugi T, Mizunuma K, et al. Comparative evaluation of urinalysis and blood analysis as means of detecting exposure to organic solvents at low concentrations. Int Arch Occup Environ Health 1992;64:223-34.
129. Janasik B, Jakubowski M, Jałowiecki P. Excretion of unchanged volatile organic compounds (toluene, ethylbenzene, xylene and mesitylene) in urine as result of experimental human volunteer exposure. Int Arch Occup Environ Health 2008;81:443-9.
130. Knecht U, Reske A, Woitowitz HJ. Biological monitoring of standardized exposure to ethylbenzene: evaluation of a biological tolerance (BAT) value. Arch Toxicol 2000;73:632-40.
131. Jang JY, Droz PO, Kim S. Biological monitoring of workers exposed to ethylbenzene and co-exposed to xylene. Int Arch Occup Environ Health 2001;74:31-7.
132. Bardodej Z, Bardodejova E. Biotransformation of ethyl benzene, styrene, and alpha-methyl styrene in man. Am Ind Hyg Assoc J 1970;31:206-9.
133. Barr DB, Wilder LC, Caudill SP, Gonzalez AJ, Needham LL, Pirkle JL. Urinary creatinine concentrations in the U.S. population: implications for urinary biologic monitoring measurements. Environ Health Perspect 2005;113:192-200.
134. Alwis KU, Blount BC, Britt AS, Patel D, Ashley DL. Simultaneous analysis of 28 urinary VOC metabolites using Ultra High Performance Liquid Chromatography coupled with electrospray ionization tandem mass spectrometry (UPLC-ESI/MSMS). Anal Chim Acta 2012;750:152-60.
135. Centers for Disease Control and Prevention (CDC). Fourth National Report on Human Exposure to Environmental Chemicals Updated Tables, March 2021, Volume One: NHANES 1999-2010. 2021. Available from: https://www.cdc.gov/exposurereport/. [Last accessed on 9 Nov 2022].
136. Capella KM, Roland K, Geldner N, et al. Ethylbenzene and styrene exposure in the United States based on urinary mandelic acid and phenylglyoxylic acid: NHANES 2005-2006 and 2011-2012. Environ Res 2019;171:101-10.
137. Jain RB. Levels of selected urinary metabolites of volatile organic compounds among children aged 6-11 years. Environ Res 2015;142:461-70.
138. Jain RB. Levels of selected urinary metabolites of volatile organic compounds in a representative sample of US adolescents. Toxicol Environ Chem 2016;98:977-90.
139. Centers for Disease Control and Prevention (CDC). What’s New. Last Modified August 15, 2017. Accessed August 2017. Available from: https://www.cdc.gov/nchs/nhanes/new_nhanes.htm. [Last accessed on 9 Nov 2022].
140. Jain RB. Distributions of selected urinary metabolites of volatile organic compounds by age, gender, race/ethnicity, and smoking status in a representative sample of US adults. Environ Toxicol Pharmacol 2015;40:471-9.
141. Boyle E, Viet S, Wright D, Merrill L, Alwis K, et al. Assessment of exposure to VOCs among pregnant women in the National Children’s Study. Int J Env Res Public Health 2016;13:376. Available from: http://www.mdpi.com/1660-4601/13/4/376. [Last accessed on 9 Nov 2022].
142. De Jesús VR, Bhandari D, Zhang L, et al. Urinary biomarkers of exposure to volatile organic compounds from the population assessment of tobacco and health study wave 1 (2013-2014). Int J Environ Res Public Health 2020;17:5408.
143. Cattaneo A, Campo L, Iodice S, et al. Environmental and biological monitoring of personal exposure to air pollutants of adult people living in a metropolitan area. Sci Total Environ 2021;767:144916.
144. Konkle SL, Zierold KM, Taylor KC, Riggs DW, Bhatnagar A. National secular trends in ambient air volatile organic compound levels and biomarkers of exposure in the United States. Environ Res 2020;182:108991.
145. Fisher J, Mahle D, Bankston L, Greene R, Gearhart J. Lactational transfer of volatile chemicals in breast milk. Am Ind Hyg Assoc J 1997;58:425-31.
146. Needham LL, Wang RY. Analytic considerations for measuring environmental chemicals in breast milk. Environ Health Perspect 2002;110:A317-A24.
147. Kim SR, Halden RU, Buckley TJ. Volatile organic compounds in human milk: methods and measurements. Environ Sci Technol 2007;41:1662-7.
148. U.S. Environmental Protection Agency (USEPA). Acquisition and Chemical Analysis of Mother’s Milk for Selected Toxic Substances. Washington, D.C.; 1980.
149. Pellizzari ED, Hartwell TD, Harris BSr, Waddell RD, Whitaker DA, et al. Purgeable organic compounds in mother’s milk. Bull Environ Contam Toxicol 1982;28:322-8.
150. Blount BC, McElprang DO, Chambers DM, Waterhouse MG, Squibb KS, Lakind JS. Methodology for collecting, storing, and analyzing human milk for volatile organic compounds. J Environ Monit 2010;12:1265-73.
151. Hashimoto H, Yamada K, Hori H, et al. Expert Division of Occupational Hygiene & Ergonomics; The Japan Society for Occupational Health; The Committee for Personal Exposure Monitoring. Guidelines for personal exposure monitoring of chemicals: part IV. J Occup Health 2018;60:103-10.
152. U.S. Environmental Protection Agency (USEPA). Final Risk Evaluation for Methylene Chloride (Dichloromethane, DCM): DCM Supplemental File: Supplemental Information on Releases and Occupational Exposure Assessment. Washington, DC; 2020. Available from: https://www.epa.gov/sites/default/files/2020-06/documents/15_mecl_supplemental_information_on_releases_and_occupational_exposure_assessment_public.pdf. [Last accessed on 9 Nov 2022].
153. Hewett P, Ganser GH. A comparison of several methods for analyzing censored data. Ann Occup Hyg 2007;51:611-32.
154. U.S. Environmental Protection Agency (USEPA). Guidelines for the Statistical Analysis of Occupational Exposure Data. Office of Pollution Prevention and Toxics. Washington, D.C.; 1994. Available from: https://www.epa.gov/tsca-screening-tools/guidelines-statistical-analysis-occupational-exposure-data. [Last accessed on 9 Nov 2022].
155. U.S. Environmental Protection Agency (USEPA). ProUCL Version 5.1 Technical Guide: Statistical Software for Environmental Applications for Data Sets with and without Nondetect Observations. Washington, DC; 2010. Available from: https://www.epa.gov/sites/production/files/2016-05/documents/proucl_5.1_user-guide.pdf. [Last accessed on 9 Nov 2022].
156. Lipiro DJ, Jurinski JB, Haberlein RA, Sessions S. Impact of Styrene PEL Reduction on Composites Manufacturers in California. 2004. Available from: https://styrene.org/wp-content/uploads/2018/05/SIRC-comments-to-ACGIH_053118-combined.pdf [Last accessed on 9 Nov 2022].
157. Zhou XH. Estimating the mean value of occupational exposures. Am Ind Hyg Assoc J 1998;59:785-8.
158. U.S. Environmental Protection Agency (USEPA). Calculating Upper Confidence Limits for Exposure Point Concentrations at Hazardous Waste Sites. Available from: https://nepis.epa.gov/Exe/ZyPDF.cgi/P100CYCE.PDF?Dockey=P100CYCE.PDF [Last accessed on 9 Nov 2022].
159. U.S. Environmental Protection Agency (USEPA). Human health evaluation manual, supplemental guidance: update of standard default exposure factors. Available from: https://www.epa.gov/sites/default/files/2015-11/documents/oswer_directive_9200.1-120_exposurefactors_corrected2.pdf [Last accessed on 9 Nov 2022].
160. U.S. Environmental Protection Agency (USEPA). 2017 National Emissions Inventory (NEI) Data (January 2021 version). Available from: https://www.epa.gov/air-emissions-inventories/2017-national-emissions-inventory-nei-data#datas [Last accessed on 9 Nov 2022].
161. U.S. Environmental Protection Agency (USEPA). Guidance on Selecting Age Groups for Monitoring and Assessing Childhood Exposures to Environmental Contaminants. Washington, D.C.; 2005. Available from: https://www.epa.gov/risk/guidance-selecting-age-groups-monitoring-and-assessing-childhood-exposures-environmental [Last accessed on 9 Nov 2022].
162. Bowman S, Martin C, Carlson J, Clemens J, Lin B-H, et al. Retail Food Commodity Intakes: Mean Amounts of Retail Commodities per Individual, 2007-08. Available from: https://www.ars.usda.gov/ARSUserFiles/80400530/pdf/ficrcd/ficrcd_intake_tables_2007_08.pdf [Last accessed on 9 Nov 2022].
163. Cao XL, Sparling M, Pelletier L, Dabeka R. Styrene in foods and dietary exposure estimates. Food Addit Contam Part A Chem Anal Control Expo Risk Assess 2018;35:2045-51.
164. Banton M, Bus J, Collins J, Delzell E, Gelbke H-P, et al. Evaluation of potential health effects associated with occupational and environmental exposure to styrene-an update. J Toxicol Environ Health Part B 2019;22:1-130.
165. U.S. Environmental Protection Agency (USEPA). CompTox chemicals dashboard - Ethylbenzene 100-41-4 | DTXSID3020596. Available from: https://comptox.epa.gov/dashboard/chemical/details/DTXSID3020596 [Last accessed on 9 Nov 2022].
Cite This Article
How to Cite
Download Citation
Export Citation File:
Type of Import
Tips on Downloading Citation
Citation Manager File Format
Type of Import
Direct Import: When the Direct Import option is selected (the default state), a dialogue box will give you the option to Save or Open the downloaded citation data. Choosing Open will either launch your citation manager or give you a choice of applications with which to use the metadata. The Save option saves the file locally for later use.
Indirect Import: When the Indirect Import option is selected, the metadata is displayed and may be copied and pasted as needed.
About This Article
Copyright


Comments
Comments must be written in English. Spam, offensive content, impersonation, and private information will not be permitted. If any comment is reported and identified as inappropriate content by OAE staff, the comment will be removed without notice. If you have any queries or need any help, please contact us at [email protected].