

Occurrence and risks of polychlorinated biphenyls in water, sediment, and fish of Wupa River, Nigeria

 , ...
, ... Abstract
The occurrence and risks of polychlorinated biphenyls (PCBs) in water, sediment, and fish from the Wupa River, Nigeria, were assessed in this study. Water, sediment, and fish were collected from five locations in the Wupa River in November 2019. After extraction with dichloromethane, hexane, and acetone, the PCBs were determined using gas chromatography equipped with a quadrupole mass spectrometer. The hazard index and total cancer risk models were used for risk evaluation of the detected PCBs. The results of this study show that the ∑28 PCB concentrations in the water, sediment, and fish ranged from 0.04-11.42 ng/L, 5032-10132 ng/g, and 64-4254 ng/g, respectively. The hazard index values for children and adults were generally > 1, suggesting a potential non-carcinogenic risk for humans exposed to PCBs from the river. However, the total cancer risk values were above

Keywords
INTRODUCTION
Polychlorinated biphenyls (PCBs) are a group of chlorinated pollutants that have been produced and commercially accessible under different brand names since the 1920s[1]. PCBs include 209 congeners that result from the variation in the number and location of the chlorine atoms joined to the biphenyl rings[2]. The high stability, electric insulation tendencies, and low inflammation of PCBs are remarkable and have extended their applications to hydraulic fuels, plastics, refrigerants, printing ink, paints, wax extension systems, lubricants, adhesive products, etc.[1,3,4]. PCBs are non-ionizable, largely non-polar, and highly hydrophobic in nature. They are known suppressors of immune system function and cause neurobehavioral alterations, motor immaturity, etc.[2,5]. The use of PCBs is prohibited, but because they are recalcitrant, PCBs still exist in environmental matrices, biota and humans[6].
PCBs enter rivers through industrial discharge, surface runoff from non-point and point sources, atmospheric wet and dry deposition, sediment desorption, etc. In aquatic ecosystems, PCBs are adsorbed by particulate matter and precipitate in the sediment[7]. Nevertheless, PCBs can be resuspended by sediments with favorable environmental factors, and adsorbed PCBs are then released again into the water, starting another round of contamination and ultimately bioaccumulating in aquatic biota such as fish[8,9]. Since rivers are important for fishing and transportation, in addition to being a source of water for drinking, domestic use, agriculture irrigation, and recreational purposes, humans may become exposed to PCBs through consumption of agricultural foods, fish, and other seafood, drinking water, and dermal contact during transportation, recreational, and domestic water use[10]. Therefore, the monitoring and assessment of PCBs in water, sediment, and fish can indicate the status of aquatic contamination.
The Wupa River, which is about 16 km in length, is located around the Idu Industrial Layout in Abuja, Nigeria [Figure 1]. It is a branch of the Jabi River and lies within latitude 09° 01' 37.2054" N to 09° 04' 49.7215" N and longitude 07° 19' 22.7198" E to 07° 24' 45.0794" E. Next to the Wupa River is the Wupa Wastewater Treatment Plant (WWTP), Gosa dumpsite (GD), and the very busy Airport Road. The Wupa River receives effluents, waste discharges, and runoff from the WWTP, GD, and other industries sited in the Idu Industrial Layout. The Wupa River has been severely affected over the years by human activities along the river. Despite the length and intensity of these activities, there is limited information on the pollution status of the river. Thus, the objective of the present study was to assess the concentrations, sources, and risks of PCBs in the water, sediment, and fish from the Wupa River.

Figure 1. Map of study area.
MATERIALS AND METHODS
Reagents
All solvents used for extraction (acetone, dichloromethane, and n-hexane) were of pesticide grade and products of Merck (Darmstadt, Germany). The PCB standard solution containing 28 PCBs (PCB8, PCB18, PCB28, PCB44, PCB52, PCB60, PCB77, PCB81, PCB101, PCB105, PCB114, PCB118, PCB123, PCB126, PCB128, PCB138, PCB153, PCB156, PCB157, PCB167, PCB169, PCB170, PCB180, PCB185, PCB189, PCB195, PCB206, and PCB209) was used for calibration (AccuStandard Inc., CT, USA). Only 28 PCBs, including the 7 indicator PCBs, 12 WHO dioxin-like PCBs, and some common PCBs, were chosen since the study focused on the occurrence and human health risks of PCBs. The PCB surrogate standard solution containing six isotopically labeled PCBs (13C12 PCB28, -52, -118, -153, -180, and -209) was a product of Cambridge Isotope Laboratories Inc. (MA, USA). Alumina, copper powder, anhydrous sodium sulfate, and silica gel were of analytical grade and obtained from BDH Chemicals (Poole, UK).
Collection of samples
Samples were collected in November 2019. Five water and sediment samples were collected from five different locations (SL1-SL5) along the Wupa River [Figure 1]. The grab sampling technique was used to collect water and sediment samples. At each location, three water and sediment samples were collected and combined to give a homogenous sample. Five different fish species were obtained from a local fisherman during sampling. comprising Cyprinus carpio (CC), Ethmalosa fimbriata (EF), Heterobranchus bidorsalis (HB), Clarias anguillaris (CA), and Oreochromis niloticus (ON). All samples were placed in amber containers, kept in an ice chest, and transported to the laboratory for analysis.
Extraction and cleanup of PCBs in water
The USEPA Method 3510 was used in the extraction of PCBs in water samples. About 100 mL of water sample was measured into a separating funnel containing 100 mL of dichloromethane (DCM). The mixture was extracted for 30 min and the extract was collected into a flask. The extraction process was repeated with another 100 mL of DCM and the extract was collected into the same flask. The combined extract was reduced to approximately 2 mL with a rotary evaporator (LabTech EV311H Rotary evaporator). The concentrated extract was cleaned in a column containing alumina-silica gel packed bottom to top with 4 g of neutral silica gel (5% deactivated), 2 g of neutral alumina (6% deactivated), and 5 g of anhydrous Na2SO4. The PCBs were subsequently eluted with 50 mL of hexane from the column, concentrated to 2 mL, and stored in a vial prior to chemical analysis.
Extraction and cleanup of PCBs in sediment and fish
The USEPA Method 3540 C was used to extract the PCBs from the sediment and fish. A mass of 10.0 g of the sediment/fish was spiked with a mixed standard solution of isotopically labeled PCB congeners
Quantification of PCBs in samples
The concentrations of the 28 PCBs in the sample extracts were determined using an Agilent 7890A gas chromatograph interfaced with a 5876C mass selective detector (MSD) (Agilent Technologies Inc., Palo Alto, CA, USA). The separation column was a HP5 (30 m × 320 µm × 0.25 µm). The mobile phase was high-purity helium gas at a constant flow velocity of 1.2 mL/min. The initial temperature of the column was fixed at 85 °C, held for 1 min, stepped up to 200 °C at 35 °C/min, and then increased from 200 to 300 °C at
Quality control and statistical analysis
Quality control and assurance were achieved with procedural blanks, recoveries of the 13C12-PCBs, and matrix spike methods. Procedural blanks (n = 3) were analyzed following all the analysis steps but omitting the samples. PCBs were not detected in the procedural blanks. For the matrix spiked recovery method, a known standard of the PCBs was added to chosen fresh aliquots of samples (n = 3) that had already been analyzed and followed all the analytical steps. The percent recoveries of PCBs from the spiked matrices ranged from 95.3%-107%, 98.6%-106%, and 91.2%-106% for water, sediment, and fish, respectively. The surrogate PCB recoveries were 92.5%-99.5%, 90.9%-98.1%, and 89.7%-94.2% for water, sediment, and fish, respectively. The quantification of the PCBs was achieved by using an external calibration method consisting of five-point calibration lines obtained as a plot of the congener peak areas versus the standard concentrations. The regression coefficients (r2) for the calibration lines ranged from 0.9992 to 0.9999. The limits of detection and quantification (3 and 10 times the noise levels of the baseline, respectively) for the PCBs were 0.01-0.4 and 0.03-1.2 ng L-1, respectively. The precision of the method for replicate analyses was less than 8% relative standard deviation (RSD). The LODs, LOQs, RSD, r2, and percentage recoveries of individual PCB congeners are shown in Supplementary Table 1.
One-way analysis of variance (ANOVA) was employed for the determination of significant variation
Assessment of ecological risk from PCBs in Water, Sediment and Fish
The ecological risk of the dl- PCBs in the three matrices from the Wupa River was obtained using their toxic equivalencies (TEQs). The TEQs was computed with Equation (1)[11]:

where C and TEF are the dl-PCB concentrations and toxic equivalence factors, respectively. The TEF values used are shown in Supplementary Table 2.
Assessment of human health risks
Assessment of the human health risk of PCBs in water, sediment, and fish from the Wupa River was done in terms of hazard index (HI) and total cancer risk (TCR), respectively, with the equations below[12,13].
For non-cancer risk,
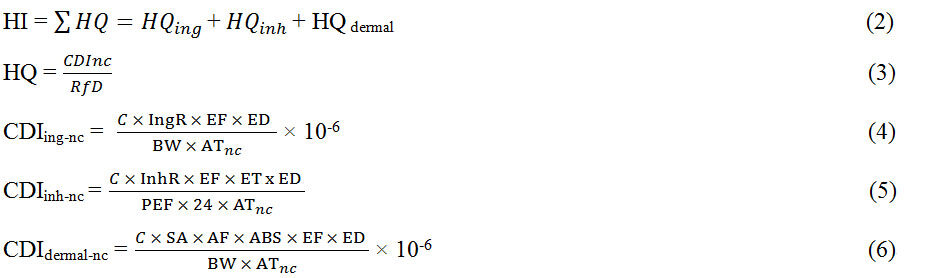
For cancer risk,
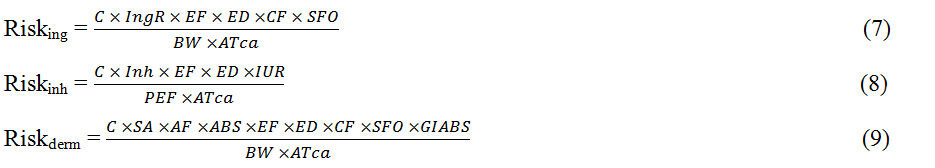
The meaning and values of each term and variable are shown in Supplementary Tables 2 and 3 respectively. For water, the health risk was evaluated using only two routes of exposure (ingestion and dermal contact). For sediment, three routes of exposure (ingestion, inhalation, and dermal contact) were used. For fish, only the ingestion route was used. Generally, HI values greater than 1 indicate the presence of non-carcinogenic risk of PCB exposure and vice versa, while total cancer risk values greater than 1.0 × 10⁻⁶ indicate that there is a carcinogenic risk from PCB exposure and vice versa[14].
RESULTS AND DISCUSSION
PCB concentrations in the Wupa River
The results of the 28 PCB congeners determined in the water, sediment, and fish from the Wupa River are shown in Table 1 and Figures 2-4. Analysis of variance (ANOVA) showed that the concentrations of PCBs in each of the three matrices from the Wupa River varied significantly (P < 0.05) among the sampling locations. The PCB concentrations in the Wupa River may be a result of the human activities and industrial processes around the river, considering factors such as total organic matter, velocity of water flow, and transportation characteristics of PCBs[3,4,15].

Figure 2. PCB congener profiles in water samples. PCB: Polychlorinated biphenyl.

Figure 3. PCB congener profiles in sediment samples. PCB: Polychlorinated biphenyl.

Figure 4. PCB congener profiles in fish samples: (A) cyprinus carpio; (B) ethmalosa fimbriata; (C) heterobranchus bidorsalis; (D) clarias anguillaris; and (E) oreochromis niloticus. CC: Cyprinus carpio; CA: clarias anguillaris; EF: ethmalosa fimbriata; ON: oreochromis niloticus; PCB: polychlorinated biphenyl.
PCB concentrations in water (ng/L), sediment (ng/g), and fish (ng/g) from the Wupa River
| Water | Sediment | Fish | |||||||||||||
| W1 | W2 | W3 | W4 | W5 | S1 | S2 | S3 | S4 | S5 | CC | EF | HB | CA | ON | |
| PCB8 | 0.26 | 0.77 | 2.96 | 0.70 | 1.97 | 298 | 776 | 200 | 900 | 1200 | 550 | 152 | 328 | 92 | 20 |
| PCB18 | 0.21 | 0.72 | 1.59 | 0.15 | 0.47 | 266 | 332 | 264 | 810 | 362 | 564 | 350 | 194 | 198 | 44 |
| PCB28 | ND | ND | ND | ND | ND | 136 | 382 | 184 | 206 | 528 | 296 | 262 | ND | ND | ND |
| PCB44 | ND | ND | ND | ND | ND | 274 | 744 | 116 | 246 | 704 | ND | 238 | ND | ND | ND |
| PCB52 | ND | ND | ND | ND | ND | 268 | 246 | 144 | 258 | 526 | 180 | 54 | ND | ND | ND |
| PCB66 | 0.85 | 0.71 | 0.6 | 0.40 | ND | ND | 478 | 116 | 208 | 288 | 712 | 138 | ND | ND | ND |
| PCB77 | 0.56 | 0.90 | 0.43 | 0.35 | ND | 236 | 168 | 190 | 406 | 136 | 38 | 140 | ND | ND | ND |
| PCB81 | ND | 0.92 | ND | ND | ND | 474 | 126 | 110 | 48 | 210 | 70 | 50 | ND | ND | ND |
| PCB101 | 0.11 | ND | ND | ND | 2.62 | 244 | 276 | 324 | 844 | 452 | 62 | 426 | 188 | ND | ND |
| PCB105 | ND | 0.18 | 0.35 | ND | ND | 1432 | ND | 90 | ND | 522 | ND | 104 | ND | ND | ND |
| PCB114 | ND | 0.99 | ND | 0.67 | ND | 528 | 140 | 278 | 234 | 296 | ND | ND | ND | ND | ND |
| PCB118 | ND | 0.56 | ND | 0.86 | ND | 188 | 188 | 220 | 306 | 272 | ND | ND | ND | ND | ND |
| PCB123 | 0.16 | ND | 1.47 | ND | 0.75 | 398 | 266 | 232 | 220 | 302 | 452 | 346 | 244 | ND | ND |
| PCB126 | 0.80 | ND | 0.13 | ND | 0.12 | 134 | 212 | 120 | 714 | 156 | 346 | 266 | 114 | ND | ND |
| PCB128 | 0.06 | ND | 0.10 | ND | 0.40 | 218 | 308 | 230 | 468 | 132 | 394 | 364 | 134 | ND | ND |
| PCB138 | ND | ND | 1.3 | ND | ND | 54 | 270 | 236 | 174 | 280 | ND | ND | ND | ND | ND |
| PCB153 | 0.93 | ND | 0.14 | ND | 0.50 | 98 | 384 | 104 | 400 | 148 | 410 | 380 | 104 | 92 | ND |
| PCB156 | ND | ND | 0.44 | ND | ND | 68 | 330 | 64 | 180 | 130 | 268 | ND | ND | ND | ND |
| PCB157 | ND | ND | ND | ND | ND | 108 | 254 | 60 | 760 | 114 | ND | ND | ND | ND | ND |
| PCB167 | ND | ND | ND | ND | ND | 102 | 188 | 28 | 310 | 66 | 16 | ND | ND | ND | ND |
| PCB169 | ND | ND | 1.52 | ND | ND | 84 | 662 | 64 | ND | 188 | 42 | ND | ND | ND | ND |
| PCB170 | ND | ND | 0.39 | ND | ND | 154 | 622 | 60 | 78 | 254 | 40 | ND | ND | ND | ND |
| PCB180 | ND | ND | ND | ND | 0.96 | 110 | 246 | 442 | 874 | 526 | 78 | 500 | ND | ND | ND |
| PCB187 | ND | ND | ND | ND | ND | 126 | 110 | ND | 258 | 154 | 48 | ND | ND | ND | ND |
| PCB189 | ND | ND | ND | ND | ND | 212 | 134 | 74 | ND | 290 | ND | ND | ND | ND | ND |
| PCB195 | ND | 0.91 | ND | ND | ND | 178 | 274 | 350 | ND | 228 | ND | 484 | ND | 20 | ND |
| PCB206 | ND | ND | ND | ND | ND | 308 | 196 | 126 | 298 | 312 | 286 | ND | 286 | ND | ND |
| PCB209 | ND | ND | ND | ND | ND | 422 | 276 | 606 | 932 | ND | 248 | ND | 248 | ND | ND |
| TOTAL | 3.94 | 6.66 | 11.4 | 3.13 | 7.79 | 7118 | 8588 | 5032 | 10132 | 8776 | 5100 | 4254 | 1840 | 402 | 64 |
| Di-PCB | 0.26 | 0.77 | 2.96 | 0.70 | 1.97 | 298 | 776 | 200 | 900 | 1200 | 550 | 152 | 328 | 92 | 20 |
| Tri-PCBs | 0.21 | 0.72 | 1.59 | 0.15 | 0.47 | 402 | 714 | 448 | 1016 | 890 | 860 | 612 | 194 | 198 | 44 |
| Tetra-PCBs | 1.41 | 2.53 | 1.03 | 0.75 | 0.00 | 1250 | 1762 | 676 | 1166 | 1864 | 1000 | 620 | 0.0 | 0.0 | 0.0 |
| Penta-PCBs | 1.07 | 1.73 | 1.95 | 1.53 | 3.49 | 2920 | 1082 | 1264 | 2318 | 2000 | 860 | 1142 | 546 | 0.0 | 0.0 |
| Hexa-PCBs | 0.99 | 0.00 | 3.50 | 0.00 | 0.90 | 732 | 2396 | 786 | 2292 | 1058 | 1130 | 744 | 238 | 92.0 | 0.0 |
| Hepta-PCBs | 0.00 | 0.00 | 0.39 | 0.00 | 0.96 | 602 | 1112 | 576 | 1210 | 1224 | 166 | 500 | 0 | 0 | 0 |
| Octa-PCBs | 0.00 | 0.91 | 0.00 | 0.00 | 0.00 | 178 | 274 | 350 | 0 | 228 | 0 | 484 | 0 | 20 | 0 |
| Nona-PCBs | 0.00 | 0.00 | 0.00 | 0.00 | 0.00 | 308 | 196 | 126 | 298 | 312 | 286 | 0 | 286 | 0 | 0 |
| Deca-PCBs | 0.00 | 0.00 | 0.00 | 0.00 | 0.00 | 422 | 276 | 606 | 932 | 0 | 248 | 0 | 248 | 0 | 0 |
| LC-PCBs | 2.95 | 5.75 | 7.53 | 3.13 | 5.93 | 4876 | 4334 | 2588 | 5400 | 5954 | 3270 | 2526 | 1068 | 290 | 64 |
| HC-PCBs | 0.99 | 0.91 | 3.89 | 0.00 | 1.86 | 2242 | 4254 | 2444 | 4732 | 2822 | 1830 | 1728 | 772 | 112 | 0 |
Water
The total PCB (∑28 PCB) concentrations in the water samples of Wupa River varied between 3.13 and

Figure 5. Occurrence profiles of PCBs in the water, sediment, and fish from the Wupa River. CC: Cyprinus carpio; CA: clarias anguillaris; EF: ethmalosa fimbriata; ON: oreochromis niloticus; PCB: polychlorinated biphenyl.
Comparison of PCBs in water and sediment of the Wupa River with those in other rivers
| Matrices | River System | Concentrations | Reference |
| Water (ng/L) | Wupa-Idu River, Nigeria | 3.13-11.4 | This Study |
| River Niger, Nigeria | 456-1139 | [19] | |
| River Ethiope | 0.0015-0.015 | [20] | |
| Benin River | 0.00003-0.00293 | [20] | |
| River Nile, Egypt | 0.014-0.02 | [21] | |
| Pearl River Estuary, China | 0.02-14.8 | [22] | |
| Yangtze River, China | 3.77-61.79 | [22] | |
| Tonghui River of Beijing, China | 31.58-344.9 | [22] | |
| Minjiang River Estuary, China | 204-2473 | [22] | |
| Houston Ship Channel, USA | 0.49-12.5 | [23] | |
| Mississippi River, USA | 22.2-163 | [23] | |
| Delaware River, USA | 0.42-1.65 | [23] | |
| Hudson River, USA | <9.3-164.3 | [23] | |
| Johannesburg River, South Africa | 0.021-0.121 | [23] | |
| Ebro River, Spain | 43.2-108 | [23] | |
| Bay of Bengal Coast, Bangladesh | 32.17-199.4 | [16] | |
| Sediment (ng/g) | Wupa-Idu River, Nigeria | 5032-10132 | This Study |
| Nigeria | |||
| Escravos River Basin, Nigeria | 226-31900 | [4] | |
| River Niger | 13.5-277 | [3] | |
| Ase River | ND-1633 | [3] | |
| Forcados River | 1.9-78.4 | [3] | |
| Ogun River, Nigeria | 323-2003 | [24] | |
| Ona river, Nigeria | 589-1354 | [24] | |
| New Calabar River, Nigeria | 210-2160 | [25] | |
| Forcados River, Nigeria | 2.7-202.3 | [26] | |
| River Niger and Nicholas River | 741-2964 | [27] | |
| Ethiope River | 0.73-6.7 | [20] | |
| Benin River | 0.35-15.15 | [20] | |
| Africa | |||
| Umgeni River, South Africa | 103-430 | [28] | |
| Pangani River and its tributaries, Tanzania | 0.36-11 | [29] | |
| Lake Qarum, Egypt | 1.48-137.2 | [30] | |
| Lake Maryut, Egypt | 3.06-388 | [30] | |
| Lake Manzala, Egypt | 2.53-76.37 | [30] | |
| Monaslir Bay, Tunisia | 1.1-9.3 | [31] | |
| Congo River basin, Congo | Nd-1.4 | [32] | |
| Other countries of the World | |||
| Ankara creek, Turkey | 3.7-743.3 | [33] | |
| Haihe River and Estuary, China | 0.177-253 | [34] | |
| Cienfuegos Bay, Cuba | 2.50-15.49 | [35] | |
| Chenab River, Pakistan | 9.33-144.23 | [36] | |
| Lianjiang River, China | 4.70-743 | [37] | |
| Lake Michigan, USA | 53-35,000 | [38] | |
| Northwest Persian Gulf, Iran | 3400-50200 | [39] | |
| Belford Harbor, Massachussets, USA | 2800-109000 | [40] |
Sediment
The ∑28 PCB concentrations in the sediment of the Wupa River ranged from 5032 ng/g for S3 to 10,132 ng/g for S4. All 28 PCB congeners except PCB66 were detected in sample S1. Only PCB105 and PCB187 were below their detection limits in samples S2 and S3, respectively. PCB105, PCB169, PCB189, and PCB195 were under their detection limits in sample S4, whereas all 28 PCBs were found in sample S5. The PCB congener distribution in the sediments of the Wupa River showed an even spread across chlorination levels, which indicated the presence of several different aroclors. The higher concentration of PCB8 in samples S2, S4, and S5 may be due to dechlorination or possibly an inadvertent PCB source. PCB209 was not only detected in all sediment samples but also in high proportions; in some samples (S3 and S4), it was the dominant congener. This is highly indicative of an incidental PCB source. On average, the occurrence pattern followed the order: penta-PCBs > hexa-PCBs > tetra-PCBs > hepta-PCBs > tri-PCBs > di-PCBs > deca-PCBs > nona-PCBs > octa-PCBs [Figure 5]. The lower chlorinated (LC) PCBs (di-PCBs to penta-PCBs) were the dominant PCBs in the sediment. The domination of the LC-PCBs in the sediments of the Wupa River may result from reductive dechlorination of higher chlorinated PCBs in the absence of free oxygen[3]. The ∑28 PCB concentrations in the sediment of the Wupa River were above the Dutch action value and Australia and New Zealand Ecological Investigation Level of 1000 ng/g[41,42], the Canadian Soil Quality Guideline value of 1300 ng/g[43], and the US EPA health-based screening level for total PCBs of 200 ng/g[44]. The ∑28 PCB concentrations obtained in the sediment of the Wupa River are compared with those reported elsewhere in Nigeria and other countries in Table 2. The PCB concentrations obtained in sediments of the Wupa River were comparable to the range of 226-31,900 ng/g reported for Escravos River[4] but higher than those reported for the Niger, Ase, Forcados, Nicholas, Ona, New Calabar, Ethiope, and Benin Rivers in Nigeria. They were also higher than the PCB concentrations reported for sediments from rivers in other countries. The PCB concentrations in the sediment of the Wupa River were in the same range of 3400-50200 ng/g reported by Zahed et al. for the sediment of the Persian Gulf, Iran, 2800-109,000 ng/g reported for the sediment of Belford Harbor, MA, USA, and 53-35,000 ng/g reported for the sediment of Lake Michigan, USA[39,40].
Fish
The total PCB (∑28 PCBs) concentrations in the fish samples from the Wupa River varied between 64.0 and 5100 ng/g. The highest ∑28 PCB concentration was obtained in Cyprinus carpio, whereas the lowest concentration was obtained in Oreochromis niloticus. In Cyprinus carpio, PCB congeners 105, 114, 118, 157, 189, and 195 were below their detection limit. Similarly, in Ethmalosa fimbriata, PCB congeners 114, 118, 156, 167, 169, 170, 187, 189, 206, and 209 were under their detection limit. However, in Heterobranchus bidorsalis PCB congeners 8, 18, 101, 123, 126, 128, 153, 206, and 209 were detected. In Clarias anguillaris, only PCB congeners 8, 18, 153, and 195 were detected, while in Oreochromis niloticus, only PCB8 and PCB18 were detected.
The occurrence pattern of the PCBs was as follows: penta-PCBs > hexa-PCBs > tri-PCBs >tetra-PCBs > di-PCBs > hepta-PCBs > nona-PCBs > octa-PCBs >deca-PCBs [Figure 5]. The permissible limit of PCBs in fish set by the United States Food and Drug Administration (USFDA) and Swedish Food Regulation (SFR) is 2000 ng/g. The ∑28 PCB concentrations in Cyprinus carpio and Ethmalosa fimbriata were above the USFDA and SFR permissible limits. The ∑28 PCB concentrations obtained in fish from the Wupa River were comparable to the concentrations range of 20-6000 ng/g reported for fish from the Michigan River[45],
Toxicity of dl-PCBs in Water, Sediment, and Fish
The computed dl-PCBs TEQs for the three matrices from the Wupa River are presented in Table 3. The TEQs ranged from 8.09.0 × 10-5 to 8.01 × 10⁻² ng TEQ2005 g-1 in 80% of the water samples, from 16.2 to 71.5 ng TEQ g-1 in sediment, and from 11.4 to 35.9 ng TEQ2005g-1 in fish. The TEQ values obtained for the sediment of the Wupa River were more than the 21.5 pg TEQ g-1 limit stipulated by the Canadian Council of Ministers of the Environment (CCME) [43]. This implies that there are potential toxic effects as a result of PCB exposure in the Wupa River. With the exception of Clarias anguillaris and Oreochromis niloticus samples, the TEQs recorded in these fish samples from the Wupa River were greater than the upper limit of 6.5 pg TEQ2005 g-1 stipulated by the European Food Safety Authority (EFSA)[55] for dl-PCBs in fish, indicating that it is dangerous to consume these fish. PCB126 was the major donor to the TEQs obtained for these matrices from the Wupa River.
Toxic equivalence (ngTEQ2005 g-1) of PCBs in water, sediment, and fish from the Wupa River
| Marices | Samples | PCB77 | PCB81 | PCB105 | PCB114 | PCB118 | PCB123 | PCB126 | PCB156 | PCB157 | PCB167 | PCB169 | PCB189 | TTEQ |
| Water | W1 | 5.60E-05 | 0 | 0 | 0 | 0 | 4.80E-06 | 8.00E-02 | 1.80E-06 | 0 | 0 | 0 | 0 | 8.01E-02 |
| W2 | 9.00E-05 | 2.76E-04 | 5.40E-06 | 2.97E-05 | 1.68E-05 | 0 | 0 | 0 | 0 | 0 | 0 | 0 | 4.18E-04 | |
| W3 | 4.30E-05 | 0 | 1.05E-05 | 0 | 0 | 4.41E-05 | 1.30E-02 | 3.00E-06 | 1.32E-05 | 0 | 4.56E-02 | 0 | 5.87E-02 | |
| W4 | 3.50E-05 | 0 | 0 | 2.01E-05 | 2.58E-05 | 0 | 0 | 0 | 0 | 0 | 0 | 0 | 8.09E-05 | |
| W5 | 0 | 0 | 0 | 0 | 0 | 2.25E-05 | 1.20E-02 | 1.20E-05 | 0 | 0 | 0 | 0 | 1.20E-02 | |
| Sediment | S1 | 0.024 | 0.142 | 0.043 | 0.016 | 0.006 | 0.012 | 13.4 | 0.002 | 0.003 | 0.003 | 2.52 | 0.006 | 16.2 |
| S2 | 0.017 | 0.038 | 0 | 0.004 | 0.006 | 0.008 | 21.2 | 0.01 | 0.008 | 0.006 | 19.9 | 0.004 | 41.2 | |
| S3 | 0.019 | 0.033 | 0.003 | 0.008 | 0.007 | 0.007 | 12 | 0.002 | 0.002 | 0.001 | 1.92 | 0.002 | 14.0 | |
| S4 | 0.041 | 0.014 | 0 | 0.007 | 0.009 | 0.007 | 71.4 | 0.005 | 0.023 | 0.009 | 0 | 0 | 71.5 | |
| S5 | 0.014 | 0.063 | 0.016 | 0.009 | 0.008 | 0.009 | 15.6 | 0.004 | 0.003 | 0.002 | 5.64 | 0.009 | 21.4 | |
| Fish | CC | 3.80E-03 | 2.10E-02 | 0 | 0 | 0 | 1.36E-02 | 3.46E+01 | 8.04E-03 | 0 | 4.80E-04 | 1.26 | 0 | 35.9 |
| EF | 1.40E-02 | 1.50E-02 | 3.12E-03 | 0 | 0 | 1.04E-02 | 2.66E+01 | 0 | 0 | 0 | 0 | 0 | 26.6 | |
| HB | 0 | 0 | 0 | 0 | 0 | 7.32E-03 | 1.14E+01 | 0 | 0 | 0 | 0 | 0 | 11.4 | |
| CA | 0 | 0 | 0 | 0 | 0 | 0 | 0 | 0 | 0 | 0 | 0 | 0 | 0.0 | |
| ON | 0 | 0 | 0 | 0 | 0 | 0 | 0 | 0 | 0 | 0 | 0 | 0 | 0.0 |
Human health risks
The computed non-cancer and cancer risks of PCBs in the three matrices from the Wupa River are displayed in Supplementary Tables 4-6. For water and sediment, the HQIng was greater than HQDerm, and HQinh was the lowest. The HI values of PCBs in the Wupa River for children and adults ranged from 14.8-14,512 and 4.43-4344, respectively for water, 3.07 × 10⁵-1.82 × 10⁶ and 4.30 × 10⁴-2.55 × 10⁵, respectively for sediment and 2.17 × 10⁴-6.58 × 10⁴ and 5.42 × 10³-1.65 × 10⁴, respectively for fish. The HI values for the three matrices were > 1, signifying the existence of non-cancer risk for individuals exposed to PCBs in the water, sediment, and fish from the Wupa River. However, the HI values for fish samples of the Wupa River were < 1, indicating that there is no adverse non-cancer risk for humans eating fish from the Wupa River.
The risk levels from PCB exposure in the water and sediments followed the same trend as the HQ. The TCR values of PCBs in the Wupa River for children and adults ranged from 1.33 × 10⁻³-1.32 and 2.09 × 10⁻⁴-2.07 × 10⁻¹, respectively, for water, 3.24 × 101-1.65 × 10² and 2.50-1.27 × 101, respectively, for sediment and 1.97-6.21 and 2.71 × 10⁻¹-8.54 × 10⁻¹, respectively for fish. The TCR values for the three matrices from the Wupa River were above the 1 × 10⁻⁶ risk level, indicating the presence of potential cancer risk from PCB exposure in the Wupa River. However, the small sample size from which the risk data were derived is somewhat a limitation to this study and is well acknowledged.
CONCLUSION
The occurrence and risks of PCBs in water, sediment, and fish from the Wupa River, Nigeria, were assessed in this study. The concentrations of total PCBs in all the water samples from the Wupa River were below the USEPA permissible limit of PCBs in drinking water, while the concentrations of total PCBs in 60% of the fish samples were less than the USFDA and SFR permissible limits of PCBs in fish. However, the PCB concentrations in the sediments were above the Dutch action value, Australia and New Zealand Ecological Investigation Level, Canadian Soil Quality Guideline value, and the USEPA health-based screening level. PCB209 was the dominant PCB in some sediment profiles and is associated with the inadvertent PCB production. The risk assessment indicated that there are possible ecological and human health risks to biota and humans exposed to PCBs in the Wupa River.
DECLARATIONS
Acknowledgments
Authors are thankful to Mr. Jude Ossai for his assistance in chemical analyses.
Authors’ contributions
Performed data acquisition, as well as provided administrative, technical, and material support: Okoh A, Tesi GO
Made substantial contributions to conception and design of the study, editing and supervision: Dauda MS, Aliyu HD
Availability of data and materials
The data is available in the report. Additional data and information can be made available at request from individuals interested.
Financial support and sponsorship
None.
Conflicts of interest
All authors declared that there are no conflicts of interest.
Ethical approval and consent to participate
Not applicable.
Consent for publication
Not applicable.
Copyright
© The Author(s) 2022.
Supplementary Materials
REFERENCES
1. Tesi GO, Iniaghe PO. Polychlorinated biphenyls in canned sardines in Nigeria and health risk assessment. Food Addit Contam Part B Surveill 2020;13:200-6.
2. Visha A, Gandhi N, Bhavsar SP, Arhonditsis GB. A Bayesian assessment of polychlorinated biphenyl contamination of fish communities in the Laurentian Great Lakes. Chemosphere 2018;210:1193-206.
3. Irerhievwie GO, Iwegbue CMA, Lari B, Tesi GO, Nwajei GE, Martincigh BS. Spatial characteristics, sources, and ecological and human health risks of polychlorinated biphenyls in sediments from some river systems in the Niger Delta, Nigeria. Mar Pollut Bull 2020;160:111605.
4. Iwegbue CMA, Bebenimibo E, Tesi GO, Egobueze FE, Martincigh BS. Spatial characteristics and risk assessment of polychlorinated biphenyls in surficial sediments around crude oil production facilities in the Escravos River Basin, Niger Delta, Nigeria. Mar Pollut Bull 2020;159:111462.
5. Tomasallo C, Anderson H, Haughwout M, Imm P, Knobeloch L. Mortality among frequent consumers of Great Lakes sport fish. Environ Res 2010;110:62-9.
6. Wang X, Xu H, Zhou Y, Wu C, Kanchanopas-Barnette P. Spatial distribution and sources of polychlorinated biphenyls in surface sediments from the Zhoushan Archipelago and Xiangshan Harbor, East China Sea. Mar Pollut Bull 2016;105:385-92.
7. Sahu SK, Ajmal PY, Pandit GG, Puranik VD. Vertical distribution of polychlorinated biphenyl congeners in sediment core from Thane Creek area of Mumbai, India. J Hazard Mater 2009;164:1573-9.
8. Apell JN, Gschwend PM. In situ passive sampling of sediments in the Lower Duwamish Waterway Superfund site: Replicability, comparison with ex situ measurements, and use of data. Environ Pollut 2016;218:95-101.
9. Zhou S, Yang H, Zhang A, Li YF, Liu W. Distribution of organochlorine pesticides in sediments from Yangtze River Estuary and the adjacent East China Sea: implication of transport, sources and trends. Chemosphere 2014;114:26-34.
10. Zhou R, Zhu L, Yang K, Chen Y. Distribution of organochlorine pesticides in surface water and sediments from Qiantang River, East China. J Hazard Mater 2006;137:68-75.
11. Van den Berg M, Birnbaum LS, Denison M, et al. The 2005 World Health Organization reevaluation of human and Mammalian toxic equivalency factors for dioxins and dioxin-like compounds. Toxicol Sci 2006;93:223-41.
12. USEPA (United States Environmental Protection Agency). Risk assessment guidance for superfund, volume 1: human health evaluation manual (Part A). Available from: https://www.epa.gov/sites/default/files/2015-09/documents/rags_a.pdf [Last accessed on 5 Sep 2022].
13. USEPA (United States Environmental Protection Agency). Risk assessment guidance for superfund (RAGS): part F. Available from: https://www.epa.gov/risk/risk-assessment-guidance-superfund-rags-part-f [Last accessed on 5 Sep 2022].
14. USEPA (United States Environmental Protection Agency). Regional screening levels (RSL) - generic tables. Available from: http://www.epa.gov/risk/risk-based-screening-table-generic-tables [Last accessed on 5 Sep 2022].
15. Barhoumi B, LeMenach K, Dévier MH, et al. Distribution and ecological risk of polychlorinated biphenyls (PCBs) and organochlorine pesticides (OCPs) in surface sediments from the Bizerte lagoon, Tunisia. Environ Sci Pollut Res Int 2014;21:6290-302.
16. Habibullah-Al-Mamun M, Kawser Ahmed M, Saiful Islam M, Tokumura M, Masunaga S. Occurrence, distribution and possible sources of polychlorinated biphenyls (PCBs) in the surface water from the Bay of Bengal coast of Bangladesh. Ecotoxicol Environ Saf 2019;167:450-8.
17. Zhang L, Shi S, Dong L, Zhang T, Zhou L, Huang Y. Concentrations and possible sources of polychlorinated biphenyls in the surface water of the Yangtze River Delta, China. Chemosphere 2011;85:399-405.
18. Cui X, Dong J, Huang Z, et al. Polychlorinated biphenyls in the drinking water source of the Yangtze River: characteristics and risk assessment. Environ Sci Eur 2020:32.
19. Unyimadu JP, Osibanjo O, Babayemi JO. Polychlorinated biphenyls (PCBs) in River Niger, Nigeria: Occurrence, distribution and composition profiles. Toxicol Ind Health 2018;34:54-67.
20. Ezemonye LIN. Polychlorinated biphenyls (PCBs) levels and distribution in Ethiope and Benin Rivers of the Niger Delta, Nigeria: surface water and sediments. Int J Envir Studies 2005;62:491-504.
21. Megahed AM, Dahshan H, Abd-El-Kader MA, et al. Polychlorinated biphenyls water pollution along the River Nile, Egypt. Sci World J :2015.
22. Yang Y, Xie Q, Liu X, Wang J. Occurrence, distribution and risk assessment of polychlorinated biphenyls and polybrominated diphenyl ethers in nine water sources. Ecotoxicol Environ Saf 2015;115:55-61.
23. Amdany R, Chimuka L, Cukrowska E, et al. Assessment of bioavailable fraction of POPS in surface water bodies in Johannesburg City, South Africa, using passive samplers: an initial assessment. Environ Monit Assess 2014;186:5639-53.
24. Adeogun AO, Chukwuka AV, Okoli CP, Arukwe A. Concentration of polychlorinated biphenyl (PCB) congeners in the muscle of Clarias gariepinus and sediment from inland rivers of southwestern Nigeria and estimated potential human health consequences. J Toxicol Environ Health A 2016;79:969-83.
25. Ilechukwu I, Mgbemena NM, Inagbor PO, Ndukwe GI. Assessment of the levels of polychlorinated biphenyls in sediments of new Calabar River, Niger Delta Region, Nigeria. Ovidius Univ Ann Chem 2018;29:36-40.
26. Iwegbue C. Distribution and ecological risks of polychlorinated biphenyls (PCBs) in surface sediment of the Forcados River, Niger Delta, Nigeria. Afric J Aquat Sci 2016;41:51-6.
27. Sahavacharin A. Spatial and temporal landscape change of Andaman coastal city and forest, Thailand. J Coast Zone Manag 2017:20.
28. Gakuba E, Moodley B, Ndungu P, Birungi G. Occurrence and significance of polychlorinated biphenyls in water, sediment pore water and surface sediments of Umgeni River, KwaZulu-Natal, South Africa. Environ Monit Assess 2015;187:568.
29. Hellar-Kihampa H, De Wael K, Lugwisha E, Malarvannan G, Covaci A, Van Grieken R. Spatial monitoring of organohalogen compounds in surface water and sediments of a rural-urban river basin in Tanzania. Sci Total Environ 2013;447:186-97.
30. Barakat AO, Khairy M, Aukaily I. Persistent organochlorine pesticide and PCB residues in surface sediments of Lake Qarun, a protected area of Egypt. Chemosphere 2013;90:2467-76.
31. Nouira T, Risso C, Chouba L, Budzinski H, Boussetta H. Polychlorinated biphenyls (PCBs) and Polybrominated Diphenyl Ethers (PBDEs) in surface sediments from Monastir Bay (Tunisia, Central Mediterranean): occurrence, distribution and seasonal variations. Chemosphere 2013;93:487-93.
32. Verhaert V, Covaci A, Bouillon S, et al. Baseline levels and trophic transfer of persistent organic pollutants in sediments and biota from the Congo River Basin (DR Congo). Environ Int 2013;59:290-302.
33. Ozyürek NA, Gedik K, Siltu E, Imamoğlu I. Levels and sources of polychlorinated biphenyls in Ankara creek sediments, Turkey. J Environ Sci Health A Tox Hazard Subst Environ Eng 2013;48:800-8.
34. Zhao L, Hou H, Zhou Y, Xue N, Li H, Li F. Distribution and ecological risk of polychlorinated biphenyls and organochlorine pesticides in surficial sediments from Haihe River and Haihe Estuary Area, China. Chemosphere 2010;78:1285-93.
35. Tolosa I, Mesa-Albernas M, Alonso-Hernandez CM. Organochlorine contamination (PCBs, DDTs, HCB, HCHs) in sediments from Cienfuegos bay, Cuba. Mar Pollut Bull 2010;60:1619-24.
36. Eqani SA, Malik RN, Zhang G, Mohammad A, Chakraborty P. Polychlorinated biphenyls (PCBs) in the sediments of the River Chenab, Pakistan. Chemi Ecol 2012;28:327-39.
37. Leung A, Cai ZW, Wong MH. Environmental contamination from electronic waste recycling at Guiyu, southeast China. J Mater Cycles Waste Manag 2006;8:21-33.
38. Martinez A, Norström K, Wang K, Hornbuckle KC. Polychlorinated biphenyls in the surficial sediment of Indiana Harbor and Ship Canal, Lake Michigan. Environ Int 2010;36:849-54.
39. Zahed MA, Nabi Bidhendi G, Pardakhti A, Esmaili-Sari A, Mohajeri S. Determination of polychlorinated biphenyl congeners in water and sediment in North West Persian Gulf, Iran. Bull Environ Contam Toxicol 2009;83:899-902.
40. Subedi B, Yun S, Jayaraman S, Bergen BJ, Kannan K. Retrospective monitoring of persistent organic pollutants, including PCBs, PBDEs, and polycyclic musks in blue mussels (Mytilus edulis) and sediments from New Bedford Harbor, Massachusetts, USA: 1991-2005. Environ Monit Assess 2014;186:5273-84.
41. VROM. Intervention values and target values: soil quality standards, Netherlands Ministry of Housing, Spatial Planning and Environment, Department of Soil Protection. The Hague, Netherlands. Available from: https://www.esdat.net/environmental%20standards/dutch/annexs_i2000dutch%20environmental%20standards.pdf [Last accessed on 5 Sep 2022].
42. ANZECC/NHMRC (Australia and New Zealand Environment and Conservation Council/National Health and Medical Research Centre). Guideline for assessment and management of contaminated soil. Available from: http://www.nepc.gov.au/system/files/resources/378b7018-8f2a-8174-3928-2056b44bf9b0/files/anzecc-gl-assessment-site-containment-contaminated-soil.pdf [Last accessed on 5 Sep 2022].
43. CCME (2007). Canadian Soil Quality Guidelines for the Protection of Environmental and Human Health. Available from: https://www.esdat.net/environmental%20standards/canada/soil/rev_soil_summary_tbl_7.0_e.pdf [Last accessed on 5 Sep 2022].
44. Rudel RA, Seryak LM, Brody JG. PCB-containing wood floor finish is a likely source of elevated PCBs in residents’ blood, household air and dust: a case study of exposure. Environ Health 2008;7:2.
45. Williams LL, Giesy JP. Relationships Among Concentrations of Individual Polychlorinated Biphenyl (PCB) Congeners, 2,3,7,8-Tetrachlorodibenzo-P-Dioxin Equivalents (TCDD-EQ), and Rearing Mortality of Chinook Salmon (Oncorhynchus Tshawytscha) Eggs from Lake Michigan. J Great Lakes Res 1992;18:108-24.
46. Giesy JP, Verbrugge DA, Othout RA, et al. Contaminants in fishes from Great Lakes-influenced sections and above dams of three Michigan rivers. I: Concentrations of organo chlorine insecticides, polychlorinated biphenyls, dioxin equivalents, and mercury. Arch Environ Contam Toxicol 1994;27:202-12.
47. Hugla JL, Thys I, Hoffman L, et al. Contamination par les PCBs et les pesticides organochlorés des poissons du Grand-Duché de Luxembourg : incidence possible surles populations de loutre (Lutra lutra L.). Annales de Limnologie - Inte J Limnol 1998;34:201-9.
48. Adeyemi D, Ukpo G, Anyakora C, et al. Polychlorinated biphenyl in fish samples from Lagos Lagoon, Nigeria. Afr J Biotechnol 2009;8:2811-2815. Available from: https://www.ajol.info/index.php/ajb/article/view/60880 [Last accessed on 6 Sep 2022]
49. Oziolor EM, Apell JN, Winfield ZC, Back JA, Usenko S, Matson CW. Polychlorinated biphenyl (PCB) contamination in Galveston Bay, Texas: Comparing concentrations and profiles in sediments, passive samplers, and fish. Environ Pollut 2018;236:609-18.
50. Cocco E, Guignard C, Hoffmann L, Bohn T. Rapid analysis of polychlorinated biphenyls in fish by pressurised liquid extraction with in-cell cleanup and GC-MS. Int J Envir Analyt Chem 2011;91:333-47.
51. Voorspoels S, Covaci A, Maervoet J, De Meester I, Schepens P. Levels and profiles of PCBs and OCPs in marine benthic species from the Belgian North Sea and the Western Scheldt Estuary. Mar Pollut Bull 2004;49:393-404.
52. Jiang QT, Lee TK, Chen K, et al. Human health risk assessment of organochlorines associated with fish consumption in a coastal city in China. Environ Pollut 2005;136:155-65.
53. Uekusa Y, Takatsuki S, Tsutsumi T, et al. Determination of polychlorinated biphenyls in marine fish obtained from tsunami-stricken areas of Japan. PLoS One 2017;12:e0174961.
54. Jafarabadi A, Riyahi Bakhtiari A, Mitra S, Maisano M, Cappello T, Jadot C. First polychlorinated biphenyls (PCBs) monitoring in seawater, surface sediments and marine fish communities of the Persian Gulf: Distribution, levels, congener profile and health risk assessment. Environ Pollut 2019;253:78-88.
Cite This Article
How to Cite
Download Citation
Export Citation File:
Type of Import
Tips on Downloading Citation
Citation Manager File Format
Type of Import
Direct Import: When the Direct Import option is selected (the default state), a dialogue box will give you the option to Save or Open the downloaded citation data. Choosing Open will either launch your citation manager or give you a choice of applications with which to use the metadata. The Save option saves the file locally for later use.
Indirect Import: When the Indirect Import option is selected, the metadata is displayed and may be copied and pasted as needed.
About This Article
Special Topic
Copyright


Comments
Comments must be written in English. Spam, offensive content, impersonation, and private information will not be permitted. If any comment is reported and identified as inappropriate content by OAE staff, the comment will be removed without notice. If you have any queries or need any help, please contact us at [email protected].