

Regional deposited dose in the human respiratory tract using different particulate metrics

Abstract
The objective of the current study was to calculate the deposited dose rate in the human respiratory tract arising from particle number (PN) and particle mass (PM) measurements. A main objective was the investigation of deposition pattern and characteristics of the two metrics in the human respiratory tract. The dose rate was estimated for residents at a suburban background location (Chania, Greece). The total dose rate showed two peaks, one in the morning (1.6 × 10⁹ particles/h at 7:00-8:00) and the other one at night (2.1 × 10⁹ particles/h at 21:00-22:00), during the warm period, while the cold period showed two peaks, morning (2.0 × 10⁹ particles/h at 9:00-10:00) and afternoon (3.6 × 10⁹ particles/h at 18:00-19:00). The peaks during the warm period were associated with traffic emissions, whereas the peaks during the cold period were associated with both heating and traffic emissions. A higher dose rate of PN10 was found in the alveolar region while for PM10 it was found in the extrathoracic region. These findings are linked with increased contribution of ultrafine and coarse particles to PN10 (65%-78% and 54%-62% for cold and warm periods, respectively) and PM10 (63% and 55% for cold and warm periods, respectively) concentrations, respectively. The current study showed the importance to use both number and mass aerosol metrics for determining the human exposure and regional dose and their related health effects. The novelty of the current study is the simultaneous measurements of the two particles metrics and the full particle size distributions to make accurate estimates of regional deposited dose.
Keywords
INTRODUCTION
Human exposure to particle number (PN) and particle mass (PM) concentrations has been studied extensively in the scientific literature[1-8]. Investigation of population exposure, especially in urban areas, is important because of the associated health hazard that comes to the residents. Inhalation of airborne particles and the corresponding deposition in the human respiratory tract are directly linked with their concentration. Ambient levels of airborne particles depend on several parameters such as the geographical position, climatological characteristics, urbanization, population density, and anthropogenic activities[7,9-12], as well as different characteristics that accompany the particle size distributions (number vs. mass).
Airborne particles can be classified into different size classes (ultrafine, fine, and coarse). Accordingly, fine particles are particles with a diameter less than 2.5 μm, while coarse particles are considered those having diameters ranging from 2.5 to 10 μm. Ultrafine particles are a subset of fine particles, defined as those particles with a diameter less than 100 nm. The main sources of ultrafine and - generally - fine particles are combustion processes such as traffic exhaust, biomass burning, industry, energy production, and aviation[3,13], whereas coarse particles usually originate from soil resuspension, sea spray/salt, and Saharan dust[3,14]. In principle, ultrafine particles are the dominant contributor to the particle number size distribution, whereas the opposite is found when evaluating the particle mass size distribution[2,3,13,15]. The latter is dominated by larger particles due to the significant mass input of coarser particles in the size distribution.
Estimation of the deposited dose of nanoparticles is important due to their ability to penetrate and deposit in the alveolar region, causing significant human health consequences. The increased concern arises for ultrafine particles (< 100 nm) because they are toxic and can cause several adverse health effects on the respiratory and cardiovascular systems such as ischemic heart diseases, oxidative stress, cancer, systemic/pulmonary inflammation, and arrhythmia events[16-18]. Moreover, ultrafine particles are therefore retained longer in the lungs and cause more serious pulmonary inflammation compared to larger particles[19]. Particles in the size range 0.1-1.0 μm are exhaled and, hence, have the lowest total deposition in the human respiratory tract[20]. Coarse particles are responsible for the majority of inflammatory responses to PM10[21].
The regional deposited dose in the human respiratory tract incorporating particle number size distribution data is completely different than that incorporating particle mass size distribution data as a direct consequence of the different inherent characteristics of the two size distributions. Recently,
Estimation of the regional deposited dose rate of airborne particles in the human respiratory tract is an important step for understanding the health effects arising from the inhaled particles. In turn, health effects depend on particle deposition within the human respiratory tract. In the current study, the deposited dose rate was calculated for two particles metrics (mass and number). The simulations were performed on an adult male in a suburban background location. In addition, the study focused on estimating the effect of different characteristics (age, gender, and activity level) of the exposed subject on the deposited dose rate.
MATERIAL AND METHODS
Study area and field measurements
Field measurements were performed at the Akrotiri monitoring station, which is located within the campus of the Technical University of Crete (Chania, Greece). The station is approximately 5 km from the city center of Chania with the surrounding area characterized by medium traffic and consists of a mixed area with agricultural land/farms and low-density residential areas[12,26]. Therefore, the study area is considered a suburban background site with a significant input from the marine environment due to its proximity to the coastline (2 km).
Α Scanning Mobility Particle Sizer (SMPS 3938, TSI) consisting of an Electrostatic Classifier 3082 (TSI), a long Differential Mobility Analyzer 3081 (TSI), and a Condensation Particle Counter 3775 (TSI), was used for measuring the particle number size distribution of fine particles. The instrument was operated with aerosol sample flow rate at 0.3 lpm and sheath flow rate at 3 lpm, with the midpoint particle mobility diameter ranging from 13.1 to 661.2 nm (110 size channels). In addition, an Optical Particle Sizer 3330 (OPS, TSI) was used for measuring the particle number size distribution from 0.3 to 10 µm in 16 discrete size channels.
Measurement of the particle mass concentration was performed through a portable aerosol particulate monitor (Dust Trak 8530 EP, TSI) using a PM10 pre-head, while an Andersen Cascade Impactor (ACI) was used for obtaining the particle mass size distribution. ACI collected size-segregated particle mass fractions into nine size intervals: four size fractions for fine particles (PM2.1) and five size fractions for coarse particles (PM2.1-10). Two sampling campaigns were performed: During the first (Campaign I), the particle number size distribution of fine particles was measured throughout a warm period and a cold period. During the second (Campaign II), a full size distribution was obtained by simultaneous measurements of the particle number size distribution (PNSD) with the SMPS and the OPS [Supplementary Figure 1]. In addition to the PNSD measurements, the particle mass concentration and size distribution were measured again throughout a warm period and a cold period. A detailed description of the sampling periods of each campaign is shown in Table 1. In total, the sampling period corresponds to 57 days (32 days for the warm period and 24 days for the cold period) during Campaign I, while, during Campaign II, field measurements were performed for 27 days (13 for the cold period and 14 for the warm period). Field measurements of the particle mass size distribution were performed for six days (four samplings during the cold period and two samplings during the warm period, Supplementary Figure 2).
Instruments and sampling periods at Akrotiri station
| Instrument | Sampling period | |
| Campaign I | SMPS | 20/08/20 -10/10/20 02/11/20-05/02/ 21 |
| Campaign II | SMPS | 24/11/20-30/01/21 24/05/21-09/06/21 |
| OPS Dust Trak 8530 | 24/11/20-30/01/21 24/05/21-09/06/21 | |
| Andersen | 27/11/20-08/01/21 22-28/05/21 |
Dosimetry model
Exposure Dose Model (ExDoM2) is a dosimetry model developed to incorporate ambient particulate concentrations in order to determine the deposited dose rate of the inhaled particles[27]. Simulations can be conducted using freely the particle mass or number measurements depending on the available dataset. In the current study, simulations were performed considering a 24 h exposure in the outdoor environment by assuming a light exercise activity level for an adult male resident.
The deposition module of ExDoM2 is based on the International Commission on Radiological Protection (ICRP) model; therefore, it treats the human respiratory tract as a series of filters[28,29]. Accordingly, the human respiratory tract is divided into nine filters distributed as follows: two in the anterior nose region (ET1); two in the posterior nasal passages, pharynx, and larynx region (ET2); two in the bronchial (BB) region; two in the bronchiolar (bb) region; and one in the AI region. Therefore, the deposition fraction can be sorted within five regions (ET1, ET2, BB, bb, and AI) and estimated as[28]:
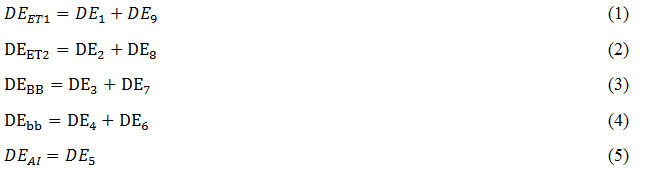
where DE1, DE2 ,DE3, and DE4 are the deposition fractions in the ET1, ET2, BB, and bb filters (inhalation), respectively; DE5 is the deposition fraction in the AI filter (inhalation and exhalation); and DE6, DE7 , DE8, and DE9 are the deposition fractions in the bb, BB, ET2, and ET1 filters (exhalation), respectively. The deposition fraction in each filter depends on the fraction of tidal air that reaches the j filter (φj), the prefiltration efficiency (n0), and the deposition efficiency of each filter (nj).
The prefiltration efficiency (n0) was estimated as[28]:

where nI is the inhalability of particles.
The deposition efficiency (nj) was calculated by[28]:

where nae is the aerodynamic deposition efficiency due to impaction and gravitational settling and nth is the thermodynamic deposition efficiency due to diffusion.
The φj during inhalation was calculated by[28]:
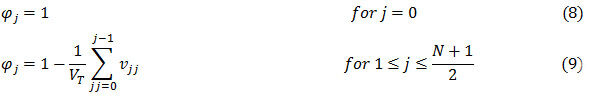
where VT is the tidal volume (mL), vjj is the volume of a preceding filter (mL), and N is the number of filters.
The φj during exhalation was calculated by [28]:

The mobility diameter was converted into the aerodynamic diameter using the following equation[5]:

where dm is the mobility diameter, χ is the shape factor of particles, ρ is the density of particles, C(dm) is the Cunningham slip correction for a particle of mobility diameter, and C(dae) is the Cunningham slip correction factor for a particle of aerodynamic diameter.
In the present work, the results were classified into three regions: the extrathoracic, tracheobronchial (TB), and alveolar-interstitial regions. The extrathoracic region includes ET1 and ET2, while the TB region includes BB and bb. Finally, a redistribution of 65% to ET1 and 35% to ET2 regions for individual depositions was incorporated, as proposed by ICRP[29].
Clearance
According to ICRP[29], the respiratory tract clearance model consists of 13 compartments. The retained dose of particles in each compartment j and the dose to the esophagus, lymph nodes, and blood was estimated by Equation (12), while Equation (13) was used for rapidly and slowly dissolving particles[22]:
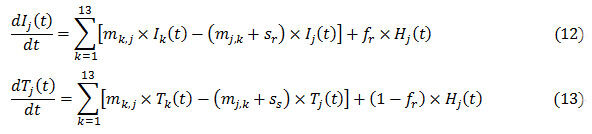
where mk,j is the mechanical movement rate of particles from compartment k to j; mj,k is the mechanical movement rate of particles from compartment j to k; fr is the fraction of particles dissolved rapidly; sr is the rapid dissolution rate; ss is the slow dissolution rate, Hj is the deposited dose in the compartment j; Ij and Ik are the retained doses of particles dissolving relatively rapidly in the compartment j and k, respectively; and Tj and Tk are the retained doses of particles dissolving slowly in the compartment j and k, respectively. The absorption of particles in the blood was assumed to be moderate. The default values for fr, sr, and ss during moderate absorption were based on ICRP recommendations[29]. Therefore, fr, sr, and ss were set equal to 0.2, 3, and 0.005 d−1, respectively[29].
RESULTS AND DISCUSSION
Diurnal and seasonal variation of deposited number dose rate
The diurnal variations of the deposited dose rate at the Akrotiri station during the warm and cold periods are presented in Figure 1A. The diurnal profile was characterized by two peaks, one in the morning

Figure 1. (A) Deposited dose rate (particles/h) and (B) cumulative deposited dose (particles) in the human respiratory tract during warm and cold periods.
Furthermore, the seasonal comparison showed that the deposited dose during the cold period preserved higher rates compared to the warm period. A similar observation was observed by Voliotis and Samara[33] with cold/warm ratios being equal to 1.2 and 1.6 at the urban traffic and urban background sites in Thessaloniki (Greece), respectively. Domestic heating emissions during the cold period increased the particle number concentrations and the corresponding deposited dose rates. Specifically, the total particle number concentration and dose rate reached 4047 particles/cm3 and 2.1 × 10⁹ particles/h (21:00-20:00) during the warm period, while the corresponding values during the cold period were 6553 particles/cm3 and 3.6 × 10⁹ particles/h (18:00-19:00), respectively. It was also characteristic that the deposited dose rate followed similar temporal variations with particle concentrations [Supplementary Figure 3]. In the study of Voliotis and Samara[33], the peak dose rate during the cold period was observed at night (21:00-22:00) with a rate of 4 × 10¹⁰ particles/h in the urban background site. Intensive wood burning for residential heating purposes was the reason for the high rates, whereas the urban traffic diurnal variations followed traffic flow (9:00, 12:00, and 22:00) with the deposited dose rate during morning peak reaching values close to 7 × 10¹⁰ particles/h. Urban anthropogenic activities (traffic emissions and residential heating) are important sources which cause increased deposited dose rates.
The cumulative deposited dose for the warm and cold periods is shown in Figure 1B. A higher cumulative deposited dose was obtained during the cold period (4.6 × 10¹⁰ particles/day) in comparison with the warm period (3.4 × 10¹⁰ particles/day) as a direct consequence of increased concentration due to the heating emissions. In addition, it was observed that in the early morning hours (1:00-8:00, Figure 1B) the cumulative dose for the two periods was almost equal, as a direct consequence of the similar dose rate obtained for this part of the day [Figure 1A]. Interestingly, the results of this campaign indicate that hourly fine particle number concentrations fluctuate at similar levels after midnight (cold vs. warm periods, Supplementary Figure 3), an observation that is influenced by several factors such as the intensity of local sources, temporal variations, and ambient conditions. The daily doses in the current study were close to the results reported by Hussein et al., where the daily deposited dose obtained for submicron particles for an adult male living in Helsinki was found equal to 5.7 × 10¹⁰ and 4.0 × 10¹⁰ particles/day on workdays and weekends, respectively[34]. In addition, they pointed out that the daily deposited dose would be higher in real-life condition, when indoor sources/activities are also considered.
The deposition fraction in the three regions of the human respiratory for both periods is given in Table 2. A higher deposition fraction was obtained for both cases in the AI region with the deposition fraction being slightly higher during the cold period in comparison with the warm period. Specifically, the deposition in the AI region was equal to 21.7% and 24.2% during the warm and cold periods, respectively. Besides the fact that the deposition fraction did not show important differences between the two periods, the deposited dose rate and the daily deposited dose during the cold period were higher than in the warm period as a direct consequence of higher PN concentrations. Therefore, seasonal variations showed only a slight influence on the deposition fraction but had a large effect on the dose rate and daily dose due to differences in PN concentrations. Regarding the other two regions (ET and TB), the deposition was considerably lower
Average deposition (%) in the three regions (ET, TB, and AI) of the human respiratory tract during warm and cold periods
| ET | TB | AI | |
| Warm period | 5.0 | 5.3 | 21.7 |
| Cold period | 5.3 | 5.9 | 24.2 |
Deposition fraction size distribution characteristics
Simulations revealed that the deposition fraction was higher in the AI region for particles in the size range 13-322 nm, while for particles in the size range 334-661 nm the deposition fraction was higher in the ET region [Figure 2]. This finding is linked with the deposition mechanism, especially diffusion, which is the main physical mechanism of particle deposition in AI and its characteristic to increase with decreasing particle size[29,36]. Previous studies have reported that the effect of diffusion is dominant for particles with diameters less than 300-500 nm.

Figure 2. Simulations of fine particle deposition fraction distributions in the respiratory tract of an adult male (light exercise).
The present results are in agreement with the results reported in previous studies. Particularly, Vu et al. found that while walking or cycling the deposition fraction was higher in the AI region for particles with a mobility diameter range of 10-300 nm, while the deposition fraction was higher in the ET region for particles in the 350-560 nm size range[8]. Chalvatzaki and Lazaridis[37] found that the deposition fraction of NaCl without considering the hygroscopicity effect was higher in the AI region for particles with aerodynamic diameters ranging from 15-550 nm, while taking into consideration hygroscopicity the deposition in the AI region was higher for particles in the size range 30-200 nm. This change occurs due to hygroscopic particle growth inside the human respiratory tract.
In addition, it was observed that the highest total deposition fraction occurred for nanoparticles in the lower part of the size distribution (13.1 nm). Patterson et al. asserted that the higher total deposition fraction in conjunction with the smaller size causes higher health risk due to the increased possibility to penetrate to the deep lung with more mutagens[38].
Impact of activity level and exposed subject to the dose rate
The impact of the activity level (sitting, light exercise, and heavy exercise) of the exposed subject (adult male) on the deposited dose rate (particles/h) obtained from particle number size distribution data during the cold period is presented in Table 3. It was observed that the deposited dose rate increased with increasing the activity level with the median deposited dose rate increasing from 6.7 × 10⁸ (sitting at rest) to 35.4 × 10⁸ particles/h (heavy exercise). This finding is attributed to the higher inhalation rate
Deposited dose rate (median values and confidence interval using student t-test distribution) in the human respiratory tract (total) for different activity levels of adult males and for different characteristics (age & gender) of the exposed subject
| Dose rate (× 108 particles/h) | Confidence interval (× 108 particles/h) | ||
| Lower | Upper | ||
| Adult male | |||
| Sitting | 6.7 | 6.5 | 8.8 |
| Light exercise | 16.7 | 16.3 | 21.9 |
| Heavy exercise | 35.4 | 34.4 | 46.3 |
| Light exercise | |||
| Adult male | 16.7 | 16.3 | 21.9 |
| Adult female | 14.1 | 13.7 | 18.5 |
| 15-year-old male | 14.9 | 14.5 | 19.5 |
| 15-year-old female | 14.3 | 13.9 | 18.7 |
| 10-year-old | 12.1 | 11.8 | 15.9 |
| 5-year-old | 6.3 | 6.1 | 8.3 |
To examine the effect of age and gender on the deposited dose rate, the same activity level (light exercise) for all exposed subjects was adopted. Table 3 shows that the median deposited dose rate in the human respiratory tract was higher in adult males (16.7 × 10⁸ particles/h) than in adult females (14.1 × 10⁸ particles/h). Likewise, the deposited dose rate in the human respiratory tract was higher in adult males than in children. These findings are attributed to the higher inhalation rate of an adult male in comparison with an adult female or children. Hussein et al. also showed that the deposited dose rate when walking (4 km/h) for sub-micron particles (PN1) was higher for an adult male (77 × 108 particles/h) than an adult female
Mass and number dose rates
The hourly exposure concentrations (μg/m3 or particles/cm3) and the corresponding deposited dose rates (μg/h or particles/h) for PM10 and PN10 during the cold and warm periods are presented in Figure 3. The results show that the regional deposited dose differed between the two metrics (mass and number). A higher deposited dose rate for PM10 was obtained in the ET region (10-22 and 8-10 μg/h for cold and warm periods, respectively), while, for PN10 the higher deposited dose rate corresponded to the AI region (6 × 10⁸-2 × 10⁹ and 4 × 10⁸-7 × 10⁸ particles/h for cold and warm periods, respectively). These findings are directly linked with the contribution of coarse and ultrafine particles to the particle mass and number size distributions, respectively. Table 4 indicates that coarse particles have negligible contribution to PN10 but are the dominant contributor to PM10. The opposite characteristic was observed for ultrafine particles.

Figure 3. Hourly exposure concentrations of (A) PM10 and (B) PN10 and the corresponding deposited dose rates based on (C) mass and (D) number metrics during cold and warm periods. AI: Alveolar-interstitial; ET: extrathoracic; PM: particle mass; PN: particle number; TB: tracheobronchial.
Contribution of ultrafine, fine, and coarse particles to the particle mass (PM10) and number (PN10) size distributions
| Contribution of ultrafine particles | Contribution of fine particles | Contribution of coarse particles | |
| Cold period | |||
| Mass | 6* | 37 | 63 |
| Number** | 71 ± 3 | 100 | ≈0 |
| Warm period | |||
| Mass | 5* | 45 | 55 |
| Number** | 59 ± 2 | 100 | ≈0 |
It was observed that heating emissions during cold period increased the deposited dose rate for both metrics (PM10 and PN10). Specifically, the deposited dose increased by 131% and 59% during the cold period for PΝ10 and PΜ10, respectively. In addition, the deposited dose rate for both cases (PM10 and PN10) in the human respiratory tract (total) was lower in comparison with previous studies[5,43,44]. Manigrasso et al. calculated the deposited dose of PM10 at an urban background site in Rome and found that the total dose rate ranged from 8.4 to 72 μg/h in February while in the current study it ranged from 12-26 μg/h during the cold period and 10-13 μg/h during the warm period[5]. The urban background site in Rome is close to three roads, and hence higher values were obtained in comparison to the current study. Hussein et al. found that the deposited dose rate of PM10 was in the range 49-439 μg/h for an adult male under different physical exertion levels (e.g., sitting, standing, driving a car, walking, and running) and environments (e.g., urban, rural, and main road) in an eastern Mediterranean city, highlighting the importance of the type of environment for dosimetry calculations[43]. Regarding PN10, Manigrasso et al. found that the dose ranged from 2.1 × 10⁹-2.4 × 10¹⁰ particles/h in February, while in the current study it ranged from
Clearance of deposited PM10
Clearance of deposited PM10 particles from the human respiratory tract estimated from concentrations of the cold period is presented in Figure 4. Simulations showed that 224 μg were transferred to the esophagus (gastrointestinal tract), 9 μg were absorbed into the blood, 1.1 × 10⁻⁴ μg were transferred to the lymph nodes, and 167 μg remained in the respiratory tract (of the total 437 μg deposited to the respiratory tract at the end of the exposure). Thus, the majority of the deposited particles in the human respiratory tract were transferred to the esophagus (51%), a finding that is associated with the high deposited dose in the ET region due to the high contribution of coarse particles to PM10. The clearance of PM10 depends on the deposition sites: the deposited particles in the ET region are transferred mainly to the GI tract (esophagus) via mucociliary clearance, while the deposited particles in the TB and AI regions require more time to transfer to the ET2 region and are swallowed to the GI tract, and hence they remain in the respiratory tract and absorbed to the blood[22]. Tomasi et al. asserted that mucociliary clearance is a fast process for PM10, while for particles with a diameter less than 3 μm the clearance is less efficient[45]. Thompson et al. asserted that 40%-50% of the total mass is retained in the human respiratory tract, which is slightly higher than what was found in the current study (38%)[46]. The present model (ExDoM2) has been used in other studies[22,47] to assess the clearance of PM. Specifically, Chalvatzaki et al. applied the model to data from three European cities and found that the dose to the esophagus was equal to 44, 84, and 172 μg for Kuopio, Athens, and Lisbon, respectively[22]. Therefore, the dose to esophagus for all three cities was lower in comparison to the current study. Nevertheless, PM concentrations in Athens (20 μg/m3) and Lisbon (37 μg/m3) were higher than that in the current study (17 μg/m3). The lower dose in the aforementioned cities is linked with the size distribution characteristics; for example, coarse particles corresponded to 63% of the total measured mass concentration in this study, whereas in Athens, Lisbon, and Kuopio they corresponded to 44%, 42%, and 40%, respectively. In addition, Vicente et al. applied ExDoM2 and found that the dose to esophagus was equal to 380 and 159 μg for an adult male exposed to wood smoke (indoor) from fireplace and woodstove, respectively, with the corresponding outdoor values being considerably lower (152 and 95 μg, respectively)[47]. This finding is associated with a high risk of developing GI cancer due to indoor biomass burning. Specifically, Sheikh et al. found that household biomass burning increased the risk for GI cancer and proposed replacing biomass with natural gas[48]. Therefore, the dose received by a resident during the cold period is significant due to the higher concentration of PM10 and the associated increased health effects (increased risk for GI cancer due to transfer of deposited particles to esophagus).

Figure 4. (A) Dose (deposited and retained) in the human respiratory tract, esophagus, and blood; and (B) dose in the lymph nodes.
CONCLUSIONS
The dosimetry model ExDoM2 was used to obtain the deposited dose rates of airborne particles in the human respiratory tract in a suburban background site. The novelty of the current study is the combination of concentration and full-size distribution (0.01-10 μm) data for two particle metrics (number and mass), giving a more complete view of human exposure and dose. In turn, the main limitation of the current study is that only the outdoor environment was considered for the calculation of deposited dose, and hence different microenvironments (e.g., home) were not considered during a daily pattern.
Traffic and heating emissions were recognized as significant urban-associated sources that caused an increased deposited dose rate in the human respiratory tract. The activity level, age, and gender of the exposed subjects played significant roles in the calculation of the deposited dose rate. Specifically, the deposited dose rate in the respiratory tract was 1.2 times higher in an adult male than in an adult female. Furthermore, the deposited dose rate was 1.1-2.6 times higher in an adult male than in children, while the deposited dose rate for a 15-year-old male was 1.1 times higher than an adult female. Finally, calculations for three activity levels (sitting, light exercise, and heavy exercise) showed that the deposited dose rate was higher during heavy exercise due to the higher inhalation rate.
Regarding the simultaneous measurements of PM10 and PN10, the results show that PM10 was deposited mainly in the ET region (cold period, 10-22 μg/h; warm period, 8-10 μg/h) while PN10 was deposited mainly in the AI region (cold period, 5.7 × 10⁸-2.5 × 10⁹ particles/h; warm period, 4.4 × 10⁸-6.9 × 10⁸ particles/h). The high deposited dose of PM10 in the ET region was associated with a high contribution from coarser particles, whereas the high deposited dose of PN10 was associated with a high contribution from ultrafine particles. Overall, simulations demonstrated that seasonal variations and particle origin from variable sources with differences in the size distributions resulted in different regional deposited doses, thus are linked with different health impacts.
DECLARATIONS
Authors’ contributions
Conducted model calculations with ExDoM2, performed data analysis and prepared the manuscript: Chalvatzaki E
Performed the field measurements and Review/edit of the manuscript: Chatoutsidou SE
Made substantial contributions to conception, design of the study and review/edit of the manuscript: Lazaridis M
All authors read and approved the final manuscript.
Availability of data and materials
The data is available in the report and supplementary material. Additional data and information can be made available at request from individuals interested.
Financial support and sponsorship
The current work was supported by the Action titled “National Νetwork on Climate Change and its
Conflicts of interest
All authors declared that there are no conflicts of interest.
Ethical approval and consent to participate
Not applicable.
Consent for publication
Not applicable.
Copyright
© The Author(s) 2022.
Supplementary Materials
REFERENCES
1. Buonanno G, Morawska L, Stabile L, Wang L, Giovinco G. A comparison of submicrometer particle dose between Australian and Italian people. Environ Pollut 2012;169:183-9.
2. Buonanno G, Stabile L, Morawska L. Personal exposure to ultrafine particles: the influence of time-activity patterns. Sci Total Environ 2014;468-469:903-7.
4. Manigrasso M, Natale C, Vitali M, Protano C, Avino P. Pedestrians in traffic environments: ultrafine particle respiratory doses. Int J Environ Res Public Health 2017;14:288.
5. Manigrasso M, Costabile F, Liberto LD, et al. Size resolved aerosol respiratory doses in a Mediterranean urban area: From PM10 to ultrafine particles. Environ Int 2020;141:105714.
6. Matson U. Indoor and outdoor concentrations of ultrafine particles in some Scandinavian rural and urban areas. Sci Total Environ 2005;343:169-76.
7. Querol X, Alastuey A, Ruiz C, et al. Speciation and origin of PM10 and PM2.5 in selected European cities. Atmospheric Environment 2004;38:6547-55.
8. Vu TV, Zauli-sajani S, Poluzzi V, Harrison RM. Factors controlling the lung dose of road traffic-generated sub-micrometre aerosols from outdoor to indoor environments. Air Qual Atmos Health 2018;11:615-25.
9. Baek JI, Ban YU. The Impacts of Urban Air Pollution Emission Density on Air Pollutant Concentration Based on a Panel Model. Sustainability 2020;12:8401.
10. Rivas I, Beddows DCS, Amato F, et al. Source apportionment of particle number size distribution in urban background and traffic stations in four European cities. Environ Int 2020;135:105345.
11. Rizza V, Stabile L, Buonanno G, Morawska L. Variability of airborne particle metrics in an urban area. Environ Pollut 2017;220(Pt A):625-35.
12. Kopanakis Ι, Chatoutsidou SE, Glytsos T, Lazaridis M. Impact from local sources and variability of fine particle number concentration in a coastal sub-urban site. Atmospheric Research 2018;213:136-48.
13. Chatain M, Alvarez R, Ustache A, Rivière E, Favez O, Pallares C. Simultaneous roadside and urban background measurements of submicron aerosol number concentration and size distribution (in the range 20-800 nm), along with chemical composition in strasbourg, france. Atmosphere 2021;12:71.
14. López-caravaca A, Castañer R, Clemente A, et al. The impact of intense winter Saharan dust events on PM and optical properties at urban sites in the southeast of the Iberian Peninsula. Atmosphere 2021;12:1469.
15. Rovelli S, Cattaneo A, Borghi F, et al. Mass Concentration and size-distribution of atmospheric particulate matter in an urban environment. Aerosol Air Qual Res 2017;17:1142-55.
16. Protano, Vitali, Avino. Nanoparticle behaviour in an urban street canyon at different heights and implications on indoor respiratory doses. Atmosphere 2019;10:772.
17. Moreno-ríos AL, Tejeda-benítez LP, Bustillo-lecompte CF. Sources, characteristics, toxicity, and control of ultrafine particles: an overview. Geoscience Frontiers 2022;13:101147.
18. Ohlwein S, Kappeler R, Kutlar Joss M, Künzli N, Hoffmann B. Health effects of ultrafine particles: a systematic literature review update of epidemiological evidence. Int J Public Health 2019;64:547-59.
20. Brown JS. Chapter 27-deposition of particles. Compar Bio Normal Lung (Second Edition) ;2015:513-36.
21. Zwozdziak A, Gini MI, Samek L, Rogula-kozlowska W, Sowka I, Eleftheriadis K. Implications of the aerosol size distribution modal structure of trace and major elements on human exposure, inhaled dose and relevance to the PM2.5 and PM10 metrics in a European pollution hotspot urban area. J Aeros Sci 2017;103:38-52.
22. Chalvatzaki E, Chatoutsidou S, Mammi-galani E, et al. Estimation of the personal deposited dose of particulate matter and particle-bound metals using data from selected European cities. Atmosphere 2018;9:248.
23. Manojkumar N, Srimuruganandam B. Age-specific and seasonal deposition of outdoor and indoor particulate matter in human respiratory tract. Atmosph Poll Res 2022;13:101298.
24. Chalvatzaki E, Chatoutsidou SE, Kopanakis I, et al. Personal deposited dose and its influencing factors at several Greek sites: an analysis in respect to seasonal and diurnal variations. Environ Sci Pollut Res Int 2021;28:29276-86.
25. Gini M, Manousakas M, Karydas AG, Eleftheriadis K. Mass size distributions, composition and dose estimates of particulate matter in Saharan dust outbreaks. Environ Pollut 2022;298:118768.
26. Chatoutsidou SE, Kopanakis I, Lagouvardos K, Mihalopoulos N, Tørseth K, Lazaridis M. PM10 levels at urban, suburban, and background locations in the eastern Mediterranean: local versus regional sources with emphasis on African dust. Air Qual Atmos Health 2019;12:1359-71.
27. Chalvatzaki E, Lazaridis M. Development and application of a dosimetry model (ExDoM2) for calculating internal dose of specific particle-bound metals in the human body. Inhal Toxicol 2015;27:308-20.
28. Human respiratory tract model for radiological protection. A report of a Task Group of the International Commission on Radiological Protection. Ann ICRP 1994;24:1-482.
29. Paquet F, Etherington G, Bailey MR, et al. ICRP. ICRP publication 130: occupational intakes of radionuclides: part 1. Ann ICRP 2015;44:5-188.
30. Pant P, Harrison RM. Estimation of the contribution of road traffic emissions to particulate matter concentrations from field measurements: a review. Atmospheric Environment 2013;77:78-97.
31. Rodríguez S, Van Dingenen R, Putaud J, et al. A study on the relationship between mass concentrations, chemistry and number size distribution of urban fine aerosols in Milan, Barcelona and London. Atmos Chem Phys 2007;7:2217-32.
32. Aalto P, Hämeri K, Paatero P, et al. Aerosol particle number concentration measurements in five European cities using TSI-3022 condensation particle counter over a three-year period during health effects of air pollution on susceptible subpopulations. J Air Waste Manag Assoc 2005;55:1064-76.
33. Voliotis A, Samara C. Submicron particle number doses in the human respiratory tract: implications for urban traffic and background environments. Environ Sci Pollut Res Int 2018;25:3372435.
34. Hussein T, Löndahl J, Paasonen P, et al. Modeling regional deposited dose of submicron aerosol particles. Sci Total Environ 2013;458-460:140-9.
35. Xing YF, Xu YH, Shi MH, Lian YX. The impact of PM2.5 on the human respiratory system. J Thorac Dis 2016;8:E69-74.
36. Hussain M, Pierre M. Lung deposition predictions of airborne particles and the emergence of contemporary diseases Part-I. the Health 2011;2:51. Available from: https://biophysics.sbg.ac.at/paper/thehealth [Last accessed on 10 Jun 2022].
37. Chalvatzaki E, Lazaridis M. Α dosimetry model of hygroscopic particle growth in the human respiratory tract. Air Qual Atmos Health 2018;11:471-82.
38. Patterson R. , Zhang Q, Zheng M, Zhu Y. Particle deposition in respiratory tracts of school-aged children. Aerosol Air Qual Res 2014;14:64-73.
39. Daigle CC, Chalupa DC, Gibb FR, et al. Ultrafine particle deposition in humans during rest and exercise. Inhal Toxicol 2003;15:539-52.
40. Hussein T, Boor BE, Löndahl J. Regional inhaled deposited dose of indoor combustion-generated aerosols in Jordanian urban homes. Atmosphere 2020;11:1150.
41. Oravisjärvi K, Pietikäinen M, Ruuskanen J, Rautio A, Voutilainen A, Keiski RL. Effects of physical activity on the deposition of traffic-related particles into the human lungs in silico. Sci Total Environ 2011;409:4511-8.
43. Hussein T, Saleh S, dos Santos V, Boor B, Koivisto A, Löndahl J. Regional inhaled deposited dose of urban aerosols in an eastern mediterranean city. Atmosphere 2019;10:530.
44. Buonanno G, Giovinco G, Morawska L, Stabile L. Tracheobronchial and alveolar dose of submicrometer particles for different population age groups in Italy. Atmospheric Environment 2011;45:6216-24.
45. Tomasi C, Fuzzi S, Kokhanovsky A. Atmospheric aerosols: Life cycles and effects on air quality and climate. Wiley-VCH. Verlag Gmbh & Co. KGaA, Boschstr. 12, 64469 Weinheim, Germany; 2017, pp704. Available from: https://books.google.com.hk/books?hl=zh-CN&lr=&id=5bCGDQAAQBAJ&oi=fnd&pg=PR15&dq=Tomasi+C,+Fuzzi+S,+Kokhanovsky+A.+Atmospheric+aerosols:+Life+cycles+and+effects+on+air+quality+and+climate.+Wiley-VCH.+Verlag+Gmbh+%26+Co.+KGaA,+Boschstr.+12,+64469+Weinheim,+Germany%3B+2017,+pp704.&ots=SahqgPxYSZ&sig=2FnOVk9HNYNrNQuSmkyRuZVuaJA&redir_esc=y#v=onepage&q&f=false [Last accessed on 10 Jun 2022].
46. Thompson JE. Airborne particulate matter: human exposure and health effects. J Occup Environ Med 2018;60:392-423.
47. Vicente ED, Alves CA, Martins V, Almeida SM, Lazaridis M. Lung-deposited dose of particulate matter from residential exposure to smoke from wood burning. Environ Sci Pollut Res Int 2021;28:65385-98.
Cite This Article
How to Cite
Download Citation
Export Citation File:
Type of Import
Tips on Downloading Citation
Citation Manager File Format
Type of Import
Direct Import: When the Direct Import option is selected (the default state), a dialogue box will give you the option to Save or Open the downloaded citation data. Choosing Open will either launch your citation manager or give you a choice of applications with which to use the metadata. The Save option saves the file locally for later use.
Indirect Import: When the Indirect Import option is selected, the metadata is displayed and may be copied and pasted as needed.
About This Article
Copyright


Comments
Comments must be written in English. Spam, offensive content, impersonation, and private information will not be permitted. If any comment is reported and identified as inappropriate content by OAE staff, the comment will be removed without notice. If you have any queries or need any help, please contact us at [email protected].