

Ambient air concentrations and risk assessment of selected organochlorine pesticides (OCPs) across five Middle Eastern countries

 , ...
, ... Abstract
This paper presents data obtained from concurrently deployed polyurethane foam disk passive samplers in Kuwait, Turkey, Lebanon, Saudi Arabia, and Oman between January and October 2018. The study’s main goal was to initiate a passive air sampling network across the Middle East to generate comparable data, which will help report obligations of the various countries and be used in protocol discussions. The ∑24OCP concentrations were highest in the samples collected from Kartaba in Lebanon (7780 pg·m-3), and the lowest concentration was recorded at the BUTAL site in the Bursa province of Turkey (7.27 pg·m-3). The mean ambient ∑24OCP concentrations on a country-specific basis over consecutive sampling campaigns were: Lebanon (1680 pg·m-3) > Bursa (Turkey) (78.7 pg·m-3) > Oman (55 pg·m-3) > Kuwait (42 pg·m-3) > Jeddah, Saudi Arabia (19.1 pg·m-3). The results show no cancer risk due to inhalation of organochlorine pesticides (OCPs) in ambient air. This study provides the first reliable measurements of the spatial variability in the atmospheric concentrations of OCPs across several Middle Eastern countries, providing a baseline for assessing time trends in air, one of the core matrices for the effectiveness evaluation of the Stockholm Convention on Persistent Organic Pollutants.
Keywords
INTRODUCTION
Persistent organic pollutants (POPs) are hazardous chemicals that are semi-volatile and resist degradation in the environment[1,2]. As a result, they have long half-lives in at least one environmental compartment, are typically lipophilic, and are prone to entering the gas phase at ambient temperatures and being transported over long distances[3,4]. Due to past uses, the presence of POPs in the environment is unavoidable[5,6], and they have even been found in pristine environments, such as the Arctic, where they had never been used[2,7,8]. Because of their ubiquity, persistence, high bioaccumulation potential, and harmful biological effects, these chemicals have drawn a lot of international attention, leading to the development of the “Stockholm Convention” (SC) on POPs, a global agreement aimed at reducing and eventually banning an initial list of the twelve “worst” compounds in 2001. Due to their specific properties such as resistance to degradation and lipophilicity, they are transported through food chains in aquatic and terrestrial environments, and hence they bioaccumulate/biomagnify[9-11]. Animal and human studies link various health problems to exposure to POPs. These include reproductive abnormalities, congenital disabilities, immune system dysfunction, neurological defects, and cancer. Research in recent years has focused on understanding their ambient sources[7-10], atmospheric transport[12-14], and fate[15-17].
Organochlorine pesticides (OCPs) are a group of POPs manufactured and used in agriculture and public health[18-21]. Despite the fact that the OCPs targeted in the current study are either banned or restricted under the SC, they are nevertheless present in ambient air around the world. Because these chemicals are transboundary pollutants that travel vast distances from places where they were produced/used to distant locations[4,14], environmental data from various parts of the world are needed to better understand the underlying processes that impact their global distribution[22-27]. Spatial mapping of POP concentrations at a local, regional, or global scale is extremely useful in identifying sources, localized “hot spots”, and understanding transport pathways/processes.
In the current study, polyurethane foam (PUF) disk passive samplers (PUF-PAS), which have become increasingly popular for monitoring organic contaminants in the environment[28-30], were used to investigate the geographical variability in concentrations and gain insights into the presence of local sources of OCPs. The key advantages of the passive air samplers (PAS) over active air sampling approaches are their simplicity and low cost, the fact that they do not require electricity or highly skilled workers to operate. Additionally, they may also be deployed in larger areas, particularly in remote areas. Passive samplers are particularly appealing as the sampler of choice in underdeveloped or developing countries, where environmental data on POPs are still limited.
The PASs used in this study are the same as those in the Global Atmospheric Passive Sampling (GAPS) network[31] (GAPS type) and were thoroughly examined and found to produce data that are compatible with data obtained from Hi-Vol air samplers in calibration and field investigations. Passive samplers have received broad acceptance within the POPs research community[32-34] . For example, a study to assess and characterize sampling efficiency as well as derive sampling rates for compounds in seven semi-volatile organic compounds (SVOC) classes, including OCPs[31], reported that PUF-PASs efficiently and reliably sampled OCPs. The sampler had a high detection frequency, sensitivity (detection was possible after two weeks in a typical semirural area), low limits of detection, high precision, strong fingerprinting performance, and rational sampling rates. Additionally, the compound-specific sampling rate, which is the case in the current study (see Section 3.1.), is highly recommended to significantly increase air concentration estimates’ precision. There is no doubt that passive sampling comes with larger uncertainties of atmospheric concentrations than active sampling for gaseous substances. However, in research aiming to measure an average concentration over a given period of time for the purpose of exposure assessment, time-weighted passive sampler results are more likely to be accurate compared to short-term grab active samples[35], as POPs concentrations in ambient air exhibit day-to-day variations depending on wind direction. Overall, based on the published work in the recent literature, it can be concluded that PUF-PAS samplers are useful for obtaining atmospheric SVOC levels on a spatial and temporal basis.
In 2021, SC released the 3rd Regional Monitoring Reports, which were prepared under the Global Monitoring Program (GMP), for Africa[36], Asia and Pacific[37], Central and Eastern European Region[38], and Western Europe and Others Group Region[39]. To the best of the authors’ knowledge, no data for the Middle East region have been reported under the GMP, so the current monitoring activity is an important step toward improving contributions to the GMP as well as addressing the Parties’ obligations to the SC and its effectiveness evaluation process, which heavily relies on the GMP. Moreover, until recently, there were scarce credible environmental data on the levels of most POP chemicals in the Middle East, much of Africa, and Asia, which might be used to evaluate the effectiveness of worldwide efforts to reduce POP chemicals released into the environment. Although some data exist on the levels of POPs in the abiotic media, there is no consistent ambient air POP monitoring in the subregion besides Kuwait, which has been a GAPS site since its inception[40].
A key objective of the current study was to initiate a passive air sampling network across the Middle East so that comparable data can be obtained, which will be useful in reporting obligations of the various countries and used in protocol discussions. As a result, this study’s major goal was to use passive samplers to obtain the first reliable concentrations of SC-included OCPs in the air in the Middle East, which may serve as a baseline for evaluating the effectiveness of future .international measures to reduce their levels. In the current study, the targeted OCPs were: hexachlorobenzene (HCB), pentachlorobenzene (PeCB), aldrin (ALD), dieldrin (DIELD), endrin (END), 4,4′-dichloro diphenyl trichloroethane (p,p’-DDT), 4,4′-dichloro diphenyl dichloroethylene (p,p’-DDE), 4,4′-dichloro diphenyl dichloroethane (p,p’-DDD), 2,4′-dichloro diphenyl trichloroethane (o,p’-DDT), 2,4′-dichloro diphenyl dichloroethylene (o,p’-DDE), 2,4′-dichloro diphenyl dichloroethane (o,p’-DDD), α-chlordane (TC), γ-chlordane (CC), trans-nanochlor (TN), cis-nanochlor (CN), oxychlordane (OXY), heptachlor (HEPT), trans-heptachlor epoxide (A isomer) (trans-HEPX), cis-heptachlor epoxide (B isomer) (cis-HEPX), α-hexachlorocyclohexane (α-HCH), β-hexachlorocyclohexane (β-HCH), γ-hexachlorocyclohexane (γ-HCH), δ-hexachlorocyclohexane (δ-HCH), β-endosulfan (β-ENDO), α-endosulfan (α-ENDO), isodrin (ISOD), and chlordecone. The spatial distribution of the OCPs investigated in the study was documented at various locations across the Middle East along a northwest-southeast transect that corresponds to the region’s primary prevailing wind direction.
EXPERIMENTAL
Sample collection
Flame retardant-free certified PUF disks were purchased from Tisch Environmental (OH, USA). The PUF disks were cleaned for 48 h using a combination of solvents in series (each solvent extraction over a 24 h period) depending on the target analytes [acetone-dichloromethane (“legacy” POPs); acetone-toluene (PCDD/Fs and dl-PCBs), and acetone-methanol (PFCs) analysis], in a giant Soxhlet (1.5 L, 46” Soxhlet apparatus; fritted top, 103/60; fritted bottom, 45/50; Ace Glass Incorporated, NJ, USA), with the solvent replaced after 24 h. To avoid contamination before deployment, the solvent-cleaned PUF disks were dried under vacuum in a clean desiccator and then kept in solvent-rinsed glass jars until deployment. We only report OCP concentrations detected in the samples in the current manuscript. Dome-shaped passive sampling devices (Tisch Environmental, OH, USA) were used in the current study[41]. Samplers were deployed at 2-2.5 m from the ground in unobstructed airflow.
The initial sampling plan was to deploy passive samplers in Bahrain, Oman, Qatar, United Arab Emirates, Kuwait, Lebanon, Yemen, Syria, Saudi Arabia, and Jordan. However, because of ongoing armed conflicts and other political tensions in the Middle East, samplers could not be deployed in some of these countries. As a result, samplers were deployed along a northwest-southeast transect across the Middle East at several sites representing various regional characteristics (agricultural, industrial, remote, urban, and background). Two sites were eventually established in Turkey [Uludag and Turkish Scientific Research Council Bursa Test and Analysis Laboratory (TÜBİTAK-BUTAL)], two in Oman (Al Rassil and Al Multaga), three in Lebanon [Campus of American University of Beirut (AUB), Ashrafiyeh, and Kartaba), five in Kuwait (Salmiya, Abdali, Ahmadi, Sulaibiya, and Shuwaikh)], and one in Saudi Arabia (Jeddah). Details on characteristics of the sampling locations are given in Supplementary Table 1. However, it was not possible to obtain data for all sites for all sampling campaigns due to political instability in the region and other logistical problems, as stated above.
A sampling kit comprising a passive sampling housing unit, four pre-cleaned PUF disks (adequate for the whole year sampling activity), collection jars, and gloves were dispatched in December 2017 to everyone who volunteered to participate in the study. The kit also included a standard operating procedure for deployment and retrieval of samplers, based on the protocol established by the GAPS Network run by Environment and Climate Change Canada. The samplers were retrieved every three months when possible. Details on the duration of sampler deployment in 2018 at each sampling site are given in Supplementary Table 1. After harvesting, the PUF disks were stored at -15 °C until couriered to the laboratory of the Stockholm Convention Sub-Regional Center for POPs in Kuwait (SCRC Kuwait) for analysis.
Extraction and clean-up
On an accelerated solvent extractor (ASE-350, Dionex, CA, USA) with 33 mL stainless-steel extraction cells, passive samples were extracted with hexane by employing the following extraction conditions: temperature, 100 °C; pressure, 1500 psi; static time, 5 min; and 1 extraction cycle. Prior to the extraction, a 13C-OCP surrogate mixture (Cambridge Isotope Laboratories, Tewksbury, MA, USA) containing all the compounds in the expanded POPs list, namely HCB, PeCB, ALD, DIELD, END, p,p’-DDT, p,p’-DDE, p,p’-DDD, o,p’-DDT, o,p’-DDE, o,p’-DDD, CC, TC, TN, CN, OXY, HEPT, trans-HEPX, cis-HEPX, mirex, chlordecone, α-HCH, β-HCH, γ-HCH and δ-HCH, β-ENDO, and α-ENDO, was spiked to the samples to monitor analytical recoveries. After extraction, the volume of the extracts was reduced to about 1 mL on a Turbovap® II workstation (Hopkinton, MA, USA) and solvent was exchanged to hexane. A column chromatography clean up (packed in a glass column (i.d. 9 mm) using 2 g of silica gel (Merck, 60-230 mesh, baked at 450 °C for 24 h and stored at 130 °C) and 1 g alumina [BDH, neutral alumina, baked at 450 °C for 24 h and stored at 130 °C) and capped with baked powdered anhydrous sodium sulfate (~0.5 cm)] was applied for further purification of the extracts. The samples with a final volume of 50 µL in isooctane were spiked with 20 ng isodrin as the internal standard.
Instrumental analysis
An Agilent 7890B gas chromatograph coupled to a triple quadrupole mass spectrometer was used for the instrumental analysis of targeted OCPs. The instrument was operated in electron ionization mode and the analytes were separated on a 30 m DB5-MS column (0.25 mm i.d., 0.25 µm film thickness, J&W Scientific). Helium was the carrier gas with a flow rate of 2.6 mL min-1, whereas nitrogen was the collision gas with a flow rate of 1.5 mL min-1. The following temperature program was applied: 70 °C for (2 min), 25 °C min-1 to 150 °C, 3 °C min-1 to 200 °C, and 8 °C min-1 to 280 °C (10 min). Injector port, ion source, quadruple, and transfer line were set to 280, 300, 150, and 310 °C, respectively. As the gas chromatograph was fitted with a backflush capability, a 5 min backflush was carried out at the end of each run; the oven temperature was maintained at 310 °C during backflush. The triple quadrupole was operated in MS/MS mode while targeted chemicals were detected and confirmed using two transitions per analyte multiple reaction monitoring (MRM). The MRM transitions of monitored OCPs are given in Supplementary Table 2. Data processing was carried out using Mass Hunter™ analysis software.
QA/QC
The analytical processes were monitored by strict quality assurance and quality control methods. Identification and quantification were carried out against five calibration levels with a concentration range from 5 to 100 pg.µL-1 in isooctane. A peak was positively confirmed if it was within 0.05 min of the calibration standard’s retention time and quantified if the signal to noise (S/N) ratio was ≤ 3, and the ion to its qualifier ion ratio was within 20% of the standard value. There was no significant difference between laboratory and field blanks, showing that contamination was minimal during shipment, storage, and analysis. The instrument detection limit (IDL) was the analyte concentration that produced a signal greater than three times the standard deviation (SD) of the noise level. When an analyte was detected in a laboratory blank that was processed together with a batch of samples, the average concentration of the blanks was subtracted from the concentration detected in the sample. The method detection limits (MDLs) were calculated as the average of the field blank+ 3 × SD. IDL = MDL in cases when the target analytes were not detected in the field blanks. To convert IDL and MDL values to pg·m-3, a final sample volume of 50 µL and an average air volume range between 77 and 429 m3 (average of corresponding air volumes calculated using the GAPs template[42], see section 1 for further information) for target compounds were used. IDL and MDL values in pg·m-3 are given in Supplementary Table 3.
The average recovery for surrogate compounds was found to be 85% ± 8% for the reported compounds in this study, and detailed recovery rates are given for individual labeled compounds in
The data in this study were not corrected for surrogate recovery. As there are no reference materials available for air, the analytical method’s accuracy and precision were evaluated using replicate analyses (n = 6) of a certified indoor dust reference material (SRM 2585).
The results of the current research are comparable to the certified values[40]. However, the concentrations of α-ENDO and kepone are not reported in this study, as further analytical method development is required to report these compounds with confidence.
Cancer risk assessment
United States Environmental Protection Agency (USEPA) guidelines were followed to calculate the inhalation cancer risk using the equations below[43-45].
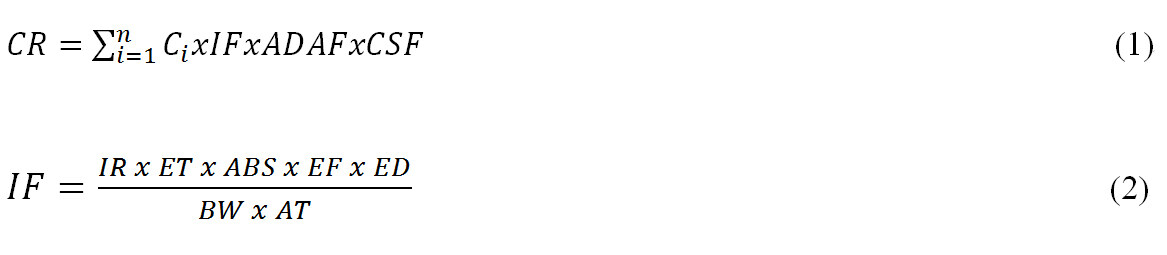
where CR is the cancer risk (unitless), Ci is the ambient air concentration of a specific pollutant (mg·m-3), IF is the intake factor (m3.kg-1·day-1) for children (0-15 years) and adults (15-70 years), ADAF is the respective age-dependent adjustment factor (unitless), CSF is the cancer slope factors for inhalation exposure of a specific pollutant (mg.kg-1·day-1)-1, IR is the inhalation rate (m3·day-1), and ET is the exposure time (h·day-1). In this study, the time spent outdoors was assumed to be 2.2 h for children (maximum value of the average time spent outdoors by age groups from 1 to 16 years reported by USEPA[44] and 4.97 h for adults (maximum value of average time spent outdoors by age groups from 16 to > 64 years reported by USEPA[44]). ABS is the absorption factor (unitless), EF is the exposure frequency (day·year-1), ED is the exposure duration (year), BW is the body weight (15 kg for children and 70 kg for adults), and AT is the average time (day). For the current study, CR was calculated for each sampling site for the OCPs whose slope factors are available [Supplementary Table 5]. Further details on the numeric values of parameters used in Equations (1) and (2) are given in Supplementary Table 6. To compare the exposure ratios calculated in the current study to exposure ratios observed in the previous studies, the exposure ratio to target chemicals via inhalation was re-calculated for OCPs reported in earlier studies using Equations (1) and (2) [Supplementary Table 7 and Supplementary Table 8].
RESULTS AND DISCUSSION
Introductory remarks
The compounds with KOA larger than 108.5 show a sampling rate, which is linear for the first 100 days[46]. As a result, a three-month deployment ensures that the sampler is in the kinetic phase, where uptake is nearly temperature independent[47,48]. It has been reported in studies conducted using PUF-PAS that these samplers collect not only gas-phase compounds but also particles[31,49], and research has shown that the sampling rates for both particle and gas-phase compounds are comparable[50,51]. Consequently, in the current study, it was assumed that PUF-PAS samplers’ performance was equal for gas- and particle-phase associated chemicals. To estimate the concentrations of target chemicals in ambient air, air temperature data for sampling sites were obtained from the National Oceanic and Atmospheric Administration [Available from: https://www.ncdc.noaa.gov/cdo-web/]; effective sampling volume (R, m3·day-1) was derived from the model which uses local weather data[52]. The average R-value ranged between 2.24 and 4.63 m3·day-1 for sampling sites. The model-derived R-value, along with sampling site-specific temperature data and total deployment time (days), were used in the Excel spreadsheet created for the GAPS Network to calculate the total sampled air volume for each of the target compounds[42]. Applying these sampling rates, the PUF disks sampled, depending on the chemical, a total air volume ranging from 77-429 m3 over the three-month deployment period. Air concentrations of the target chemicals were determined based on this chemical-specific total air volume value.
Atmospheric concentrations of OC pesticides
The following organochlorine pesticides were found at least in one sample across the Middle East: PeCB, HCB, HCHs, HEPT, ALD, cis-HEPX, TC, CC, TN, CN, and DDTs. The spatial variations in the ambient levels of the organochlorine pesticides analyzed in the samples collected across the five Middle Eastern countries are summarized in Figure 1, detailed concentration data are given in Table 1, and the compound-specific concentrations in the samples are presented as a box plot in Figure 2.

Figure 1. Concentrations of ∑OCPs air samples from five middle eastern countries between January and October 2018. OCPs: Organochlorine pesticides.

Figure 2. Box plot of OCP concentrations (pg·m-3) in air samples from five Middle Eastern countries between January and October 2018. The 75th and 25th percentiles of the dataset are represented by the top and bottom ends of the box, respectively. The 99th and 1st percentiles are indicated by the extensions (“whiskers”) at either end of the box. The red dots represent outliers, which are individual data that exceed 1.5 times the interquartile range. The median concentrations in the boxes are indicated by the horizontal line. OCP: Organochlorine pesticide.
Congener-specific organochlorine pesticide concentrations (pg·m-3) in air samples from five middle eastern countries between January and October 2018
| Country | Site characteristic | Sampling period | PeCB | HCB | α-HCH | β-HCH | γ-HCH | δ-HCH | HEPT | ALD | DIELD | END | HEPX-A | HEPX-B | TC | CC | TN | CN | OXY | ENDO-I | o,p’-DDT | o,p’-DDD | o,p’-DDE | p,p’-DDT | p,p’-DDD | p,p’-DDE | ∑OCPs |
| OMAN | |||||||||||||||||||||||||||
| Al Rassil | Industrial | March-June | 1.34 | 2.53 | 0.197 | < IDL | < IDL | 0.138 | < MDL | < IDL | < IDL | < IDL | < IDL | 1.61 | 1.79 | 1.02 | 0.210 | < IDL | < IDL | < IDL | < IDL | < IDL | 1.88 | 4.35 | 5.21 | 20.4 | |
| Al Rassil | June-Sept | 1.94 | 5.21 | 17.8 | < IDL | 11.43 | 1.01 | 0.44 | 14.6 | < IDL | < IDL | < IDL | < IDL | 5.65 | 5.47 | 3.18 | 0.659 | < IDL | < IDL | 21.1 | 9.29 | 1.35 | 42.9 | 12.7 | 14.3 | 169 | |
| Al Multaga | Urban | March-June | 3.04 | 5.55 | 0.380 | < IDL | 0.242 | < MDL | < MDL | < IDL | < IDL | < IDL | < IDL | < IDL | < IDL | 0.540 | < IDL | < IDL | < IDL | < IDL | < IDL | < IDL | < IDL | < IDL | 0.901 | 1.99 | 12.8 |
| Al Multaga | June-Sept | 1.76 | 4.05 | 0.956 | < IDL | 0.869 | 1.14 | < MDL | 0.864 | < IDL | < IDL | < IDL | < IDL | 0.767 | < IDL | 0.595 | < IDL | < IDL | < IDL | 0.732 | 0.725 | < MDL | 1.84 | 2.03 | 1.29 | 17.8 | |
| LEBANON | |||||||||||||||||||||||||||
| AUB | Urban | Feb-Apr | 2.79 | 13.2 | 1.05 | 0.437 | 5.82 | < IDL | 1.12 | < IDL | < IDL | < IDL | < IDL | < MDL | 2.92 | 1.75 | 0.364 | 0.501 | < IDL | < IDL | < IDL | 2.41 | 1.13 | 11.3 | 23.0 | 16.1 | 84.0 |
| AUB | Apr-June | 1.32 | 7.32 | 1.46 | < IDL | 4.84 | 0.338 | 0.85 | < IDL | < IDL | < IDL | < IDL | < IDL | 3.48 | 1.71 | 1.23 | < IDL | < IDL | < IDL | 6.30 | 1.46 | 1.68 | 20.3 | 4.55 | 22.0 | 78.9 | |
| AUB | July-Oct | 0.612 | 3.64 | 1.23 | 0.305 | 3.81 | < IDL | 0.67 | < IDL | < IDL | < IDL | < IDL | < IDL | 3.03 | 1.74 | 1.43 | 0.415 | < IDL | < IDL | 7.42 | 3.97 | 1.49 | 31.6 | 8.12 | 21.1 | 90.6 | |
| Ashrafiyeh | Urban | Feb-Apr | 4.79 | 21.1 | 5.92 | < IDL | 41.5 | 0.668 | 2.71 | < IDL | < IDL | < IDL | < IDL | < IDL | 7.26 | 3.75 | 3.00 | 0.703 | < IDL | < IDL | 71.0 | 31.1 | 5.72 | 166 | 42.2 | 81.6 | 489 |
| Ashrafiyeh | Apr-June | 1.34 | 7.50 | 9.68 | < IDL | 90.1 | < IDL | 3.56 | < IDL | < IDL | < IDL | < IDL | < IDL | 13.7 | 8.70 | 4.23 | 1.13 | < IDL | < IDL | 184 | 122 | 13.2 | 772 | 240 | 214 | 1690 | |
| Ashrafiyeh | July-Oct | 1.08 | 5.28 | 4.57 | 4.03 | 39.9 | < IDL | 1.81 | < IDL | < IDL | < IDL | < IDL | < IDL | 12.6 | 9.27 | 5.09 | 1.99 | < IDL | < IDL | 164 | 117 | 11.7 | 755 | 233 | 213 | 1580 | |
| Kartaba | Agricultural | July-Oct | 2.60 | 15.8 | 1153 | < IDL | 684 | 27.8 | 13.52 | 9.22 | < IDL | < IDL | < IDL | < IDL | 11.8 | 5.78 | 2.59 | 0.866 | < IDL | < IDL | 1213 | 566 | 77.8 | 2440 | 794 | 764 | 7780 |
| SAUDI ARABIA | |||||||||||||||||||||||||||
| Jeddah | Urban | April-June | 1.26 | 3.73 | 1.34 | 0.447 | 2.10 | 1.64 | < MDL | < IDL | < IDL | < IDL | < IDL | < IDL | 0.129 | < IDL | < IDL | < IDL | < IDL | < IDL | < IDL | < IDL | 0.329 | 0.800 | 3.11 | 1.87 | 16.8 |
| Jeddah | July-Oct | 1.07 | 6.52 | 1.72 | < IDL | 1.71 | 0.903 | < MDL | < IDL | < IDL | < IDL | < IDL | < IDL | 0.250 | < IDL | < IDL | < IDL | < IDL | < IDL | < IDL | 0.568 | 0.641 | 0.926 | 3.32 | 3.73 | 21.4 | |
| TURKEY | |||||||||||||||||||||||||||
| BUTAL | Urban | Jan-Apr | 2.70 | 10.6 | 2.08 | < IDL | 1.71 | 0.110 | < IDL | < IDL | < IDL | < IDL | < IDL | < IDL | 0.292 | < IDL | 0.244 | < IDL | < IDL | < IDL | < IDL | 3.03 | 0.600 | 6.22 | 38.1 | 9.46 | 75.2 |
| BUTAL | Apr-June | 1.19 | 8.16 | 5.84 | 1.10 | 4.63 | < MDL | 0.10 | < IDL | < IDL | < IDL | < IDL | < IDL | < IDL | 0.290 | 0.185 | < IDL | < IDL | < IDL | 2.45 | 1.12 | 9.34 | 15.7 | 23.5 | 73.7 | ||
| BUTAL | July-Oct | 4.39 | 13.0 | 7.89 | 3.07 | 6.11 | < IDL | 0.13 | < IDL | < IDL | < IDL | < IDL | < IDL | 0.384 | 0.474 | 0.313 | < IDL | | < IDL | 6.98 | < IDL | 1.45 | 13.8 | 4.51 | 29.5 | 92.1 | | |
| BUTAL | Oct-Nov | 1.30 | 1.30 | 0.730 | < IDL | 0.40 | < IDL | < IDL | < IDL | < IDL | < IDL | < IDL | < IDL | 0.535 | | < IDL | < IDL | < IDL | < IDL | < IDL | 2.28 | 0.733 | 7.27 | | ||||
| Uludag | Background | Jan-Apr | 3.03 | 18.0 | 13.6 | < IDL | 3.83 | < MDL | 0.13 | < IDL | < IDL | < IDL | < IDL | < IDL | 0.402 | < IDL | < IDL | < IDL | < IDL | < IDL | 2.42 | < IDL | 0.668 | 4.87 | 2.00 | 9.70 | 58.8 |
| Uludag | Apr-June | 2.17 | 11.6 | 28.3 | < IDL | 9.64 | 0.523 | < IDL | < IDL | < IDL | < IDL | < IDL | < IDL | < IDL | 1.05 | < IDL | < IDL | < IDL | < IDL | 12.2 | 1.26 | 1.49 | 21.9 | 4.15 | 28.4 | 123 | |
| Uludag | July-Oct | 4.80 | 24.7 | 45.8 | 4.58 | 16.7 | < IDL | 0.22 | < IDL | < IDL | < IDL | < IDL | < IDL | 0.499 | < IDL | < IDL | < IDL | < IDL | < IDL | 11.6 | < IDL | 1.91 | 23.8 | 6.95 | 34.8 | 176 | |
| Uludag | Oct-Nov | 1.91 | 1.81 | 0.571 | < IDL | < IDL | < IDL | < IDL | < IDL | < IDL | < IDL | < IDL | < IDL | < IDL | < IDL | < IDL | 0.849 | < IDL | < IDL | < IDL | < IDL | < IDL | 3.23 | 14.2 | 1.27 | 23.8 | |
| KUWAIT | |||||||||||||||||||||||||||
| Abdali | Remote/ Agricultural | Jan-Apr | 12.8 | 32.6 | 1.07 | < IDL | 0.701 | 0.615 | < IDL | < IDL | < IDL | < IDL | < IDL | < IDL | 0.774 | 1.77 | 0.944 | 0.183 | < IDL | < IDL | 0.981 | < IDL | 1.04 | 1.25 | 0.141 | 6.35 | 61.2 |
| Abdali | Apr-June | 3.75 | 10.2 | 0.676 | 0.108 | 0.566 | 0.391 | < IDL | < IDL | < IDL | < IDL | < IDL | < IDL | 0.862 | < IDL | 0.889 | 0.197 | < IDL | < IDL | < IDL | < IDL | 0.865 | 1.17 | 0.137 | 5.55 | 25.4 | |
| Abdali | June-Sept | 1.53 | 3.47 | 0.393 | 0.212 | 0.355 | 1.18 | < IDL | < IDL | < IDL | < IDL | < IDL | < IDL | 0.537 | 0.992 | 0.626 | < IDL | < IDL | < IDL | 0.693 | < IDL | 0.444 | 1.41 | 0.168 | 3.39 | 15.4 | |
| Abdali | Sept-Dec | 2.18 | 3.60 | 0.352 | 0.092 | 0.472 | 1.43 | < IDL | < IDL | < IDL | < IDL | < IDL | < IDL | 0.465 | 0.582 | 0.497 | < IDL | < IDL | < IDL | 0.666 | < IDL | 0.352 | 1.77 | 0.294 | 2.43 | 15.2 | |
| Salmiya | Urban | Jan-Apr | 9.53 | 21.8 | 0.751 | 0.455 | 0.725 | 0.628 | < IDL | < IDL | < IDL | < IDL | < IDL | < IDL | 0.621 | 1.02 | < IDL | < MDL | < IDL | < IDL | 1.00 | < IDL | 0.956 | 1.65 | 0.255 | 6.89 | 46.3 |
| Salmiya | Apr-June | < MDL | < IDL | < IDL | < IDL | < IDL | < IDL | < IDL | < IDL | < IDL | < IDL | < IDL | 27.9 | < IDL | < IDL | < IDL | < IDL | < IDL | < IDL | < IDL | < IDL | < IDL | < IDL | < IDL | 2.43 | 30.3 | |
| Salmiya | June-Sept | 1.61 | 4.13 | 0.526 | 0.213 | 0.565 | 0.475 | < IDL | < IDL | < IDL | < IDL | < IDL | < IDL | 0.801 | 0.970 | 0.677 | < IDL | < IDL | < IDL | 1.32 | < IDL | 1.23 | 2.57 | 0.304 | 9.63 | 25.0 | |
| Salmiya | Sept-Dec | 1.86 | 7.13 | 0.461 | 0.103 | 0.774 | 1.62 | < IDL | < IDL | < IDL | < IDL | < IDL | < IDL | 0.684 | 1.14 | 0.749 | < IDL | < IDL | < IDL | 1.09 | < IDL | 0.482 | 2.33 | 0.326 | 4.24 | 23.0 | |
| Ahmadi | Industrial | Jan-Apr | 14.7 | 34.6 | 1.45 | 1.11 | 1.58 | 1.08 | < IDL | < IDL | < IDL | < IDL | < IDL | < IDL | 1.83 | < IDL | 1.04 | < IDL | < IDL | < IDL | < IDL | < IDL | 1.37 | 2.51 | 2.34 | 12.3 | 75.9 |
| Ahmadi | Apr-June | 5.55 | 15.1 | 0.721 | < IDL | 1.12 | 0.376 | < IDL | < IDL | < IDL | < IDL | < IDL | < IDL | 1.14 | 1.72 | 0.899 | < IDL | < IDL | < IDL | < IDL | < IDL | 1.08 | 2.61 | 1.23 | 9.02 | 40.6 | |
| Ahmadi | June-Sept | 1.95 | 5.15 | 0.269 | < IDL | 0.471 | 0.345 | < IDL | < IDL | < IDL | < IDL | < IDL | < IDL | 0.832 | 1.50 | 0.235 | < IDL | < IDL | < IDL | < IDL | < IDL | 0.534 | 1.39 | 0.162 | 5.00 | 17.8 | |
| Ahmadi | Sept-Dec | 2.76 | 7.65 | 0.378 | 0.535 | 0.944 | 1.28 | < IDL | < IDL | < IDL | < IDL | < IDL | < IDL | 1.42 | 2.16 | 0.859 | < IDL | < IDL | < IDL | 1.08 | < IDL | 0.520 | 2.02 | 0.310 | 4.75 | 26.7 | |
| Sulaibiya | Urban | Jan-Apr | 15.8 | 37.3 | 2.49 | 0.516 | 2.21 | 0.320 | < IDL | < IDL | < IDL | < IDL | < IDL | < IDL | 0.755 | 0.917 | 0.681 | 0.379 | < IDL | < IDL | 0.824 | < IDL | 0.969 | 1.05 | 0.434 | 7.48 | 72.1 |
| Sulaibiya | Apr-June | 4.69 | 11.4 | 1.08 | 0.478 | 4.53 | 0.445 | < IDL | < IDL | < IDL | < IDL | < IDL | < IDL | 1.37 | 1.74 | 1.60 | 0.193 | < IDL | < IDL | 1.80 | < IDL | 0.931 | 3.31 | 0.377 | 7.19 | 41.2 | |
| Sulaibiya | June-Sept | 3.63 | 12.4 | 0.607 | 0.282 | 0.840 | 0.349 | < IDL | < IDL | < IDL | < IDL | < IDL | < IDL | 1.45 | 1.95 | < IDL | < IDL | < IDL | < IDL | 0.836 | < IDL | 0.584 | 1.98 | 0.301 | 4.86 | 30.0 | |
| Sulaibiya | Sept-Dec | 2.28 | 5.02 | 0.308 | 0.509 | 0.598 | 1.33 | < IDL | < IDL | < IDL | < IDL | < IDL | < IDL | 1.09 | 2.10 | 0.875 | < MDL | < IDL | < IDL | 0.521 | < IDL | 0.296 | 2.02 | 0.196 | 3.19 | 20.4 | |
| Shuwaikh | Urban | Jan-Apr | 26.8 | 65.2 | 2.86 | 0.547 | 4.54 | 0.864 | < IDL | < IDL | < IDL | < IDL | < IDL | 0.136 | 2.12 | 3.34 | < IDL | < IDL | < IDL | < IDL | < IDL | < IDL | 2.08 | 3.33 | 0.454 | 16.7 | 129 |
| Shuwaikh | Apr-June | 8.66 | 22.7 | 1.41 | < IDL | 3.29 | 0.549 | < IDL | < IDL | < IDL | < IDL | < IDL | < IDL | 1.92 | < IDL | 1.22 | 0.269 | < IDL | < IDL | 1.86 | < IDL | 1.60 | 4.31 | 0.477 | 12.6 | 60.9 | |
In general, the length of the whiskers and the size of the box are indicators of the variability in concentrations at a specific site for a certain chemical. A small box indicates that the distribution is consistent throughout the sampling period, and vice versa. The ∑24OCP concentrations were highest in the samples collected from Kartaba in Lebanon (7780 pg·m-3) (July-October 2018 sampling campaign), and the lowest concentration was recorded at BUTAL site in Bursa province of Turkey (7.27 pg·m-3). The mean (range; median) ambient ∑24OCP concentrations on a country-specific basis over consecutive sampling campaigns at multiple sites were: Lebanon at 1684 (78.9-7781; 490) pg·m-3 > Turkey at 78.7 (7.27-176; 74.5) pg·m-3 > Oman at 55 (12.8-169; 19.1) pg·m-3 > Kuwait at 42 (15.2-129; 30.2) pg·m-3 > Saudi Arabia at 19.1 (16.8-21.4; 19.1) pg·m-3. p,p’-DDE was the most frequently detected compound with a detection frequency (DF) of 100% followed by PeCB, HCB, α-HCH, and p,p’-DDD (DF = 97.4%); γ-HCH and p,p’-DDT (DF = 92.3%); o,p’-DDE (DF = 87.2%); TC (DF = 84.6%); δ-HCH (DF = 76.9%); TN (DF = 69.2%); CC (DF = 66.7%); o,p’-DDT (DF = 61.5%); and β-HCH (DF = 51.3%). The following compounds showed DF values lower than 50%: CN, HEP, o,p’-DDD, ALD, and cis-HEPX (DF = 462.%, 43.6%, 33.3%, 7.7%, and 7.7%, respectively). trans-HEPX, OXY, β-ENDO, END, and DIELD were not detected in any of the samples [Table 1].
Figure 3 compares the Kuwait and Turkish datasets as one-year data are available at all of these sites. In Kuwait, p,p’-DDE showed a DF of 100%. PeCB, HCB, α-HCH, γ-HCH, δ-HCH, TC, o,p’-DDE, p,p’-DDE, and p,p’-DDD showed a DF value of 94%, while the DF values for β-HCH and o,p’-DDT were 75% and 68.8%, respectively. CN and cis-HEPX showed detection values lower than 50% (38% and 6%, respectively), while HEPT, ALD, END, DIELD, trans-HEPX, OXY, β-ENDO, and o,p’-DDD were not present. In Turkish samples, HCB, PeCB, α-HCH, p,p’-DDD, and p,p’-DDE were detected in all samples (DF = 100%). The following compounds were detected above 50%: γ-HCH and p,p’-DDT (DF = 88%), as well as δ-HCH, HEPT, TC, and o,p’-DDT (DF = 50%). The DF for β-HCH, TN, CN, and o,p’-DDD was 38%, while CC showed a DF value of 25%. ALD, DIELD, END, trans-HEPX, and -B, OXY, and β-ENDO were not detected. Due to the absence of reliable ambient OC pesticide concentrations in the Middle East, the results of this study are placed in the context of data generated by the GAPS Network, studies in Turkey and Kuwait, and other passive sampling studies worldwide.

Figure 3. Box plot of OCP concentrations (pg·m-3) in air samples from Kuwait and Turkey between January and December 2018. The 75th and 25th percentiles of the dataset are represented by the top and bottom ends of the box, respectively. The 99th and 1st percentiles are indicated by the extensions (“whiskers”) at either end of the box. The horizontal line displays the median concentrations in the boxes. OCP: Organochlorine pesticide.
Spatial variability in concentrations of selected pesticides
Hexachlocyclohexanes (α-, β-, γ-, and δ-HCH)
Air concentrations of α-HCH ranged from 0.2 (Al-Rassil, Oman, March-June 2018) to 45.8 pg·m-3 (Uludag, Bursa, Turkey, July-October 2018), except at the agricultural site in Kartaba, Lebanon with a concentration of 1150 pg·m-3 during the July-October 2018 sampling campaign. The concentrations of individual isomers and ∑HCHs are presented as a box and whiskers plot in Figure 4A, with site-specific concentrations given in Table 1. The concentrations of α- and γ-HCH reported at most sites in this study are similar to those reported across Europe (1.7-17 and 1.1-65.0 pg·m-3, respectively)[53] and at the vast majority of the GAPS sites across the globe (0.10-1700 and 0.0-5000 pg·m-3, respectively)[34]. Kurt-Karakus et al.[54] reported average ∑HCH (sum of α, β, γ, and δ isomers) concentration on a countrywide basis in Turkey determined by PUF passive samplers in 2014-2015 to be 64.4 pg·m-3, which is higher compared to the average ∑HCHs (sum of α, β, γ, and δ isomers) concentration detected in the current study (19.7 ± 22.8 pg·m-3). However, site sampling conducted by Kurt-Karakus et al.[54] included some provinces with intensive agricultural activity, and no site in the Bursa province was included in the survey. A high volume air sampling campaign at three locations in Kuwait reported average concentrations for the α, β, γ, and δ isomers of 4.6-15.4, 0.80-16.2, 3.0-31.5, 0.30-4.1 pg·m-3, respectively[40]. In the current study, the average concentration of α-, β-, γ-, and δ-HCHs were 4.5, 0.96, 26.50, and 1.59 pg·m-3, respectively, which were similar to those reported by Gevao et al.[40].

Figure 4. Box plot of HCHs (A) and DDTs (B) in air samples from five middle eastern countries between January and October 2018. The 75th and 25th percentiles of the dataset are represented by the top and bottom ends of the box, respectively. The 99th and 1st percentiles are indicated by the extensions (“whiskers”) at either end of the box. The red dots represent outliers, which are individual data that exceed 1.5 times the interquartile range. The median concentrations in the boxes are indicated by the horizontal line. HCH: Hexachlorocyclohexane; DDT: dichloro diphenyl trichloroethane.
The elevated concentrations of α-HCH (1460 pg·m-3) and γ-HCH (868 pg·m-3) at the Kartaba site in Lebanon are similar to those reported at agricultural sites in Patna and Delhi in India (58.0-1400and 52.0-4500 pg·m-3, respectively)[55]. The air concentrations of γ-HCH in this study ranged from 0.24 (Al Multaga, Oman (March-June 2018)) to 41.5 pg·m-3 (Ashrafiyeh, Lebanon (February-April 2018)) at all sites in the region except for the Ashrafiyeh (90.1 pg·m-3, April-July 2018) and Kartaba (685 pg·m-3, July-October 2018) sites in Lebanon. Similar concentrations of γ-HCH were also reported across Europe[53] and at the vast majority of the GAPS sites across the globe[34].
Lindane and technical HCH have long been used to control insects in fruits and vegetables, as well as for seed treatment, vector control[56,57], and healthcare programs (for the treatment of head lice and scabies). Technical mixtures vary in composition depending on the manufacturer, but often contain 60%-70% α-HCH, 5%-12% β-HCH, 10%-12% γ-HCH, 6%-10% δ-HCH, and 3%-4% ε-HCH[58]. Technical HCH was replaced with lindane, which contains 99% of the γ isomer, which is the only isomer with insecticidal activity, as well as traces of the other isomers[56,59]. The ratio between the two most abundant isomers (α/γ) is usually used to determine the source of HCHs at a particular site. In the technical mixture, the α/γ ratio is reported to range from 4-7[60]. In this study, country-specific α/γ ratio values (average ± std; range; median) were as follows: Oman (1.41 ± 0.27, 1.1-1.57, 1.6), Lebanon (0.2 ± 0.09; 0.11-0.32; 0.16), Turkey (2.12 ± 0.95; 1.21-3.55;1.81), Kuwait (0.80 ± 0.30; 0.20-1.50; 0.70), and Saudi Arabia (0.82 ± 0.26; 0.64-1.01; 0.82). The α/γ ratio ranged between 0.1 and 3.55 for the whole dataset. Ratios of 4-7 might indicate that atmospheric concentrations of HCHs were affected by the usage of technical HCH; however, as the case in the current research, < 4 might indicate that levels of HCHs in the atmosphere were under the mixed influence of lindane and technical HCH applications[61]. Kartaba showed the highest γ-HCH concentration (685 pg·m-3), but the α/γ ratio at the Kartaba site could not be determined due to the lack of α-HCH data for this site. Therefore, the high concentrations of γ-HCH can only be suggestive of current/recent use of lindane as well as volatilization from stockpiles[62].
Dichlorodiphenyltrichloroethane (DDT)
DDT was used as an insecticide for malaria vector control around the globe[63]. In this study, the highest concentrations of ∑DDTs (p,p’-DDT+ o,p’-DDT+ p,p’-DDE + o,p’-DDE + p,p’-DDD + o,p’-DDD) in ambient air were recorded at sites in Lebanon, mainly the agricultural area of Kartaba (5850 pg·m-3), whereas the lowest air concentrations of ∑DDTs were at Salmiya in Kuwait (2.43 pg·m-3), Al-Multaga (2.89 pg·m-3) in Oman, and BUTAL (Bursa) (3.01 pg·m-3) in Turkey. The individual isomers and ∑DDTs dataset are presented as a box and whiskers plot in Figure 4B with site-specific concentrations given in Table 1. Except for the sites in Lebanon (5850 pg·m-3 in Kartaba (July-October) and 1490 pg·m-3 (July-October), 1550 pg·m-3 (April-July), and 398 pg·m-3 (February-April) in Ashrafiyeh), the DDT concentrations are within the same range as those reported by Bogdal et al.[32] using an identical passive sampler and those reported at non-agricultural sites of the GAPS Network[34,48] and in European background air[64]. ∑DDT average concentrations were reported to be in the range of 11.7-686 pg·m-3 in rural and urban sites of Turkey[54]. In the current study, samples collected from Turkey showed ∑DDT concentrations of 3-80 pg·m-3, which was lower than that reported in the Turkish survey[54]. As was the case with the HCHs, the levels of DDTs at the Kartaba and Ashrafiyeh sites (398-5850 pg·m-3) in Lebanon are similar to those reported in the agricultural areas around the globe[32,34,48,55]. The high concentrations of DDTs found at these two sites suggest a fresh use of DDT in the area. However, this may be due to volatilization from an old storage site of DDT in the vicinity of the sampling site or inappropriate dumping of DDT products since there is no reliable information on the current use of this pesticide for public health or agricultural reasons[65].
The DDT pattern was similar at most of the sites across the Middle East in this study, except for the composition at the sites in Lebanon. The average contribution of parent compounds p,p’-DDT and o,p’-DDT were 22.2% and 17.7%, respectively, while metabolites p,p’-DDE and p,p’-DDD contributed about 50% and 18%, respectively. In Lebanon, the contributions of the total ∑DDT concentration were as follows: p,p’-DDT (45.4%) > p,p’-DDE (18.1%) > o,p’-DDT (14.3%) > p,p’-DDD (13.3%) > o,p’-DDE (7.3%) > o,p’-DDE (1.3%). The ratio of o,p’-DDT/p, p’-DDT is usually used to determine whether the source of DDT is from dicofol use[66]. The o,p’-DDT/p,p’-DDT ratio of 0.15-0.26 represents the usage of commercial DDT, while a ratio close to 7.5 specifies the use of dicofol. In technical DDT (a mixture of about 85% p,p’-DDT and 15% o,p’-DDT), the o,p’-DDT/p,p’-DDT ratio corresponds to 0.18, while it ranges 0.01-2.1 (median = 0.20)[66] for various commercial dicofol formulations. In this study, the o,p’-DDT/p,p’-DDT ranged between 0.22 (Ashrafiyeh, Lebanon) and 0.79 (Abdali, Kuwait) at all sites, indicating that the source of DDT across the Middle East is from past or current use of DDT, probably in vector control. In the environment, technical DDT is converted into the corresponding DDE isomers.
The relative abundance of parent and metabolite is frequently used to distinguish aged contaminants (p,p’-DDE/p,p’-DDT > 1) from fresh (p,p’-DDE/p,p’-DDT < 1) material. In this study, the p,p’-DDE/p,p’-DDT ratio was greater than 1 at most sites (72% of the analyzed samples), suggesting that, at most sites, the sources of DDT in the ambient air were from past usage, i.e., re-volatilization of aged DDT from source areas. However, the p,p’-DDE/p,p’-DDT ratio in Al-Rassil (June-September; 0.33) and Al-Multaga (June-September; 070) in Oman; AUB (July-October; 0.67), Ashrafiyeh (in all sampling seasons; 0.28-0.49), and Kartaba (July-October; 0.31) in Lebanon; and Uludag (Bursa) (October-November; 0.39) in Turkey were < 1, suggesting that there is fresh DDT usage within the vicinity of the sampling locations in these locations.
PeCB and HCB
The concentrations of HCB were 1.6-6.8 times higher than those of PeCB at all sites in this study. The ambient concentrations of PeCB ranged 0.61-26.0 pg·m-3, while HCB concentrations ranged 1.3-65.0 pg·m-3. PeCB levels found in this study are comparable to those found in a global passive sampling survey[67] and in North America[68].
Among the POPs included in the Stockholm Convention, PeCB is the most volatile and is listed under Annex A and Annex C by decision SC4/16[69]. Due to its volatility, emissions from past applications, and long atmospheric residence time, PeCB is expected to be uniformly distributed across the global environment[67,70]. It is unknown if it was meant for commercial use, although it is created as a byproduct of a range of industrial operations, as well as during the combustion of solid waste and biomass[70].
The concentrations of HCB were much higher and ranged between 1.3 and 65.2 pg·m-3 at all sites in this study. HCB concentration ranged 2.53-5.55 pg·m-3 (4.34 ± 1.37 pg·m-3) in Oman, 3.6-21.1 pg·m-3 (10.5 ± 6.3 pg·m-3) in Lebanon, 3.73-6.5 pg·m-3 (5.12 ± 1.97 pg·m-3) in Saudi Arabia, 1.30-24.7 pg·m-3 (11.2 ± 7.83 pg·m-3) in Turkey, and 3.5-65.2 pg·m-3 (17.6 ± 16.6 pg·m-3) in Kuwait. Slightly higher concentrations were measured in Lebanon, Turkey, and Kuwait, where concentrations varied widely, ranging 3.5-65.2 pg·m-3. Due to its physicochemical properties, such as atmospheric lifetime and vapor pressure[69], HCB can be subject to much longer atmospheric transport distances than other organochlorine pesticides. High HCB concentrations in Lebanon, Turkey, and Kuwait could be due to long-range transport rather than pesticide use. A previous study conducted at the VKK site in the Arctic reported an atmospheric HCB level of 140-534 pg·m-3[61]. Average concentrations of HCB are similar to those reported for Turkey (45.3 pg·m-3)[54], European background air[64], and in a global atmospheric pesticide survey[57]. The occurrence of HCB in the environment is linked to its application as a seed fungicide, as a wood preserver, and in a range of manufacturing processes, such as dye production[71]. HCB can also be formed as an impurity in the manufacture of chlorinated solvents and pesticides, as well as during solid waste combustion and biomass burning[72].
Other OCPs
OXY, β-ENDO, END, and DIELD were not detected in any samples. In the current study, aldrin was detected only in three samples collected from Al Rassil (June-September) and Al Multaga (June-September) in Oman and Kartaba (July-October) in Lebanon with a concentration range of 0.86-14.6 pg·m-3.
Heptachlor was detected in samples from Oman, Lebanon, Saudi Arabia, and Turkey with a concentration ranging from 0.02-13.5 pg·m-3, but none of the Kuwait samples contained heptachlor. Trans-HEPX was not detected in any of the samples, while cis-HEPX was present in only three samples collected from AUB in Lebanon (February-April, 0.076 pg·m-3) and Salmiya (April-June, 27.9 pg·m-3) and Shuwaikh (January-April, 0.136 pg·m-3) in Kuwait. The concentrations of ∑Heptachlor, the sum of HEPT+ trans-HEPX, and cis-HEPX ranged from 0.02-28 pg·m-3 with an average value of 3.32 ± 7.36 pg·m-3, which was slightly lower compared to the average ∑Heptachlor reported (24.3 ± 159 pg·m-3) for nationwide passive sampling campaign in Turkey[54] and reported for Konya, Turkey (120 pg·m-3)[73] but similar to values reported for Nuuk-West, Greenland (0.33-2.74 pg·m-3)[74] and Korea (1.28 pg·m-3)[75]. Chlordanes are components of technical chlordane and were largely used as an agricultural pesticide on corn and citrus and as termite control for constructing foundations and dams[76]. Technical chlordane is a combination of 140 compounds, but the most abundant ones are trans-chlordane (TC; 13%), cis-chlordane (CC; 11%), trans-nonachlor (TN; 5%), and heptachlor (5%), with over 30 less abundant chlordanes, chlordenes, and nonachlors[77-81]. Because of their physicochemical properties, such as stability, volatility, Henry’s Law constant, octanol-water partition coefficient, and octanol-air partition coefficient, chlordanes are prevalent in the environment. The atmospheric presence of chlordanes is mainly due to volatilization from areas where chlordanes were applied, resuspension of residues from chlordane-containing soils[82], and air-water gas exchange[83]. Transboundary transport from regions where chlordanes may still be used, volatilization of chlordanes from wastes containing chlordane residues, and/or fugitive emissions from old, unused stockpiles could also be the sources of chlordanes.
In the present study, OXY was not found in any of the samples. Σ-Chlordane concentration (sum of four species: TC, CC, TN, and CN) measured in the air of five Middle East countries averaged 5.1 ± 7.1 pg·m-3 and ranged from 0.13 to 29.0 pg·m-3. The average value detected in the current study was similar to the average concentration of Σ-Chlordanes reported in Seoul, Korea (4.20 pg·m-3)[84], across Korea
Comparison of background/rural sites OCPs levels to the literature
As POP levels in urban or industrial sites might be affected by different factors/sources, comparison and site-specific discussions on the levels of OCPs detected in the current study are carried out for the background/rural characteristic sites, namely Uludag (Turkey) and Abdali (Kuwait). The levels of OCPs detected at these two sites are compared to concentrations of OCPs reported in studies conducted in Europe [Supplementary Table 9] and in other parts of the world [Supplementary Table 10].
Data on spatial and temporal trends of POPs obtained under the Global Monitoring Plan of Stockholm Convention are accessible in a database[90]. Figure 5 compares ambient air maximum concentrations detected in Middle Eastern countries investigated in the current study to the ambient air maximum concentrations detected under the GAPS study reported by Pozo et al. (2009)[34]. As shown in Figure 5, the concentrations of targeted OCPs in the current study are generally at the lower end or the middle level of concentrations reported in the GAPS study.

Figure 5. Comparison of ambient air maximum concentrations detected in Middle Eastern countries investigated in the current study to the ambient air maximum concentrations detected under the GAPS study reported by Pozo et al. (2009)[34]. GAPS: Global Atmospheric Passive Sampling.
Based on the information provided in this database and data from the second regional monitoring report for Central and Eastern Europe published in 2014[91], concentration (pg·m-3) ranges (minimum-maximum; time period) of targeted chemicals at EMEP station in Kosetice (Czech Republic) were as follows: aldrin (0.026-0.487; 2009-2013), TC (0.125-0.553; 2005-2013), CC (0.245-2.25; 2005-2013), OXY (0.019-0.888; 2005-2013), TN (0.058-1.3; 2005-2013), dieldrin (0.891-23.78; 2005-2013), endrin (0.018-1.69; 2005-2013), heptachlor (0.042-0.30; 2005-2013), HCB (~10 to ~230; 1996-2013), DDTs (~15 to ~50; 1996-2013), α-HCH (~1.0 to ~45; 1996-2013), β-HCH (~1.0 to ~23; 1996-2013), γ-HCH (~5.0 to ~75; 1996-2013), β-ENDO (1.5-273; 2005-2013), and PeCB (1.83-55.5; 2001-2013). The 2014 Global Monitoring Assessment Report [91] stated that HCB, DDTs, α-HCH, and PeCB showed a declining trend, while a statistically significant trend was not determined for β-HCH, γ-HCH, and β-ENDO at the EMEP station in Kosetice[91]. According to modeling calculations conducted by the Meteorological Synthesizing Centre-East (MSC-E), mean air concentrations of HCB in all northern countries of the Mediterranean region were estimated to be in the range of 39 to 66 pg·m-3 with a slight decreasing west-east trend and lower values for Malta and Cyprus[92]. In this context, the study results further confirm the declining trend in the region. On a compound-specific basis, the average concentrations of PeCB at Uludag (2.98 pg·m-3) and Abdali (5.07 pg·m-3) were lower compared to the concentration range reported for background sites of Sweden[93], Ghana[94] and Azerbaijan[95]. The average air concentrations of HCB at Uludag (14.03 pg·m-3) and Abdali (12.47 pg·m-3) were almost four times lower than average ambient HCB concentrations in the atmosphere of the northern hemisphere (~50 pg·m-3)[71] and approximately 10-16 times lower compared to France’s remote areas (161-240 pg·m-3)[92]. The levels of HCB at both sites were consistent with results from other background sites in Europe (11.89-38.79 pg·m-3)[30] and Ghana[94] but lower compared to levels in Switzerland[93], Croatia[96], Bosnia and Herzegovina[96], Australia[97], China[59, 98], Azerbaijan[95], Canada[99], and Korea[100].
The average concentrations of HCHs isomers (α, β, γ, and δ) at Uludag and Abdali sites were 0.10-21 pg·m-3, and levels detected in the current study were much lower compared to the results of previous studies conducted in Europe[30], Sicily[101], Switzerland[93], Croatia[96], Ghana[94], China[59], Azerbaijan[95], Korea[100], and Canada[99].
The average heptachlor concentration at Uludag (0.18 pg·m-3) was comparable to those reported in Switzerland[93], Argentina[102], Australia[97], Bolivia[103], and Korea[100].
TC and CC showed average concentrations between 0.45 and 1.05 pg·m-3 at Uludag and Abdali. This result is in the range of concentrations reported in Europe[30, 93], Korea[100], Kazakhstan[53], Tibet[104]), and Bolivia[103] but lower compared to levels in Canada[99, 105] and China[59, 98, 106]. Average TN (< IDL and 0.74 pg·m-3) and CN (0.119-0.85 pg·m-3) levels in Uludag and Abdali were comparable to levels in Bolivia[103] and Korea[100].
The average concentrations of o,p’-DDD (1.26 pg·m-3), o,p’-DDE (1.49 pg·m-3), p,p’-DDT (13.4 pg·m-3), and p,p’-DDD (5.55 pg·m-3) at the Uludag site were in the range of levels reported in Europe[30,93], Argentina[102], Tibet[104], Canada[99], and Korea[100], while lower than those observed in Ghana[94], Azerbaijan[95], and Argentina[102]. p,p’-DDE levels at the Uludag site were generally higher compared to levels reported in Europe[30], Korea[100], Canada[99], Australia[97], and Tibet[104] but lower compared to levels reported in Argentina[102], Canada[105], and Azerbaijan[95]. Similarly, DDT levels detected at the Abdali site were generally similar to levels in Europe[30,93], Tibet[104], Korea[100], and Canada[99] but lower compared to Ghana[94], Azerbaijan[95], Kazakhstan[53], China[59,98,106] and Argentina[102]. Overall, concentration levels detected in the current study were in the range of concentration levels reported in Europe and other parts of the world or lower than those reported in the literature.
Inhalation cancer risk
In laboratory research and environmental impact studies in the natural environment, exposure to POPs or their metabolites has been linked to endocrine disruption, reproductive and immunological dysfunction, brain and nervous system problems, developmental disorders, and cancer[107]. When widely spread in environmental compartments, these chemicals can have negative effects on the ecosystem and may pose direct health risks to humans. OCPs have been linked to a variety of specific cancers in numerous epidemiological studies[108]. Therefore, human exposure to OCPs and the associated health risk should be considered. In some studies, estimates of the potential risk to human health are mainly based on dietary intake; however, non-dietary pathways might also play an important role in the human health risk assessment of exposure to chemicals.
To investigate the environmental significance of the detected levels of the OCPs, the cancer risks from the lifetime exposure to OCPs via inhalation were calculated. In the current study, the lifetime average CR values for OCPs for adults ranged between 2.516 × 10⁻¹² (for DDD at Abdali, Kuwait) and 7.039 × 10⁻⁸ (for DDT at Kartaba, Lebanon) [Supplementary Table 7]. For children, the CR values ranged between 6.299 × 10⁻¹¹ (for DDD at Abdali, Kuwait) and 1.762 × 10⁻⁶ (for DDT at Kartaba, Lebanon) [Supplementary Table 8]. The cancer risk due to inhalation of OCPs in ambient air in the study areas was about 25 times higher for children than adults. The highest cancer risk was in Aldrin, and cancer risks for both adults and children were in the decreasing order: DDT > γ-HCH > heptachlor epoxide > DDD > DDE > α-HCH > HCB > heptachlor > β-HCH > chlordane (TC + CC). ∑-DDT inhalation also resulted in an increased CR at most studied sites[109]. The CR values determined for all sites were similar in the current study. According to USEPA[110], when the CR value is > 1 × 10⁻⁴, it is considered that humans are highly exposed to the risk of cancer. In contrast, values ranging between 1 × 10⁻⁶ and 1 × 10⁻⁴ indicate a potential risk, while a CR value < 1 × 10⁻⁶ means that the cancer risk is negligible. The CR values detected for children and adults in the current study at all sites were lower than 1 × 10⁻⁶; thus, the cancer risk due to inhalation of OCPs in ambient air is negligible in the studied countries. However, the CR values (1.263 × 10⁻⁶) calculated for ∑HCHs for children at the Kartaba site in Lebanon were around 1 × 10⁻⁶ and 1 × 10⁻⁴, respectively, indicating a potential risk.
As stated above, to compare the exposure ratios calculated in the current study to exposure ratios observed in the previous studies, CR values of target chemicals via inhalation were re-calculated for OCPs reported in the previous studies using Equations (1) and (2). When the CR values calculated within the scope of this study were compared to the CR values calculated using the OCP concentration values reported in studies conducted in different regions of the world, the results were similar in most cases. However, CR values for all compounds detected in studies conducted in China were slightly higher (~100 times) [Supplementary Table 7 and Supplementary Table 8] compared to CR values detected in the current study.
CONCLUSIONS
Validated polyurethane foam passive air samplers were used to simultaneously monitor OC pesticide concentrations at 12 sites in five Middle Eastern countries in order to establish baseline concentration levels across the region. Evidence was found for past and fresh use of DDT in the region based on the p,p’-DDE/p,p’-DDT and o,p’-DDT/p,p’-DDT ratios. The α/γ ratio indicates that the source of HCH across the Middle East may be the historical use of lindane. The concentration of other organochlorine compounds varied widely across the region.
The CR values determined for all the sites were similar in the current study. All of the CR values detected for children and adults in the present study at all sites were lower than 1 × 10⁻⁶ (negligible cancer risk range).
Kuwait is already a member of the GAPS Network. Therefore, this study is a first step to bridging the gap of a scarcity of POPs data in the Middle East, and data obtained in the current study will be reported to GAPS. Schuster et al.[111] recently tracked POPs in global air from the First 10 Years of the GAPS Network (2005-2014) and stated that a serious emphasis should be placed on enhancing the comparability of the data acquired from different POP monitoring networks to breach information gaps between regions. As mentioned above, the current monitoring study can act as a key research activity to initiate regular monitoring studies in the middle east region; hence, a similar monitoring study to be repeated every 3-4 years for legacy POPs appears to be needed for the region.
Further research is needed in the region to investigate the use of banned chemicals such as DDT and HCB, which could have anthropogenic sources such as combustion processes. The contribution of volatilization of OCPs from repositories such as contaminated soils to the regional atmospheric OCP levels should be assessed in further monitoring activities. The current study was a snapshot of atmospheric levels of OCPs in selected locations; however, it is necessary to have a regular environmental monitoring program to obtain more information on spatial and temporal trends that can be used as a basis for policy formulation. PCDD/Fs and PBDEs were also examined within the scope of the current study, and the manuscripts to report these chemicals are also in progress. The need for monitoring studies on new POPs that were listed under the SC in recent years should also be emphasized; however, these newer POPs are not covered by the current monitoring study.
DECLARATIONS
Acknowledgments
The current research was jointly funded by the Kuwait Foundation for the Advancement of Sciences (KFAS) under Grant No. P216-44WE-01, the Regional Organization for the Protection of the Marine Environment (ROPME), and Kuwait Institute for Scientific Research.
Authors’ contributions
Made substantial contributions to conception and design of the study, participant recruitment and performed data analysis and interpretation: Gevao B
Made substantial contributions to sample preparation, sample analysis, data analysis and interpretation, technical writing: Martinez-Guijarro K
Made substantial contribution to data analysis and interpretation, technical writing: Kurt-Karakus PB
Made substantial contributions to sample collection, data analysis and technical writing: Birgul A, Sukhn C, Krishnan D, Rajagopalan S, Hajeyah M, Bahloul M, Alshemmari H, Orif MI
Availability of data and materials
Extra data is published in the supplementary data.
Financial support and sponsorship
This project is funded by the Kuwait Foundation for the Advancement of Sciences (KFAS) under Grant No. P216-44WE-01, the Regional Organization for the Protection of the Marine Environment (ROPME), and Kuwait Institute for Scientific Research
Conflicts of interest
All authors declared that there are no conflicts of interest
Ethical approval and consent to participate
Consent was taken from participants.
Consent for publication
Not applicable.
Copyright
© The Author(s) 2022
Supplementary Materials
REFERENCES
1. Jones K, de Voogt P. Persistent organic pollutants (POPs): state of the science. Environmental Pollution 1999;100:209-21.
2. Wania F, Mackay D. Peer reviewed: tracking the distribution of persistent organic pollutants. Environ Sci Technol 1996;30:390A-6A.
3. Gouin T. Modelling the environmental fate of the polybrominated diphenyl ethers. Environment International 2003;29:717-24.
4. Ockenden WA. Global fractionation. Progress in environmental. Science 1999;1:119-151.
5. Atlas E, Giam CS. Ambient concentration and precipitation scavenging of atmospheric organic pollutants. Water Air Soil Pollut 1988;38:19-36.
6. Simonich SL, Hites RA. Global distribution of persistent organochlorine compounds. Science 1995;269:1851-4.
7. Wania F, Mackay D. Global fractionation and cold condensation of low volatility organochlorine compounds in polar regions. Ambio 1993;22:10-18.
8. AMAP. AMAP assessment 2016: chemicals of emerging arctic concern. Available from: https://www.amap.no/documents/doc/AMAP-Assessment-2016-Chemicals-of-Emerging-Arctic-Concern/1624 [Last accessed on 6 May 2022].
9. Daley JM, Corkum LD, Drouillard KG. Aquatic to terrestrial transfer of sediment associated persistent organic pollutants is enhanced by bioamplification processes. Environ Toxicol Chem 2011;30:2167-74.
10. Ikemoto T, Tu NP, Watanabe MX, et al. Analysis of biomagnification of persistent organic pollutants in the aquatic food web of the Mekong Delta, South Vietnam using stable carbon and nitrogen isotopes. Chemosphere 2008;72:104-14.
11. Kelly BC, Ikonomou MG, Blair JD, Morin AE, Gobas FA. Food web-specific biomagnification of persistent organic pollutants. Science 2007;317:236-9.
12. Mackay D, Wania F. Transport of contaminants to the Arctic: partitioning, processes and models. Science of The Total Environment 1995;160-161:25-38.
13. Schure AF, Larsson P, Agrell C, Boon JP. Atmospheric transport of polybrominated diphenyl ethers and polychlorinated biphenyls to the Baltic Sea. Environ Sci Technol 2004;38:1282-7.
14. Beyer A, Mackay D, Matthies M, Wania F, Webster E. Assessing long-range transport potential of persistent organic pollutants. Environ Sci Technol 2000;34:699-703.
15. Hong H, Xu L, Zhang L, Chen J, Wong Y, Wan T. Special guest paper. Marine Pollution Bulletin 1995;31:229-36.
16. Iwata H, Tanabe S, Sakai N, Tatsukawa R. Distribution of persistent organochlorines in the oceanic air and surface seawater and the role of ocean on their global transport and fate. Environ Sci Technol 1993;27:1080-98.
17. Saliot A, Bigot M, Bouloubassi I, Lipiatou E, Qiu Y, Scribe P. Transport and fate of hydrocarbons in rivers and their estuaries. Partitioning between dissolved and particulate phases: case studies of the Rhône, France, and the Huanghe and the Changjiang, China. Science of The Total Environment 1990;97-98:55-68.
18. Li YF, Cai DJ, Singh A. Technical hexachlorocyclohexane use trends in China and their impact on the environment. Arch Environ Contam Toxicol 1998;35:688-97.
19. Barakat AO. Assessment of persistent toxic substances in the environment of Egypt. Environment International 2004;30:309-22.
20. Prudente MS, Malarvannan G, Tanabe S. Persistent toxic substances in the philippine environment. Developments in Environmental Science 2007;7:559-85.
21. Barra R, Colombo JC, Eguren G, Gamboa N, Jardim WF, Mendoza G. Persistent organic pollutants (POPs) in Eastern and Western South American countries. Reviews of environmental contamination and toxicology ;2006:1-33.
22. UNEP. Report on progress in implementing the Road Map for the Development of Alternatives to DDT. Available from: https://wedocs.unep.org/bitstream/handle/20.500.11822/31829/RUEPIRDA.pdf?sequence=1&isAllowed=y [Last accessed on 6 May 2022].
23. Sergeev AV, Carpenter DO. Geospatial patterns of hospitalization rates for stroke with comorbid hypertension in relation to environmental sources of persistent organic pollutants: results from a 12-year population-based study. Environ Sci Pollut Res Int 2011;18:576-85.
24. Sergeev AV, Carpenter DO. Increase in metabolic syndrome-related hospitalizations in relation to environmental sources of persistent organic pollutants. Int J Environ Res Public Health 2011;8:762-76.
25. Ren A, Qiu X, Jin L, et al. Association of selected persistent organic pollutants in the placenta with the risk of neural tube defects. Proc Natl Acad Sci U S A 2011;108:12770-5.
26. Lim JS, Son HK, Park SK, Jacobs DR Jr, Lee DH. Inverse associations between long-term weight change and serum concentrations of persistent organic pollutants. Int J Obes (Lond) 2011;35:744-7.
27. Carpenter DO. Health effects of persistent organic pollutants: the challenge for the Pacific Basin and for the world. Rev Environ Health 2011;26:61-9.
28. Harner T, Shoeib M, Diamond M, Stern G, Rosenberg B. Using passive air samplers to assess urban-rural trends for persistent organic pollutants. 1. Polychlorinated biphenyls and organochlorine pesticides. Environ Sci Technol 2004;38:4474-83.
29. Pozo K, Harner T, Shoeib M, et al. Passive-sampler derived air concentrations of persistent organic pollutants on a north-south transect in Chile. Environ Sci Technol 2004;38:6529-37.
30. Jaward FM, Farrar NJ, Harner T, Sweetman AJ, Jones KC. Passive air sampling of polycyclic aromatic hydrocarbons and polychlorinated naphthalenes across Europe. Environmental Toxicology and Chemistry 2004;23:1355-64.
31. Markovic MZ, Prokop S, Staebler RM, Liggio J, Harner T. Evaluation of the particle infiltration efficiency of three passive samplers and the PS-1 active air sampler. Atmospheric Environment 2015;112:289-93.
32. Bogdal C, Scheringer M, Abad E, et al. Worldwide distribution of persistent organic pollutants in air, including results of air monitoring by passive air sampling in five continents. TrAC Trends in Analytical Chemistry 2013;46:150-61.
33. Harner T, Bartkow M, Holoubek I, et al. Passive air sampling for persistent organic pollutants: introductory remarks to the special issue. Environ Pollut 2006;144:361-4.
34. Pozo K, Harner T, Lee SC, Wania F, Muir DC, Jones KC. Seasonally resolved concentrations of persistent organic pollutants in the global atmosphere from the first year of the GAPS study. Environ Sci Technol 2009;43:796-803.
35. Gouin T, Harner T, Blanchard P, Mackay D. Passive and active air samplers as complementary methods for investigating persistent organic pollutants in the Great Lakes Basin. Environ Sci Technol 2005;39:9115-22.
36. UNEP. Global monitoring plan for persistent organic pollutants under the stockholm convention article 16 on effectiveness evaluation. Third regional monitoring report. Africa region. Available from: http://chm.pops.int/portals/0/download.aspx?d=UNEP-POPS-GMP-RMR-AFRICA-2021.English.pdf [Last accessed on 6 May 2022].
37. UNEP. Global monitoring plan for persistent organic pollutants under the stockholm convention article 16 on effectiveness evaluation. Third regional monitoring report. Asia-Pacific region. Available from: http://chm.pops.int/portals/0/download.aspx?d=UNEP-POPS-GMP-RMR-ASIAPACIFIC-2021.English.pdf. [Last accessed on 6 May 2022].
38. UNEP. Global monitoring plan for persistent organic pollutants under the stockholm convention article 16 on effectiveness evaluation. Third regional monitoring report. Central and Eastern European region. Available from: http://chm.pops.int/portals/0/download.aspx?d=UNEP-POPS-GMP-RMR-CEE-2021.English.pdf [Last accessed on 6 May 2022].
39. UNEP. Global Monitoring Plan For Persistent Organic Pollutants Under The Stockholm Convention Article 16 on Effectiveness Evaluation. Third regional monitoring report. Western Europe and Others Group (WEOG) region. Available from: http://chm.pops.int/portals/0/download.aspx?d=UNEP-POPS-GMP-RMR-WEOG-2021-REV1.English.pdf [Last accessed on 6 May 2022].
40. Gevao B, Porcelli M, Rajagopalan S, et al. Spatial and temporal variations in the atmospheric concentrations of “Stockholm Convention” organochlorine pesticides in Kuwait. Sci Total Environ 2018;622-623:1621-9.
41. Shoieb M, Harner T. Characterisation and comparison of three passive air samplers for persistent organic pollutants. Environ Sci Technol 2002;36:4142-51.
42. Harner T. Template for calculating effective air sample volumes for PUF and SIP disk sample. Available from: https://www.researchgate.net/publication/319764519_2017_v1_5_Template_for_calculating_Effective_Air_Sample_Volumes_for_PUF_and_SIP_Disk_Samplers_Sept_15. 2017 [Last accessed on 6 May 2022].
43. USEPA. Human health risk assessment protocol: chapter 7 risk and hazard characterization. Available from: https://archive.epa.gov/epawaste/hazard/tsd/td/web/pdf/05hhrap7.pdf [Last accessed on 6 May 2022].
44. USEPA. Exposure factors handbook 2011 edition (Final Report). Available from: https://cfpub.epa.gov/ncea/risk/recordisplay.cfm?deid=236252 [Last accessed on 6 May 2022].
45. U.S. Environmental Protection Agency. Age & environmental research online (HERO). Available from: https://hero.epa.gov/hero/index.cfm/reference/details/reference_id/783747 [Last accessed on 6 May 2022].
46. Wilford BH, Harner T, Zhu J, Shoeib M, Jones KC. Passive sampling survey of polybrominated diphenyl ether flame retardants in indoor and outdoor air in Ottawa, Canada: implications for sources and exposure. Environ Sci Technol 2004;38:5312-8.
47. Harner T, Ikonomou M, Shoeib M, Stern G, Diamond M. Passive air sampling results for polybrominated diphenyl ethers along an urban-rural transect. Organohalogen Compounds 2002;57:33-6.
48. Pozo K, Harner T, Wania F, Muir DC, Jones KC, Barrie LA. Toward a global network for persistent organic pollutants in air: results from the GAPS study. Environ Sci Technol 2006;40:4867-73.
49. Melymuk L, Robson M, Helm PA, Diamond ML. Evaluation of passive air sampler calibrations: Selection of sampling rates and implications for the measurement of persistent organic pollutants in air. Atmospheric Environment 2011;45:1867-75.
50. Bohlin P, Jones KC, Levin JO, Lindahl R, Strandberg B. Field evaluation of a passive personal air sampler for screening of PAH exposure in workplaces. J Environ Monit 2010;12:1437-44.
51. Harner T, Su K, Genualdi S, et al. Calibration and application of PUF disk passive air samplers for tracking polycyclic aromatic compounds (PACs). Atmospheric Environment 2013;75:123-8.
52. Herkert NJ, Martinez A, Hornbuckle KC. A Model Using Local Weather Data to Determine the Effective Sampling Volume for PCB Congeners Collected on Passive Air Samplers. Environ Sci Technol 2016;50:6690-7.
53. Jaward FM, Farrar NJ, Harner T, Sweetman AJ, Jones KC. Passive air sampling of PCBs, PBDEs, and organochlorine pesticides across Europe. Environ Sci Technol 2004;38:34-41.
54. Kurt-karakus PB, Ugranli-cicek T, Sofuoglu SC, et al. The first countrywide monitoring of selected POPs: Polychlorinated biphenyls (PCBs), polybrominated diphenyl ethers (PBDEs) and selected organochlorine pesticides (OCPs) in the atmosphere of Turkey. Atmospheric Environment 2018;177:154-65.
55. Pozo K, Harner T, Lee SC, et al. Assessing seasonal and spatial trends of persistent organic pollutants (POPs) in Indian agricultural regions using PUF disk passive air samplers. Environ Pollut 2011;159:646-53.
56. Chakraborty P, Zhang G, Li J, et al. Selected organochlorine pesticides in the atmosphere of major Indian cities: levels, regional versus local variations, and sources. Environ Sci Technol 2010;44:8038-43.
57. Shunthirasingham C, Oyiliagu CE, Cao X, et al. Spatial and temporal pattern of pesticides in the global atmosphere. J Environ Monit 2010;12:1650-7.
58. Wurl O, Obbard JP. Organochlorine compounds in the marine atmosphere of Singapore. Atmospheric Environment 2005;39:7202-16.
59. Cheng H, Zhang G, Jiang JX, et al. Organochlorine pesticides, polybrominated biphenyl ethers and lead isotopes during the spring time at the Waliguan Baseline Observatory, northwest China: implication for long-range atmospheric transport. Atmospheric Environment 2007;41:4734-47.
60. Walker K, Vallero DA, Lewis RG. Factors influencing the distribution of lindane and other hexachlorocyclohexanes in the environment. Environ Sci Technol 1999;33:4373-8.
61. Su Y, Hung H, Blanchard P, et al. Spatial and seasonal variations of Hexachlorocyclohexanes (HCHs) and hexachlorobenzene (HCB) in the Arctic atmosphere. Environ Sci Technol 2006;40:6601-7.
62. Li YF, Macdonald RW. Sources and pathways of selected organochlorine pesticides to the Arctic and the effect of pathway divergence on HCH trends in biota: a review. Sci Total Environ 2005;342:87-106.
63. Mendis K, Rietveld A, Warsame M, Bosman A, Greenwood B, Wernsdorfer WH. From malaria control to eradication: the WHO perspective. Trop Med Int Health 2009;14:802-9.
64. Halse AK, Schlabach M, Eckhardt S, Sweetman A, Jones KC, Breivik K. Spatial variability of POPs in European background air. Atmos Chem Phys 2011;11:1549-64.
65. Jawdeh GA; Lebanese Environmental Forum (LEF). International POPs elimination project. Available from: https://ipen.org/sites/default/files/documents/4leb_lebanon_country_situation_report-en.pdf [Last accessed on 6 May 2022].
66. Turgut C, Gokbulut C, Cutright TJ. Contents and sources of DDT impurities in dicofol formulations in Turkey. Environ Sci Pollut Res Int 2009;16:214-7.
67. Koblizkova M, Genualdi S, Lee SC, Harner T. Application of sorbent impregnated polyurethane foam (SIP) disk passive air samplers for investigating organochlorine pesticides and polybrominated diphenyl ethers at the global scale. Environ Sci Technol 2012;46:391-6.
68. Shen L, Wania F, Lei YD, Teixeira C, Muir DC, Bidleman TF. Atmospheric distribution and long-range transport behavior of organochlorine pesticides in North America. Environ Sci Technol 2005;39:409-20.
69. UNEP. Stockholm convention on persistent organic pollutants. Report of the conference of the parties of the stockholm convention on persistent organic pollutants on the work of its fourth meeting. 2009. Available at Available from: http://chm.pops.int/Portals/0/download.aspx?d=UNEP-POPS-COP.4-38.English.pdf [Last accessed on 6 May 2022]
70. Bailey RE, van Wijk D, Thomas PC. Sources and prevalence of pentachlorobenzene in the environment. Chemosphere 2009;75:555-64.
71. Barber JL, Sweetman AJ, van Wijk D, Jones KC. Hexachlorobenzene in the global environment: emissions, levels, distribution, trends and processes. Sci Total Environ 2005;349:1-44.
72. Liu X, Zhang G, Li J, et al. Seasonal patterns and current sources of DDTs, chlordanes, hexachlorobenzene, and endosulfan in the atmosphere of 37 Chinese cities. Environ Sci Technol 2009;43:1316-21.
73. Ozcan S, Aydin ME. Polycyclic aromatic hydrocarbons, polychlorinated biphenyls and organochlorine pesticides in urban air of Konya, Turkey. Atmospheric Research 2009;93:715-22.
74. Bossi R, Skov H, Vorkamp K, et al. Atmospheric concentrations of organochlorine pesticides, polybrominated diphenyl ethers and polychloronaphthalenes in Nuuk, South-West Greenland. Atmospheric Environment 2008;42:7293-303.
75. Park JS, Shin SK, Kim WI, Kim BH. Residual levels and identify possible sources of organochlorine pesticides in Korea atmosphere. Atmospheric Environment 2011;45:7496-502.
76. Li J, Zhang G, Guo L, et al. Organochlorine pesticides in the atmosphere of Guangzhou and Hong Kong: regional sources and long-range atmospheric transport. Atmospheric Environment 2007;41:3889-903.
77. Sovoccol GW, Lewis RG, Harless RL, Wilson NK, Zehr RD. Analysis of technical chlordane by gas chromatography/mass spectrometry. Anal Chem 1977;49:734-40.
78. Buser HR, Mueller MD. Enantioselective determination of chlordane components, metabolites, and photoconversion products in environmental samples using chiral high-resolution gas chromatography and mass spectrometry. Environ Sci Technol 1993;27:1211-20.
79. Mattina MJI, Iannucci-berger W, Dykas L, Pardus J. Impact of long-term weathering, mobility, and land use on chlordane residues in soil. Environ Sci Technol 1999;33:2425-31.
80. Jantunen LMM, Bidleman TF, Harner T, Parkhurst WJ. Toxaphene, chlordane, and other organochlorine pesticides in Alabama air. Environ Sci Technol 2000;34:5097-105.
81. Offenberg JH, Naumova YY, Turpin BJ, et al. Chlordanes in the indoor and outdoor air of three U.S. cities. Environ Sci Technol 2004;38:2760-8.
82. Harner T, Bidleman TF, Jantunen LMM, Mackay D. Soil-air exchange model of persistent pesticides in the United States cotton belt. Environ Toxicol Chem 2001;20:1612-21.
83. Mcconnell LL, Lenoir JS, Datta S, Seiber JN. Wet deposition of current-use pesticides in the Sierra Nevada mountain range, California, USA. Environ Toxicol Chem 1998;17:1908-16.
84. Yeo H, Choi M, Sunwoo Y. Seasonal variations in atmospheric concentrations of organochlorine pesticides in urban and rural areas of Korea. Atmospheric Environment 2004;38:4779-88.
85. Batterman SA, Chernyak SM, Gounden Y, Matooane M, Naidoo RN. Organochlorine pesticides in ambient air in Durban, South Africa. Sci Total Environ 2008;397:119-30.
86. Alegria HA, Wong F, Jantunen LM, et al. Organochlorine pesticides and PCBs in air of southern Mexico (2002-2004). Atmospheric Environment 2008;42:8810-8.
87. Zheng X, Chen D, Liu X, et al. Spatial and seasonal variations of organochlorine compounds in air on an urban-rural transect across Tianjin, China. Chemosphere 2010;78:92-8.
88. Yang Y, Li D, Mu D. Levels, seasonal variations and sources of organochlorine pesticides in ambient air of Guangzhou, China. Atmospheric Environment 2008;42:677-87.
89. Li H, Feng J, Sheng G, et al. The PCDD/F and PBDD/F pollution in the ambient atmosphere of Shanghai, China. Chemosphere 2008;70:576-83.
90. POPs GMP data visualization and analysis. Stockholm convention-global monitoring plan for persistent organic pollutants (POPs). Available from: https://www.pops-gmp.org/index.php?pg=background [Last accessed on 6 May 2022].
91. Šebková K, Borůvková J, Přibylová P, et al. Global monitoring plan for persistent organic pollutants. Under the stockholm convention article 16 on effectiveness evaluation. Second regional monitoring report. Central and Eastern European (CEE) and Central Asian Region. Available from: file:///D:/UNEP-POPS-GMP-RMR-CEE-2015.English.pdf [Last accessed on 6 May 2022].
92. UNEP. Regionally based assessment of persistent toxic substances: Mediterranean regional report/United Nations environment programme, chemicals; global environment facility. Available from: https://digitallibrary.un.org/record/487298/files/mediterranean-report.pdf [Last accessed on 6 May 2022].
93. Kirchner M, Jakobi G, Körner W, et al. Ambient air levels of organochlorine pesticides at three high alpine monitoring stations: trends and dependencies on geographical origin. Aerosol Air Qual Res 2016;16:738-51.
94. Adu-Kumi S, Kareš R, Literák J, et al. Levels and seasonal variations of organochlorine pesticides in urban and rural background air of southern Ghana. Environ Sci Pollut Res Int 2012;19:1963-70.
95. Aliyeva G, Kurkova R, Hovorkova I, Klánová J, Halsall C. Organochlorine pesticides and polychlorinated biphenyls in air and soil across Azerbaijan. Environ Sci Pollut Res Int 2012;19:1953-62.
96. Radonic J, Sekulic MT, Miloradov MV, Cupr P, Klánová J. Gas-particle partitioning of persistent organic pollutants in the Western Balkan countries affected by war conflicts. Environ Sci Pollut Res Int 2009;16:65-72.
97. Wang X, Kennedy K, Powell J, et al. Spatial distribution of selected persistent organic pollutants (POPs) in Australia’s atmosphere. Environ Sci Process Impacts 2015;17:525-32.
98. Zhan L, Lin T, Wang Z, et al. Occurrence and air-soil exchange of organochlorine pesticides and polychlorinated biphenyls at a CAWNET background site in central China: Implications for influencing factors and fate. Chemosphere 2017;186:475-87.
99. Daly GL, Lei YD, Teixeira C, Muir DC, Wania F. Pesticides in western Canadian mountain air and soil. Environ Sci Technol 2007;41:6020-5.
100. Liu J, Wang H, Song S, et al. Levels, potential sources and risk assessment of organochlorine pesticides in atmospheric particulate matter at regional background site. Aerosol Air Qual Res 2019;19:2008-16.
101. Pozo K, Palmeri M, Palmeri V, et al. Assessing persistent organic pollutants (POPs) in the Sicily Island atmosphere, Mediterranean, using PUF disk passive air samplers. Environ Sci Pollut Res Int 2016;23:20796-804.
102. Pegoraro CN, Wannaz ED. Occurrence of persistent organic pollutants in air at different sites in the province of Córdoba, Argentina. Environ Sci Pollut Res Int 2019;26:18379-91.
103. Estallano VH, Pozo K, Harner T, Franken M, Zaballa M. Altitudinal and seasonal variations of persistent organic pollutants in the Bolivian Andes Mountains. Environ Sci Technol 2008;42:2528-34.
104. Xiao H, Kang S, Zhang Q, et al. Transport of semivolatile organic compounds to the Tibetan Plateau: Monthly resolved air concentrations at Nam Co. J Geophys Res 2010:115.
105. Motelay-Massei A, Harner T, Shoeib M, Diamond M, Stern G, Rosenberg B. Using passive air samplers to assess urban-rural trends for persistent organic pollutants and polycyclic aromatic hydrocarbons. 2. Seasonal trends for PAHs, PCBs, and organochlorine pesticides. Environ Sci Technol 2005;39:5763-73.
106. Liu D, Xu Y, Li J, et al. Organochlorinated compounds in the air at NAEO, an eastern background site in China: long-range atmospheric transport versus local sources. Aerosol Air Qual Res 2014;14:1258-68.
107. Street ME, Angelini S, Bernasconi S, et al. Current knowledge on endocrine disrupting chemicals (EDCs) from animal biology to humans, from pregnancy to adulthood: highlights from a national Italian meeting. Int J Mol Sci 2018;19:1647.
108. J; Australian Rural Health Research Collaboration. DDT and human health. Sci Total Environ 2006;355:78-89.
109. Guida Y, Carvalho GO, Capella R, et al. Atmospheric occurrence of organochlorine pesticides and inhalation cancer risk in urban areas at Southeast Brazil. Environ Pollut 2021;271:116359.
110. USEPA. Guidelines for carcinogen risk assessment. Available from: https://www.epa.gov/sites/default/files/2013-09/documents/cancer_guidelines_final_3-25-05.pdf [Last accessed on 6 May 2022].
Cite This Article
How to Cite
Download Citation
Export Citation File:
Type of Import
Tips on Downloading Citation
Citation Manager File Format
Type of Import
Direct Import: When the Direct Import option is selected (the default state), a dialogue box will give you the option to Save or Open the downloaded citation data. Choosing Open will either launch your citation manager or give you a choice of applications with which to use the metadata. The Save option saves the file locally for later use.
Indirect Import: When the Indirect Import option is selected, the metadata is displayed and may be copied and pasted as needed.
About This Article
Copyright


Comments
Comments must be written in English. Spam, offensive content, impersonation, and private information will not be permitted. If any comment is reported and identified as inappropriate content by OAE staff, the comment will be removed without notice. If you have any queries or need any help, please contact us at [email protected].