

fig6
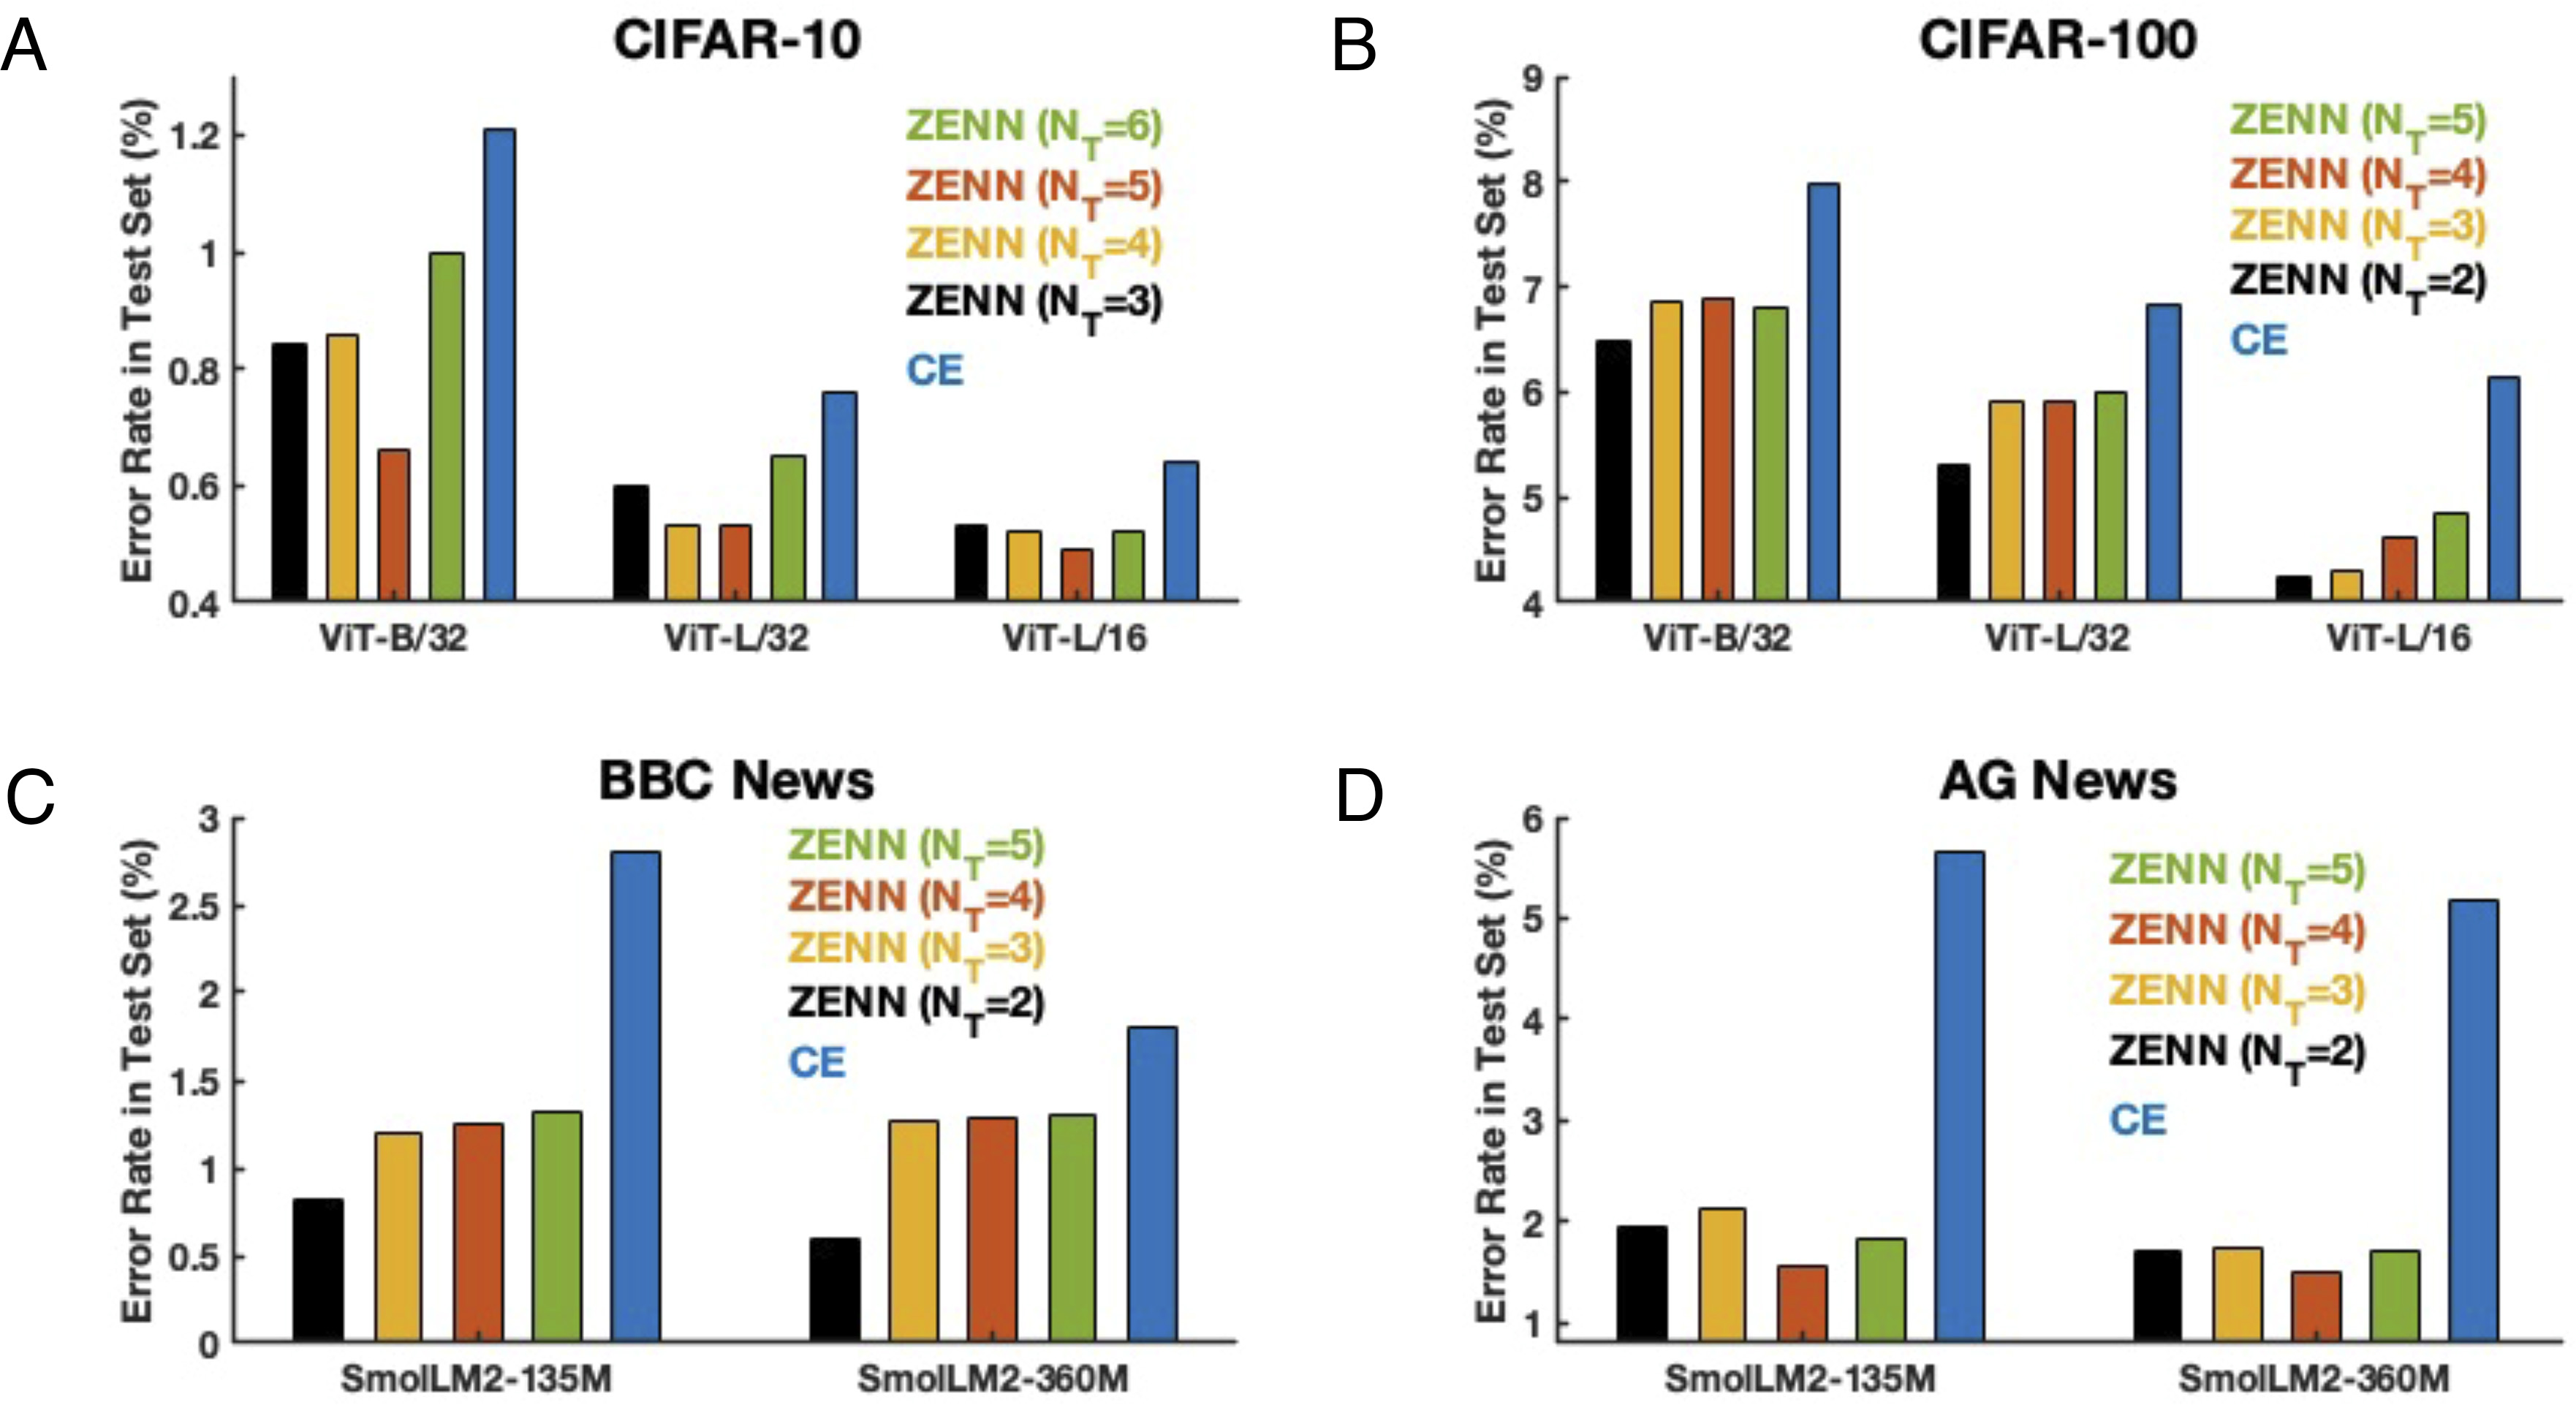
Figure 6. Error rate comparison between cross-entropy (CE) and cross-zentropy (ZENN) on both image and text datasets: (A) and (B) three ViT on CIFAR-10 and CIFAR-100 image datasets; (C) and (D) two language models (SmolLM) on BBC News and AG News text datasets. NT denotes the number of temperature modes. Reprint with Creative Commons Attribution-NonCommercial-NoDerivatives License 4.0 (CC BY-NC-ND) [2]. ViT: Vision Transformer; ZENN: Zentropy-Enhanced Neural Network.

